The Standard LBO Modeling Test is the most common type of modeling exercise an interviewee will be given during the private equity recruiting cycle.
The LBO modeling test we’ll go through here reflects the level of difficulty that all candidates should expect to encounter during most interviews, which is particularly true if you’re coming from a non-traditional background such as management consulting or deal advisory practice at a Big Four.
The level of difficulty found in this standard LBO model test is the bare minimum a candidate coming from the more typical investment banking route should be prepared for.
Standard LBO Modeling Test: 90-Minute Practice Tutorial
If you're completely new to this, you should start by reviewing those before moving on to a full model practice test such as our short-form LBO modeling test that precedes this intermediate-level test.
The chart below summarizes when you should expect to see PE technical interview questions and LBO tests throughout the recruiting process:
Type
Description
Technical Interview Questions
For investment banking analysts, you'll likely not see a lot of these as it's usually assumed you have this down. You're more likely to see this in the first round if you come from a non-traditional background.
Usually given at early rounds, you'll be handed only pen and paper and 5-10 minutes to arrive at an implied IRR and other key metrics based on the information provided in the prompt.
The LBO Modeling Test is a near certainty at later rounds. The level of difficulty will, however, vary and can be broken up into 3 broad buckets:
Basic LBO Modeling Test - A relatively easy practice test that usually takes around 45 minutes (and an hour at most). If you're finding the standard test in this article to be difficult, you should go back and start with this one.
Standard LBO Modeling Test(*This Tutorial*)- This is the level of difficulty that we're going to cover here in this post. You're usually given about 1-hour minimum (and up to 2 hours at the most). At traditional lower-middle market funds, you may only be given this Standard Model Test, while mega-funds and upper-middle market funds are known for giving more advanced modeling tests – albeit, this can differ by each recruiting cycle.
Advanced LBO Modeling Test- You're most likely to see this from the mega-funds or upper-middle market funds, especially for those categorized as "specialists" (e.g. special situations). Can be given as much as 4 hours.
PE Recruiting Process
Note that you're not likely to see all of these or in this exact order - for example, you might get a standard LBO model test right off the bat coupled with some technical interview questions.
The reason being, time is of the essence as these PE firms are competing with each other to grab the best candidates that come from the same pool for the most part (i.e. BBs, EBs, MBB).
Thus, dragging out the process with more tests increases the chance that one might accept an offer elsewhere. In many cases, PE firms will intentionally extend what is called an "exploding offer" where the candidate only has a few days (or even just a day) to accept or decline an offer.
How Important is the LBO Modeling Test?
Doing a good job on this test is not - on its own - enough to receive an offer. However, a lackluster submission may be the reason you don't receive an offer.
To get the offer, you'll also need to ace the behavioral portion of the interview, deal (or investment) discussion, and case study.
How Are Modeling Tests "Graded"?
The grading system is pretty straightforward and could be best described as “check the box”. The person responsible for reviewing your model, most often one of the younger associates, will not be questioning your assumptions or assessing your ability to interpret the model.
But rather, the associate is confirming the instructions were correctly followed. If the model was built properly, the process of reviewing your work should take no more than fifteen minutes at most. As such, a huge part of doing well under stress is attention to detail.
More Time Consuming (1 to 2 Hours): Because the instructions are more extensive with more moving pieces, you will be given more time to complete the model – the caveat being, mistakes in your model are penalized more since you were given more time to go back and check your work.
Full 3-Statement Build: To confirm you understand the financial statements linkages, you will be asked to build out the income statement, balance sheet, and cash flow statement – this can actually be beneficial because it provides you with more opportunities to check your model and catch mistakes (i.e. if the B/S doesn’t balance, you made an error somewhere).
Additional Features: In the Basic LBO Modeling Test, we introduced the core mechanisms of an LBO model such as the Sources & Uses table, the free cash flow build, a simplistic debt schedule (e.g. revolver mechanics, floating vs. fixed pricing, mandatory amortization), and returns calculation.
In this practice test below, we're going to add a few features you should be ready for, as they are commonly tested, including:
The standard LBO modeling test is a practical way to assess private equity modeling skills but often suffers from time pressure and the risk of manual error. Artificial intelligence enhances the LBO test process by instantly validating assumptions, modeling scenarios, and uncovering strategic insights in real time. Wall Street Prep partnered with Columbia Business School Executive Education to launch the AI for Business & Finance Certificate Program, which equips professionals with the tools to elevate their financial modeling capabilities and deliver accurate results with speed and confidence—especially in private equity modeling environments.
Let's now get straight into the model tutorial. Keep in mind that, unlike the previous article, we will presume you have a decent understanding of the financial modeling best practices and the mechanics of an LBO model.
For example, we'll not be explaining the circularity toggle, revolver functionality, etc.
LBO Model Instructions
A private equity firm is evaluating a potential leveraged buyout of JoeCo, a privately held coffee company. In the last twelve months, JoeCo generated $715mm in revenue and $50mm in EBITDA.
Assume the PE firm acquired 80% of JoeCo’s equity at an entry multiple of 12.5x LTM EBITDA with the remaining 20% being rolled over by the existing management team.
Based on the assumptions provided below, calculate the IRR and MOIC from the investment with an operating 3-statement model and provide answers for the following questions:
Questions
What is the implied IRR and MOIC if the PE firm exits JoeCo at the same multiple as entry in a five-year horizon?
At what multiple would the PE firm need to exit JoeCo at to achieve a 3.0x MOIC after a five-year holding period?
If the firm’s minimum IRR threshold is 15%, what is the lowest multiple the PE firm could sell JoeCo at while still meeting the return hurdle?
Operational Assumptions
LTM Revenue was $715mm and is expected to grow 8% in 2021 – then in the years onward, the growth rate will increase incrementally by 0.5% each year
LTM Gross margin was 31.5% and this figure is expected to increase by 0.2% each year
SG&A, R&D, and D&A as a percentage of revenue will remain constant throughout the entire holding period (i.e. SG&A: 21%, R&D: 3.5%, and D&A: 1.4%)
Capex as a percentage of revenue will be 2.0% each year
An annual monitoring fee of $2mm will be paid to the private equity firm
Use a tax rate of 35%
Transaction Assumptions
Entry multiple to purchase JoeCo was 12.5x LTM EBITDA
Date of transaction closing was 12/31/2020
Transaction fees paid to the investment banks, consultants, and accountants were $10mm
Cash to B/S will be $5mm
Existing management team has agreed to rollover 20.0% equity
Financing fees will be 2.5% for all debt tranches (excluding the revolver) and will be amortized over a 7 year period
Intangible assets will be written up as 10.0% of the purchase premium with a useful life assumption of 15 years
PP&E was written up 20.0% from its LTM balance with a useful life assumption of 10 years
Financing Assumptions
Revolving credit line ("Revolver") was left undrawn at purchase, priced at LIBOR + 400, the max capacity is 75% of LTM Inventory and AR, and the unused commitment fee is 0.25%
Term Loan B ("TLB") was raised at 3.5x EBITDA, priced at LIBOR + 400 with a 2% Floor, 5% mandatory amortization, and 100% cash sweep
Senior Notes were raised at 1.5x EBITDA and has an interest rate of 7.0%
The final debt tranche used were Subordinated Notes ("Sub Notes"), which were raised at 1.0x EBITDA – carries a 12.5% interest rate, of which 8.5% is cash interest and 4% is paid-in-kind ("PIK")
There is no prepayment optionality for neither the Senior Notes nor the Sub Notes
Assume all debt instruments have a 7 year term
LBO Modeling Test – Excel Template
We’ll now move on to a modeling exercise, which you can access by filling out the form below.
Get the Excel Template!
You’re logged in! Form submission not required. Access your file below.
As you can see in the "Financials" tab, the LTM income statement and balance sheet of JoeCo were provided. This is the format the financials will generally be provided in.
For short tests, the prompt is usually written out near the financials in 5-10 bullet points. But for longer model tests (such as this one), the prompt is typically provided separately in either a Word doc or PDF.
Step 1. Model Assumptions
Entry Valuation
Per usual, the first step to building an LBO model is to determine the initial valuation of the company at purchase. Since this deal was completed on a "Cash-Free, Debt-Free" Basis, the purchase price will be equal to the purchase Enterprise Value ("TEV").
JoeCo's LTM EBITDA is $50mm and the entry multiple paid was 12.5x – thus, the purchase enterprise value is $625mm.
Transaction Assumptions
Moving onto the transaction assumptions, the transaction fees were $10mm, Cash to B/S is $5mm, financing fees amortization period is 7 years, and the tax rate to be used is 35%.
The one new line item included is "Rollover Equity %", which amounts to 20% as given by the prompt.
Rollover equity means the management team of JoeCo has decided to carry over a portion of their existing shares into the recapitalized company to participate in the potential upside of this LBO.
As a side note, in this particular scenario, the 20% does NOT mean that management is rolling over 20% of their pre-LBO equity, but rather their rollover will represent 20% of the post-LBO equity (i.e., plug the remaining equity needed).
Since the sponsor’s investment is 80% of the required equity contribution, then the management rollover comprises the rest, the leftover 20%.
In the prompt, we are specifically told the sponsor holds an 80% implied ownership stake, which is a sign that the rollover equity can be calculated using this simplified approach. When it comes to basic and standard LBO modeling tests, this method is very common to see, the other being a hardcoded amount.
Debt Financing Assumptions
To finish the model assumptions section, the remaining portion is the debt assumptions table that lays out the terms of the various debt instruments used.
The leverage multiples by debt tranche were 3.5x for Term Loan B ("TLB"), 1.5x for the Senior Notes, and 1.0x for the Subordinated Notes ("Sub Notes")
This amounts to total leverage of 6.0x, meaning $300mm of debt was raised to fund the purchase of JoeCo. To break this amount out by tranche:
$175mm raised via TLB
$75mm raised via Senior Notes
$50mm raised via Sub Notes
Revolver and Term Loan B are priced at a floating rate of "LIBOR + 400" with the TLB having a floor of 2%.
The TLB is the only debt tranche with required amortization payments of 5% each year with a full 100% cash sweep.
Senior Notes and Sub Notes are both priced at fixed rates – 7.0% and 12.5% respectively
One notable difference is that only 8.5% of the sub notes are paid-in-cash, with the remaining 4% paid-in-kind ("PIK").
What is PIK Interest?
PIK interest is a form of non-cash payment – rather than being an actual cash outflow, the interest expense instead accrues to the ending debt balance. From the perspective of JoeCo, opting for PIK will conserve cash in the current period and will be a non-cash add-back on the cash flow statement. But given how interest is based upon the beginning and ending balances of debt, this obligation compounds on an annual basis and is a riskier feature of financing.
As we can see on the right side of the debt assumptions table, the financing fee % for all of the tranches of debt (excluding the revolver) is 2.5% – thus, the total financing fees incurred comes out to be $8mm, which will be capitalized and amortized over the 7-year term.
Step 1: Formulas Used
Purchase Enterprise Value = LTM EBITDA × Entry Multiple
Management Rollover Equity – Positive Signal to Buyers?
Management rollover of equity is usually viewed as a welcome signal by the PE sponsors. Why?
Simply put, the management team now has "skin in the game". The implication being, management not only has an incentive to meet their financial targets, but they actually have something tangible to lose.
1. Rollover vs. Earnout for Aligning Management and Sponsor Interests
Contrast this with another tool used by financial buyers (PE firms) to incentivize management: The Management Earn-Out, With an earnout, the management team will earn a performance-based bonus based upon reaching a certain milestone (most often an EBITDA target).
But unlike with rollover, management's incentive is to hit a relatively short-term target - usually sales or EBITDA over the next 1-2 years - at all costs. Optimizing for short-term sales or EBITDA vs overall value creation could lead to a misalignment of interests.
Had that same management team owned equity in the business, the incentive to reach the financial targets remains, but better aligns management with the sponsor.
2. Rollover Demonstrates that Management's Belief in Own Growth Story
Another reason management rollover is a positive signal is it demonstrates that the management team actually believes in the growth prospects of the business. There are obvious exceptions to this rule (e.g. retirement, divorce, death in the family, career change), but for the most part – a management team that intends to stay on and believes in the growth trajectory pitched in the sell-side marketing (i.e. roadshows) to prospective investors should want to retain some equity.
Again, this is ultimately a judgment call by the private equity firm, it is absolutely not a clear-cut rule the management must rollover equity, but it is something that should be taken into consideration during the diligence phase. On the flip side, the existing management team (even if they have expressed their desire to participate in the LBO and rollover equity) may not even be the most ideal team to lead the recapitalized company, and thus could be replaced upon completion of the deal.
Step 2. Sources and Uses of Funds Table
Onto the next step, we will now complete the Sources & Uses table – which outlines how much the acquisition of JoeCo will cost and how much debt and equity will be required by the private equity firm to fund the transaction.
Uses Side
Starting on the "Uses" side, we have already calculated the purchase price as $625mm and can link to the relevant "Purchase Enterprise Value" cell.
Next, the Cash to B/S is $5mm, this means JoeCo's cash balance cannot dip below this pre-determined level post-closing and thereby increases the amount in funding required.
To finish the Uses side of the table, the transaction fees were $10mm while the financing fees were $8mm as previously calculated.
So to acquire JoeCo, the private equity firm requires $648mm in total funding.
Sources Side
The appearance of the "Sources" side of the table and the calculations will be slightly different because of the additional source of equity funding, the management rollover.
Starting with the debt tranches, we can just link the debt amounts from the debt assumptions table where we have already calculated the amounts raised based on the turns of EBITDA. In total, $300mm in debt was raised to fund this purchase.
Now we move onto the equity portion of the funding, which will amount to the remaining amount of funding required post-debt financing.
Given the existing management team has rolled over 20% equity, we must calculate the amount of the rollover in dollar terms.
But first, we must calculate the total equity contribution required from the rollover and sponsor. To do so, we take the $648mm in "Total Uses" and deduct the $300mm in "Total Debt". This is the residual amount of equity necessary, but the key distinction is that the private equity firm did not purchase 100% of JoeCo's equity.
The subsequent step is to multiply the 20% rollover equity assumption by the $348mm in required equity to get $70mm as the amount rolled over by the management team into the new, post-LBO entity.
Finally, to determine the initial equity investment by the private equity firm, we calculate the "plug" by deducting the $70mm in management rollover from the $348mm in required equity. So, the rollover equity is 20% of the required equity, $70mm (20% x $348mm), while the sponsor equity is 80% of the required equity, $278mm (80% x $348mm).
Once that is done, we see the sponsor contribution was $278mm and both sides of the table are now in balance.
Step 2: Formulas Used
Total Uses = Purchase Enterprise Value + Cash to B/S + Transaction Fees + Financing Fees
Total Debt Raised = Revolver + Term Loan B + Senior Notes + Subordinated Notes
Total Equity = Total Uses – Total Debt Raised
Rollover Equity = Total Equity x Rollover Equity %
Sponsor Equity = Total Equity – Rollover Equity
Total Sources = Total Debt + Total Equity
Step 3. Purchase Price Allocation (PPA)
Now that the transaction structure has been set up, the next step is to create the closing balance sheet, which refers to the pro forma balance sheet after the deal adjustments have been accounted for.
Before we can put the closing B/S together, we must first calculate the amount of goodwill created from an acquisition accounting practice referred to as purchase price allocation ("PPA").
The purpose of PPA is to identify and assign the fair value of the acquired tangible and intangible assets and liabilities as of the date of transaction closing.
The fundamental equation of PPA sets the assets acquired and liabilities assumed equal to the value of the consideration paid before making the necessary adjustments. Once the adjustments have been made, the remaining difference between the purchase price and the fair value of the acquired assets and assumed liabilities will be recognized as Goodwill on the balance sheet.
Purchase Premium
All acquirers, whether strategics or financial buyers are required to perform purchase price allocation to disclose the fair values of the purchased assets. For nearly all cases, the purchase price will exceed the fair value of the acquired assets and liabilities (i.e. a purchase premium was paid) – thus, the resulting excess leads to the creation of goodwill.
The first step in purchase price allocation is to determine the purchase equity value. We calculated the purchase enterprise price earlier, therefore we need to deduct the net debt. Taking a look at JoeCo's LTM financials, we see that JoeCo has $100mm in existing debt and $50mm in cash – thus, the net debt is $50mm and the purchase price to acquire JoeCo's equity was $575mm.
In its simplest form, the pro forma goodwill is calculated as the purchase equity value minus the book value of equity plus the existing goodwill. The reason we wipe out the existing equity book value is that it no longer exists (i.e. will be replaced by the new equity investment) and then we add existing goodwill because we would be double-counting it if we did not.
The rationale behind why we wipe out the existing equity shareholder value and goodwill will make more sense later when we walk through the closing B/S.
So if we take the $575mm in purchase equity value, subtract the book value of equity of $115mm, and add the $28mm in existing goodwill – we arrive at a purchase premium of $488mm. If there are no other fair value adjustments, this would be the total amount of goodwill created that would then flow into the closing B/S.
Put another way, this is the total amount of goodwill required to properly function as the "plug" for both sides of the closing B/S to balance.
Pro Forma Goodwill
Notice in our model, the line item that captures the excess of the fair value of the assets over the book value is named "Allocable Purchase Premium".
The reason being, the purchase premium (and the amount of goodwill created) can be affected by the write-ups / write-downs during the acquisition accounting process.
In this example, the prompt mentioned two adjustments that will impact the goodwill created in this transaction: 1) Intangible Assets Write-up and 2) PP&E Write-up
So, what are the implications of intangible asset and PP&E write-ups on the creation of goodwill?
Since goodwill is meant to plug the difference between the purchase price and fair value of the assets in the closing B/S – a higher write-up implies the assets being purchased are actually worth more. In other words, the valuation appraisers determined that the intangible assets and PP&E of JoeCo are worth more and therefore need to be appropriately adjusted on the closing B/S to better reflect their fair value.
As a result – the more JoeCo's intangible assets and PP&E are written up, the less goodwill will have to be created on the date of the transaction.
Intangible Assets Write-Up
Oftentimes, acquired intangible assets such as patents, intellectual property (IP), trademarks, customer/supplier relationships (i.e. contracts) can be revalued and written up in value.
Here, the write-up of the intangible assets has been provided as 10.0% of the allocable purchase premium. If we multiply the write-up percentage assumption of 10.0% by the purchase premium of $488mm, we get to $49mm as the intangible assets write-up.
Since write-ups reduce the amount of goodwill created, a minus sign must therefore be placed in front of the formula.
Another implication of the write-ups of intangible assets is the increased amortization. The useful life of the intangible assets was provided as 15 years, therefore we can divide the $49mm by 15 to get an incremental amortization expense of $3mm each year.
PP&E Write-Up
Next, we will calculate the write-up of JoeCo's PP&E. The percentage assumption for PP&E is 20.0%, but this was stated in terms of a step-up of the existing PP&E balance rather than a percentage of the allocable purchase premium like the intangible assets.
Therefore, we will multiply the LTM PP&E balance of $83mm by 20.0%, which comes out to $17mm in this case.
Given the useful life assumption of 10 years, the annual incremental depreciation from the PP&E write-up is $2mm.
Deferred Tax Liability (DTL)
We have now calculated the write-up amounts and the associated depreciation/amortization expenses, but the tax implications must not be forgotten. Specific to this LBO of JoeCo, deferred tax liabilities (DTLs) are created from the PP&E and intangible assets being written up.
Deferred taxes arise when there is a temporary timing difference between GAAP book taxes and the actual cash taxes paid to the IRS, which has a direct impact on the amortization expense (and GAAP taxes).
If cash taxes in the future exceed book taxes in the future, a deferred tax liability (DTL) would be created on the balance sheet to offset this temporary tax discrepancy.
While the additional depreciation stemming from the PP&E write-up and the amortization of intangibles are deductible for book purposes, they are not deductible for tax purposes.
Eventually, GAAP taxes will increase accordingly once these temporary timing differences are eliminated.
GAAP Accounting Profits: Financial Buyers vs. Strategic Acquirers
The revalued tangible assets serve as a new basis for the depreciation & amortization expense, which are amortized over their expected useful lives.
These additional D&A charges can have a significant impact on future earnings under GAAP accounting standards.
For this reason, public acquirers are generally motivated to keep asset write-ups as low as possible and record the highest amount of goodwill – resulting in lower future D&A expenses and thereby increasing their accounting profitability, more specifically, the net income and earnings per share ("EPS") figures.
However, JoeCo is a private company being acquired by a financial buyer. Thus, a higher D&A expense resulting in lower taxable income does not carry the same degree of significance to financial buyers, as opposed to publicly traded strategic acquirers that are very cognizant of their shareholder base, share price, and the dilutive impact to their post-acquisition EPS.
To calculate the deferred tax liability created from the intangible assets write-up, we will multiply the $49mm write-up by the tax rate of 35% to get $17mm.
To calculate the deferred tax liability created from the PP&E write-up, we will multiply the $17mm write-up by the 35% tax rate to get $6mm.
The total deferred tax liability associated with the two write-ups comes out to $23mm. The annual "unwind" of the DTL will be calculated by dividing the DTL created by the useful life assumption.
Be aware, that the annual unwind of the DTL is calculated separately and then summed up since the two write-ups have differing useful life assumptions.
In closing, the total amount of goodwill created was $445mm. This was calculated by taking the purchase premium of $488, subtracting the $49mm in intangible assets write-up and the $17mm in PP&E write-up, and adding the $23mm in deferred tax liabilities.
Step 3: Formulas Used
Allocable Purchase Premium = Purchase Equity Value – Book Value of Equity + Existing Goodwill
Pro Forma Goodwill = Allocable Purchase Premium – Intangible Assets Write-Up – PP&E Write-Up + Deferred Tax Liability
Annual Unwind of DTL = Deferred Tax Liability Created ÷ Useful Life Assumption
Step 4. Closing Balance Sheet (B/S)
By now, we have calculated the pro-forma goodwill as $445mm and have the amount in deferred tax liabilities created, we can now put together the closing B/S.
Assets Side
The first adjustment will be wiping out the entire cash balance on the credits side (-$50mm) since this deal was done on a CFDF basis. Then, on the debits side we will link to the Cash to B/S from the Sources & Uses schedule (+$5mm). If you sum up the 2020A balance with the debit and credit entries, the 2020PF cash balance is $5mm – i.e. the seller took all the excess cash and the minimum cash balance remains.
Next, PP&E was written up by $17mm and this will be reflected on the debits side (+$17mm). The 2020PF PP&E balance has changed from $83mm initially to $100mm.
Moving onto goodwill, the existing goodwill of $28mm will be wiped out on the credits side (-$28mm). Next, the $445 we calculated in the previous step will be linked on the debits side (+$445mm).
For the final adjustment on the assets side of the balance sheet, the intangible assets write-up of $49mm will be reflected on the debits side (+$49mm). The PF balance has increased from $36mm to $85mm.
Liabilities and Equity Side
Moving onto the liabilities side, the first adjustment is the elimination of the $100mm in existing debt on the debits side (-$100m). Again, this deal was done on a CFDF basis, thus it is the seller's responsibility to take care of this obligation using the sale proceeds.
Next, we will add the new debt funding raised to the closing balance sheet. On the credits side, we can link to the $175mm in TLB, $75mm in Senior Notes, and $50mm in Sub Notes (+175mm, +75mm, +50mm)
Then, we need to account for the capitalized financing fee of $8mm on the debits side (-$8mm).
To finish the adjustments on the liabilities side of the balance sheet, the Deferred Tax Liability of $23mm will be reflected on the credits side (+$23mm). This is a temporary timing difference that will gradually wind down to zero.
To finish the closing B/S, we will adjust the shareholders' equity balance. On the debits side, we will wipe out the existing amount by entering a negative sign and then linking to the book value of equity cell (-$115mm) and then we deduct the $10mm in transaction fees (-$10mm). These transaction fees, unlike financing fees, are treated as one-time expenses and come out of equity. The debits side should now be negative $125mm.
Then on the credits side of equity, we will link to the equity contributions from the Sources & Uses table (+$348mm). In total, the 2020PF shareholders' equity balance should be $338mm.
If done correctly, the PF closing B/S should balance. If not, it is likely an error related to the debits and credits signs. Make sure that on the debits side, all the asset adjustments are shown as positives and the liabilities and equity adjustments are shown as negatives (and vice versa for the L&E side).
With the purchase accounting and closing B/S complete, we can now forecast the three financial statements beginning with the income statement.
Operating Assumptions
To start, we will first lay out the operating assumptions at the bottom and calculate the drivers based on revenue. For 2020A, we can see the gross margin is 31.5%, SG&A is 21.0% of revenue, R&D is 3.5% of revenue, and D&A is 1.4% of revenue.
Next, we will project revenue since most of the line items will be projected off revenue. As the prompt stated, the revenue growth rate in 2021 is 8%. Using a step function, we will increase this 8% by 0.5% each year. If done correctly, you should have 10.0% as the growth rate in 2025.
For the gross margin, we will again use a step function to increase it by 0.20% each year. In 2025, the gross margin should be 32.5%.
Then for SG&A, R&D, and D&A, we simply straight-line all of them for the forecast period.
I/S Forecast
With the operational assumptions laid out, we are now ready to forecast the income statement.
Starting with the top line, we will calculate revenue by multiplying the previous revenue amount by (1 + the YoY growth rate assumption).
For the gross profit, we will multiply the gross margin assumption by the current period revenue. To calculate COGS, we will back out of the amount by subtracting gross profit by revenue.
SG&A, R&D, and D&A will all be forecasted by multiplying the % assumption by revenue, just remember to include a negative sign in front since these all represent outflows of cash.
Next, below the D&A line item, we will account for the additional amortization and depreciation from the write-ups. The annual incremental amortization related to the intangible assets write-up is $3mm, while the incremental depreciation from the PP&E write-up is $1mm each year.
The last expense before the EBIT line item is the $2mm in monitoring fee paid to the private equity firm.
The monitoring fee is an annual consulting fee paid by the portfolio company to the sponsor.
Many private equity firms, particularly those that hire consultants, have many operating partners listed on their webpage, or is a subsidiary under a consulting firm (e.g. Bain Capital / Bain & Company), will arrange these types of advisory fees in their investment agreement to have an additional source of proceeds prior to the exit.
Just as a side note, monitoring fees are a controversial topic as the expense is tax-deductible for the portfolio companies and reduces the taxes paid. In many cases, however, no actual monitoring services are provided and the payments are instead “hidden dividends” paid to the private equity sponsor.
For interest, we will leave this section blank for now and return to it once the debt schedule has been completed.
The amortization of financing fees has been calculated as $8mm and will be amortized over 7 years. Thus, we will divide the $8mm by 7 to get roughly ~$1mm in amortization each year.
To calculate the taxes due, we will multiply the tax rate of 35% by EBT and after subtracting this amount from EBT we have arrived at net income.
Next, we will forecast the cash flow statement. You may notice the free cash flow build we did in the Basic LBO modeling test is essentially just a mini-version of the cash flow statement.
Cash Flow from Operating Activities
To begin filling out the cash flow statement, we will first grab net income from the income statement.
Next, we will adjust for the non-cash add-backs, which are D&A, Amortization of Financing Fees, PIK Interest, Intangible Assets Write-Up Amortization, and PP&E Write-Up Depreciation.
Except for PIK interest, we have all of the add-backs amounts calculated. Just make sure all the add-backs are shown as positives.
Next, we will subtract the annual deferred tax liability expense of $2mm and deduct the increase in NWC to arrive at cash flow from operating activities. Since we have not yet put the balance sheet together, the change in NWC will be left blank.
Cash Flow from Investing Activities
For the cash flow from investing activities section, the only line item is Capex, which will be 2% of revenue each year. Capex is the only line item directly forecasted on this CFS.
All that remains now is the Cash Flow from Financing section, which we will return to once the debt schedule has been completed.
Step 6 Formulas Used
Cash Flow from Operating Activities = Net Income + D&A + Amortization of Financing Fees + PIK Interest + Intangible Assets Write-Up Amortization + PP&E Write-Up Depreciation – Deferred Tax Liability Unwind – Δ in NWC
Deferred Tax Liability Unwind = Annual Unwind of DTL from Intangible Assets Write-Up + Annual Unwind of DTL from PP&E Write-Up
Capex = Capex % of Revenue × Revenue
Free Cash Flow (Pre-Revolver) = Cash Flow from Operating Activities – Cash Flow from Investing Activities – Mandatory Amortization
Net Change in Cash Flow = Cash Flow After Financing Activities
Ending Cash Balance = Beginning Cash Balance – Net Change in Cash
Step 7. Debt Schedule
When creating the debt schedule, we will go through each debt tranche in accordance with the waterfall logic (i.e. descending from highest seniority to lowest in the capital structure).
For all the debt tranches, we will utilize a roll-forward calculation.
Revolving Credit Facility (Revolver)
As mentioned earlier in the LBO modeling test prompt, the revolver was left undrawn during the initial purchase date.
The "Total Revolver Capacity" was listed as 75% of the total LTM inventory and accounts receivable. If we sum up those two assets, we get $105mm, and multiplying it by 75% comes out to $79mm. To have a round number, we will add a "ROUND" function to the formula to get $80mm.
The maximum revolver capacity is generally based upon a borrowing-base lending formula (most often a certain percentage of A/R and inventory).
To get straight to the point, this revolving credit facility will be drawn from if the free cash flow (pre-revolver) dips below zero and a maximum of $80mm can be borrowed.
The pricing of the revolver was stated as LIBOR + 400, thus it is calculated as LIBOR + 4%. The LIBOR rates are listed at the top and are stated in terms of basis points (bps), as opposed to a percentage like the previous model test. Therefore, divide LIBOR by 10,000 in the formula.
Lastly, the unused revolver commitment fee is 0.25%, which is calculated by taking the average of the beginning and ending available revolver capacity and multiplying it by the fee %. If the revolver is left undrawn for the entire projection period, the unused commitment fee is $0.2mm each year.
Term Loan B (TLB)
The next debt tranche is Term Loan B, in which $175mm was raised and this will be the beginning balance in 2021 of the roll-forward schedule.
The mandatory amortization was stated as 5%, so $9mm will be required to be paid out each year. To ensure there is no amortization once the principal has been paid down in full, we will include a "MIN" function with the mandatory amortization and the beginning TLB balance.
A new line item in the TLB roll-forward is the "Less: Cash Sweep".
A cash sweep refers to the optional paydown of the principal when there is excess free cash flow remaining. The institutional lender of the TLB has given JoeCo the option to pay down more of the principal than the required 5%.
"Excess Free Cash Flow" is defined as the total cash balance minus the minimum cash balance required for normal business operations.
From the perspective of the lender, the principal of $175mm will be received by the end of maturity, and receiving it earlier is thus beneficial as the risk of not receiving the principal back (i.e. JoeCo underwent a bankruptcy) is decreased and the returned capital could be invested elsewhere.
But on the downside, the interest expense received by the lender decreases over time as more principal is paid down. As you can see from the interest expense calculation, the interest fell from $10mm in 2021 to $6mm by 2025.
The formula for the TLB cash sweep shown below utilizes a "-MIN" function between the beginning TLB balance after accounting for the mandatory amortization and the post-revolver FCF. If done correctly, the cash flow after financing activities should be zero in all the years.
As we can see, all of the excess free cash flow is used to pay down as much debt as possible. The beginning balance of $175mm has decreased to $86mm by the end of 2025.
For the interest rate, the TLB is priced at LIBOR + 400 with a 2% floor. As you can see, for all the years when LIBOR is below 200 bps, the interest rate is 6%. But once LIBOR increases above 200 bps, the interest rate becomes 6.3% in 2024 and then 6.5% in 2025.
Minimum Cash Balance (Cash to B/S)
Note how the ending cash balance never dips below $5mm in the cash roll-forward, which was the "Cash to B/S" assumption, i.e. the minimum amount of cash needed on-hand to fund near-term working capital needs.
Since we are assuming a full cash sweep, 100% of all excess cash flows are spent on the optional repayment of debt.
In practice, debt schedules are modeled with the minimum cash balance and excess cash from prior periods (i.e. carried over) accounted for.
However, for timed LBO modeling tests – in which there is clearly no remaining cash after the cash sweep – this simplified modeling convention is acceptable (and often seen).
Senior Notes
The Senior Notes forecast is very straightforward. The beginning balance is $75mm and will remain unchanged throughout the entire holding period.
Given the fixed 7.0% interest rate, the interest expense will be $5mm each year.
Subordinated Notes
The final debt tranche is the subordinated notes, in which $50mm was raised.
As a reminder, the interest rate is 12.5% with 8.5% being paid-in-cash and a 4% PIK rate.
The cash interest is treated just like the interest on the senior notes. You simply take the average of the beginning and ending balance of the sub notes and multiply it by 8.5%.
As mentioned earlier, PIK interest is a non-cash payment that accrues over time.
While the cash interest portion is calculated based on the beginning and ending balance, the PIK will accrue based upon the beginning debt balance.
You can think of the PIK rate as the beginning Sub Note balance growing by 4% each year (i.e. multiply the beginning balance by 1.04 each year to see the next year's beginning balance).
Notice how the initial balance is $50mm, but each year the ending balance increases. By 2025, the ending balance has grown to $61mm. Also, look at the side impact on the cash interest expense –because the beginning and ending balances have been growing, the cash interest expense increases too.
So, not only will the principal payment due at maturity be of a larger magnitude, the cash interest expense paid each year will be higher.
Interest Expense Calculation
To minimize the chance of making a linking error, it is useful to list out all the interest expenses when there were numerous debt tranches used.
While PIK is non-cash, it is included as part of the total interest expense calculation under accrual accounting. But then on the cash flow statement, the PIK interest will be added back to reflect it is not an actual cash outflow.
Recall that we skipped over the interest expense line item on the income statement, therefore we will link the ending interest expense balances to the relevant cells on the I/S.
Step 7: Formulas Used
Total Revolver Capacity: "= ROUND ((Inventory + Accounts Receivable)*75%,-1)"
Beginning Available Revolver Capacity = Total Revolver Capacity – Beginning Balance
Ending Available Revolver Capacity = Beginning Available Capacity – (Revolver Drawdown / Paydown)
With the income statement and cash flow statement complete, we can fill out the balance sheet.
If you need a refresher on how to forecast the B/S items, read our Quick Reference Guide
Out of the three statements, the balance sheet should take the least amount of time to complete. Additionally, the B/S check will let you know if a mistake was made.
First, we will link to the PF B/S calculated earlier and bring it down to the 2020PF column. The reason we do this is to calculate the working capital % drivers and straight-line all of them, and because the non-working capital items all use the prior year balance in the formula (e.g. PP&E).
Assets Side
To start, cash will be pulled from the ending cash balance on the cash flow statement.
For the working capital assets, accounts receivable will be a function of Days Sales Outstanding (DSO), inventory will be based on Days Inventory Held (DIH), and prepaid expenses will be forecasted as a percentage of revenue.
Now moving onto the long-term assets, PP&E will be calculated as the prior balance plus Capex minus D&A and PP&E Write-Up Depreciation. Keep in mind, Capex will have been entered as a "-", therefore subtract it in the Excel calculation to have the intended effect (i.e. Capex increases the PP&E balance)
For Goodwill, the $445mm balance will remain unchanged since there was no mention of impairments or Goodwill Amortization, which is an option available for private companies.
The final long-term asset, Intangible Assets, will be calculated as the prior balance minus the intangible assets write-up amortization. Notice the intangible assets balance decreases by ~$3mm each year.
Liabilities and Equity Side
Starting on the liabilities side, the revolver line item will be linked to the ending balance from the debt schedule.
The working capital liabilities such as accounts payable will be forecasted based on Days Payables Outstanding (DPO) and then accrued liabilities and deferred revenue will both be projected as a percentage of revenue.
For the long-term liabilities, the Term Loan B, Senior Notes, and Subordinated Notes will all be pulled from the ending balance from the debt schedule.
The capitalized financing fees will be shown as a negative $8mm in the PF year, and the Amortization of Financing Fees will be added to the balance each year.
The final liability, the deferred tax liability, will decrease by the change in DTLs calculated earlier.
Shareholders' equity will be calculated as the prior balance plus net income since there were no dividends paid out.
At this stage, the balance check will show the balance sheet is not in balance. The reason being, we skipped over the change in NWC on the CFS. Thus, we must calculate the NWC (Current Assets –Current Liabilities) and then link the YoY change (previous period NWC – current period NWC) on the cash flow statement.
Upon completion of this linkage, the balance sheet should now be in balance, or else a mistake was made somewhere.
Net Working Capital = Current Assets – Current Liabilities
Δ in NWC = Prior NWC – Current NWC
Net Debt = Total Debt – Cash
Step 9. Returns Calculation
We are now in the final steps of the modeling test, all that remains is calculating the returns metrics, creating the sensitivity tables, and answering the questions listed in the prompt.
Exit Valuation
To calculate the exit enterprise value, we multiply the exit multiple assumption by the exit LTM EBITDA.
The conservative assumption is to assume the exit multiple is the same as the entry, thus we will use 12.5x as the exit multiple assumption.
Now, we will deduct the net debt to calculate the exit equity value.
This represents the total value of JoeCo to equity owners, but remember that management rolled over 20%. One minus the 20% rollover equity will give us the sponsor's implied ownership, 80%.
Thereby, the "Exit Proceeds to Sponsor" will be calculated by multiplying the exit equity value by the 80% implied ownership.
But there is an additional source of proceeds for the PE firm, the annual monitoring fees.
For that reason, we will link to the $2mm fee from the income statement each year (inflow).
The Cash (Outflows) / Inflows table should reflect both the exit proceeds and the monitoring fees. For example, for a five-year holding period – confirm that the PE firm received five $2mm payments in total.
With the Cash (Outflows) / Inflows table completed, we have the necessary cash flows to calculate the IRR and MOIC using Excel.
Step 9: Formulas Used
Exit Enterprise Value = Exit Multiple × LTM EBITDA
Exit Equity Value = Exit Enterprise Value – Net Debt
Exit Proceeds to Sponsor = Exit Equity Value × Sponsor Implied Ownership %
Total Proceeds to Sponsor = Exit Proceeds to Sponsor + Monitoring Fees
IRR: "= XIRR (Range of Cash Flows, Range of Timing)"
MOIC: "=SUM (Range of Inflows) / – Initial Outflow"
Step 10. Sensitivity Analysis
To create the sensitivity tables, first set the output variable in the top left corner – which will be either the IRR and MOIC for our purposes.
Highlight the table you have just set up and press "Alt + D + T".
The row input cell will be the exit multiple assumption in 2025 (Year 5)
The column input will be the entry multiple assumption
To confirm you did the sensitivity table correctly, check to make sure that the highest value is on the top right, with the lowest being in the bottom left corner. The rationale being, a lower entry multiple and higher exit multiple yields the highest returns (and vice versa).
When answering the model test questions, the exact answers may not always be provided by the sensitivity tables (i.e. only approximations). But based on your best estimates, you can adjust the hardcoded input (blue font color) to find an exact figure you can reference in your answer.
For instance, we can estimate the lowest exit multiple to achieve an IRR of 15% seems to be between 9.5x and 10.5x from our sensitivity table. After a handful of iterations we can figure out that when the exit multiple input is 10.22x, the IRR is exactly 15.0%.
Standard LBO Modeling Test Conclusion
To conclude this article, we will answer the three questions listed in the prompt.
Assuming the private equity firm exits at the same multiple as entry after a five-year horizon, the IRR is 21.0% while the MOIC is 2.6x
To achieve a 3.0x MOIC in five years, the private equity firm must sell at a 14.0x exit multiple.
If the minimum IRR threshold is 15.0%, the lowest exit multiple that the private equity firm could exit at is approximately 10.3x.
Frequently Asked Questions
How hard is the private equity interview process?
Extremely competitive — and compressed. Most PE recruiting happens on a fast-moving cycle where firms are simultaneously evaluating candidates from the same narrow pool of investment banking analysts. The process typically involves multiple rounds: technical interview questions, a paper LBO, a standard modeling test, a case study, and behavioral interviews. At larger funds, all of this can happen within days. The modeling test is a near certainty at later rounds, but it's only one component — candidates who ace the model but struggle with the deal discussion or behavioral portion still don't get offers.
What is a paper LBO and how is it different from a modeling test?
A paper LBO is a back-of-the-envelope calculation done with pen and paper — no Excel — in roughly 5 to 10 minutes. The goal is to quickly estimate an implied IRR and key deal metrics from a minimal set of assumptions. It tests whether you understand LBO mechanics conceptually before being trusted with a full model. A standard LBO modeling test goes much deeper: you're building a fully integrated three-statement model with a debt schedule, purchase price allocation, and sensitivity analysis, typically over 90 minutes to two hours. The paper LBO comes first in the process; the modeling test comes later.
What is the difference between enterprise value and equity value in an LBO?
Enterprise value is the total value of the business — what it costs to acquire the whole company, including assuming its debt. Equity value is what's left for shareholders after subtracting net debt from enterprise value. In an LBO, the PE firm pays the enterprise value at entry and receives equity value at exit, which is why paying down debt during the holding period directly increases returns — every dollar of debt repaid flows through to the equity holders. Getting comfortable with this distinction is essential for understanding why the sources and uses table, debt schedule, and exit returns calculation all connect the way they do.
What does MOIC mean and what's a good MOIC for a PE deal?
MOIC — multiple on invested capital — measures total return as a ratio of proceeds to the initial equity investment. A 2.0x MOIC means you doubled your money; a 3.0x means you tripled it. Most PE funds target a minimum of 2.0–2.5x MOIC over a five-year hold as a baseline for meeting their return hurdles. Top-quartile funds target 3.0x or higher. MOIC doesn't account for timing, which is why it's always considered alongside IRR. A 3.0x MOIC in three years is a significantly better outcome than the same multiple in seven — even though MOIC looks identical on paper.
What is PIK interest and why does it matter in an LBO?
PIK — or paid-in-kind — interest is interest that doesn't get paid in cash. Instead, it accrues to the outstanding debt balance, which compounds over time. From a cash flow perspective, PIK is favorable in the near term because it conserves cash for operations and debt repayment elsewhere in the capital structure. But the trade-off is that the principal owed at maturity is larger than what was originally borrowed, and the cash interest payments on that growing balance increase each year. PIK is most common in the riskiest, subordinated tranches of an LBO's debt stack where lenders accept more risk in exchange for higher overall returns.
What is a deferred tax liability and when does it come up in an LBO?
A deferred tax liability arises when there's a timing difference between how income is recognized for GAAP accounting purposes versus how it's treated for tax purposes. In an LBO, DTLs are most commonly created during purchase price allocation when assets like PP&E and intangibles are written up to fair value. The write-up increases GAAP depreciation and amortization — which reduces book income — but those incremental charges aren't tax deductible, so cash taxes remain higher than book taxes. The DTL represents that future tax obligation and gradually unwinds over the useful life of the written-up asset. It's a common point of confusion in LBO modeling because it creates a liability at closing without any immediate cash impact.
What is a cash sweep in an LBO model?
A cash sweep is an optional debt repayment mechanism that applies excess free cash flow toward paying down debt principal beyond the required minimum. In practice, term loans in LBO structures often include a cash sweep provision that requires the borrower to use a percentage of excess cash — sometimes 100% — to accelerate repayment. From the lender's perspective, faster principal paydown reduces default risk. From the PE firm's perspective, paying down debt faster increases equity value at exit by reducing the net debt subtracted from enterprise value. Modeling the cash sweep correctly requires careful logic to ensure cash doesn't dip below the minimum operating balance and that the sweep is capped at the remaining debt balance.
Why do private equity firms use so much debt in buyouts?
Debt amplifies equity returns — that's the core logic. If a PE firm buys a company for $500mm using $350mm in debt and $150mm in equity, and sells it for $600mm five years later, the equity holders capture nearly all of the $100mm gain despite only putting in $150mm upfront. Without leverage, that same gain would be spread across the full $500mm investment, producing much lower returns. Debt also creates tax benefits since interest payments are tax deductible, reducing the effective cost of financing. The risk, of course, is that leverage works in both directions — underperformance or a downturn can leave the company unable to service its debt obligations.
What makes a company a good LBO candidate?
The ideal LBO target generates stable, predictable cash flows — enough to service the heavy debt load that funds the acquisition. Strong free cash flow conversion, low capital expenditure requirements, and defensible margins are the core characteristics. Beyond cash flow, PE firms look for companies with a clear path to value creation: an underutilized brand, operational inefficiencies that can be fixed, or a fragmented industry where bolt-on acquisitions can accelerate growth. Companies with significant existing debt or highly cyclical revenues are generally poor LBO candidates because the leverage amplifies downside risk.
How do you know if you passed an LBO modeling test?
The grading is less subjective than most candidates expect. Reviewers aren't evaluating your assumptions or debating your thesis — they're checking whether the model was built correctly and the instructions were followed precisely. A balanced balance sheet, correct IRR and MOIC outputs, and properly constructed sensitivity tables are the primary signals that the model works. Attention to detail matters more than sophistication: a simple model that balances and answers the questions correctly will outperform a complex model with linking errors. The fastest way to fail is to run out of time without completing the returns calculation — that's the output the reviewer looks for first.
Quick question on the roll over shouldn’t the formula be 20%x(Purchase Enterprise Value) as the management is re-investing 20% of the proceeds from the initial sales (assuming they owned 100% of the target)?
Jeff Schmidt
January 8, 2021 2:26 pm
Armin:
No, it would be 20% of buyout equity.
Best,
Jeff
Vinny
February 20, 2021 4:07 am
comment deleted
John Bennett
April 26, 2021 11:33 pm
Hi Jeff – to piggy back off of Armin’s question on the Rollover Equity amount calc…
In your example, the Rollover Equity amount is calculated as such:
(Total Equity $348) * 20% = $70 Rollover Equity
…where Total Equity = (Total Uses $648) – (Total Debt $300)
Wouldn’t the amount of Rollover Equity to calc be:
20% * (Purchase Equity Value $575) = $115 Rollover Equity
Why is the Equity Value based on the Total Uses and not the actual Purchase Equity Value? Any color would be appreciated.
Best – John
Jeff Schmidt
April 27, 2021 11:38 am
John:
No, that’s a fair point. It probably should be based off of the original equity and not the NewCo equity.
Best,
Jeff
Jeff Schmidt
April 27, 2021 11:43 am
John:
Adding to this, I suspect the intent was that management was not going to rollover the full amount… just 20% of the NewCo. But I agree this isn’t 100% clear.
Best,
Jeff
Justin Kim
April 28, 2021 1:24 pm
In this scenario, the 20% doesn’t mean that the management team is rolling over 20% of their pre-LBO equity, but rather their rollover will represent 20% of the post-LBO equity.
If the sponsor’s investment is 80% of the required equity contribution, then the management rollover comprises the rest – so, that’s the pro forma equity ownership and why the prompt states “the remaining 20% being rolled over by the existing management”.
Because we’re told the sponsor holds an 80% implied ownership stake, rollover equity can be calculated using this simplified approach, which is actually quite common in modeling tests.
The required equity contribution can be calculated from total uses less the total debt financing, $348mm ($648mm – $300mm). So, the rollover equity is 20% of the required equity, $70mm (20% x $348mm), while the sponsor equity is 80% of the required equity, $278mm (80% x $348mm).
If the rollover equity was $115mm, then the sponsor equity amounts to $233mm ($348mm – $115mm), only 67% of the post-LBO total equity.
Additionally, the amount of sale proceeds belonging to the management team was never given, so the implicit assumption you’re making is that management owned 100% of the target’s equity at exit. If data points like the value of management’s stake and percentages were listed, then we could compute the value owned by management and apply a percentage to determine the rollover amount – but in this case, we’re not given much information.
N T
August 8, 2021 1:30 pm
also wanted to ask if the PIK interest formula is correct in the excel – it should sum the beg. balance plus mandatory amortization (as the latter is expressed as a negative figure)? rather than deduct the mandatory amortization
Jeff Schmidt
August 8, 2021 2:47 pm
Nicholas:
Good catch… you are correct that this should be an addition and not a deduction.
Best,
Jeff
Justin Kim
September 20, 2021 10:36 pm
Hi Nicholas,
The formula for the subordinated notes ending balance takes the sum of the beginning balance, mandatory amortization, and PIK interest.
The “Less” in front of mandatory amortization just refers to the sign convention, not the formula.
Amit Gupta
September 22, 2021 12:16 am
Why is PIK interest taking the net of the beginning balance and the ammortization? Isn’t PIK normally just based on beginning balance?
Jeff Schmidt
September 22, 2021 3:27 pm
Amit:
If a PIK security’s principle is being paid down then the PIK accrual will be lower.
Best,
Jeff
Josh Ashton
May 2, 2021 7:25 pm
Why is the $50M of net debt ($100M of debt and $50M of cash) on the existing balance sheet not included in the uses section? Shouldn’t it be:
Since this is a cash-free/debt-free transaction, the seller would use the Purchase Enterprise Value proceeds to pay down the existing debt and keep the remaining cash. Therefore, the net debt/net cash is implicitly “taken care of” in the Purchase Enterprise Value of $625.
Best,
Jeff
Grace
January 11, 2024 3:36 pm
Hi Jeff,
Since the subject transaction is a CFDF-based one, meaning the existing pre-LBO net debt will not be carried over/refinanced, then why in the use of fund side total Enterprise Value is used to directly add the transaction and financing fees? Should’t it be “EV – existing net debt + fees” to the actual balance for the total use of fund?
Moreover, the “EV” calculated using EV/EBITDA multiple should not be equal to the the purchased equity value right? Because in the Allocable Purchase Premium section the purchased equity value was obtained by deducting pre-LBO net debt from the EV.
Since the purchased EV is both net debt and equity, the total source of fund will be partially used to finance the existing net debt right? But it will be contrary to the premise narrated in the prompt – a CFDF basis.
Brad Barlow
January 12, 2024 12:54 pm
Hi, Grace,
When we purchase a company on a CFDF basis, we are purchasing the value of the enterprise, which for the seller will equal the value of operations, which can then be used to pay off their own debt, and what remains plus any excess cash is equity value to them. EV is what we should show in uses of funds, because that is what is being purchased from the seller. The purchased equity value would be the EV – debt + cash.
BB
Mike
June 5, 2021 4:38 pm
Regarding the goodwill calc: Why are we deducting the existing (i.e. pre-acquisition) net debt, given this is a cash- and debt free transaction?
Thanks,
Mike
Jeff Schmidt
June 5, 2021 5:14 pm
Mike:
In order to calculate goodwill, we need to determine the seller’s proceeds (basically the equity value). Thus we take the purchase enterprise value, deduct debt and add cash.
Best,
Jeff
Mike
June 5, 2021 4:51 pm
It says first that the D&A from the write-ups are not tax deductible:
“While the additional depreciation stemming from the PP&E write-up and the amortization of intangibles are deductible for book purposes, they are not deductible for tax purposes.”
Then it says “However, JoeCo is a private company being acquired by a financial buyer. Thus, a higher D&A expense results in a lower taxable income, which leads to more free cash flow available to paydown debt.”
Which one is it? Thanks!
Jeff Schmidt
June 5, 2021 5:17 pm
Mike:
It is the former… I’m not sure why we say cash flows will be higher.
Best,
Jeff
Justin Kim
June 5, 2021 9:35 pm
Mike,
The latter point was bringing attention to how financial buyers do not have the same incentive as publicly-traded strategic acquirers, which the sections above were discussing.
A public acquirer would try to limit asset write-ups (and the incremental D&A) in order to reduce the post-acquisition EPS dilutive impact and show higher accounting profits.
But for private companies undergoing an LBO, their profits under a GAAP basis become less of a concern.
Amit Gupta
September 20, 2021 8:47 pm
Shouldn’t capitalized financing fee be an asset and we debit it to assets vs liabilities?
Justin Kim
September 20, 2021 10:17 pm
Capitalized financing fees are recognized as a contra-debt account, rather than an asset.
I think the toggle description is backward based on the formulas used. 1 enables circular references whereas 0 does not.
Justin Kim
September 20, 2021 10:10 pm
Hi Amit,
“1” should enable circular references while “0” cuts off the circularity.
So if the circuit breaker is off (i.e. set to “1”), the average debt balance is output, which is then multiplied by the applicable interest rate.
Amit Gupta
September 21, 2021 1:22 am
Why in the current liabilities cell for the current liabilities used in the net working capital calculation do you exclude the revolver (whereas it was included in total current liabilities)?
Jeff Schmidt
September 21, 2021 8:13 am
Amit:
Debt is not considered a part of working capital (it’s a finanical liability unrelated to operations/workings).
Best,
Jeff
Amit Gupta
September 21, 2021 11:26 am
So instead of doing Current Assets – Current Liabilities we are doing (Current Assets – Cash) – (Current Liabilities – Revolver)?
Jeff Schmidt
September 21, 2021 1:38 pm
Amit:
Yes, cash and debt are not considered working capital.
Best,
Jeff
Amit Gupta
September 22, 2021 12:35 am
Thoughts on deferred tax liabilities falling under Net Debt when you calculate Equity Value off of Enterprise Value?
Jeff Schmidt
September 22, 2021 3:30 pm
Amit:
No DTLs are not considered debt.
Best,
Jeff
Paul
October 7, 2021 5:29 pm
In the income statement you deduct the gross amortization of intangible write-up and gross depreciation of PP&E write-up – that reduces the tax payable. However, you mention that the write-ups should not be tax deductible. Shouldn’t you then add back the DTL unwind in the income statement, above EBIT? In the model above, DTL unwind is not accounted for in the I/S; only in CFS.
Jeff Schmidt
October 8, 2021 11:30 am
Paul:
Any deferred tax impact is implicitly included in our tax rate assumption.
Best,
Jeff
Juan Ospina
December 21, 2021 8:49 pm
Hi, question: Why do we add the DTL on the PF goodwill calculation?
Jeff Schmidt
December 22, 2021 3:16 pm
Juan:
In fairness I prefer the approach we teach in class: purchase price less the FMV of net assets. The math in this example gets you to the same answer but it’s less intuitive. You have your allocable purchase premium, some of which goes to intangibles and PP&E offset by DTLs.
Best,
Jeff
Lennard
January 10, 2022 9:29 am
How do we get to the Book Value, Existing Goodwill and the LTM PP&E balance of $83mm in Step 3?
Jeff Schmidt
January 10, 2022 11:04 am
Lennard:
These numbers are given to you as part of the balance sheet.
Best,
Jeff
Ismael Peruzzo Zamoner
February 28, 2022 3:36 pm
Could you elaborate on why there is double-counting in this part: “The reason we wipe out the existing equity book value is that it no longer exists (i.e. will be replaced by the new equity investment) and then we add existing goodwill because we would be double-counting it if we did not.”
The second explanation is a clearer presentation, in my view. But the point in the first explanation is that when you are trying to calculate the new goodwill, you add back the existing goodwill and subtract the write-up of other assets to figure out the difference between the purchase price of net assets and the existing book value. As for wiping out the old equity value, that simply means that the company’s old equity is eliminated because it has been purchased.
Brad
Ismael Peruzzo Zamoner
March 3, 2022 6:57 pm
Thank you!
Xinxin
February 19, 2023 5:35 pm
Just to follow up on this question regarding PPA. Here you have allocable purchase premium calculated as (purchase price – existing net debt) – (assets – goodwill – liabilities).
The purchase price in the PPA post refers to the “Equity Purchase Price” (Row 5). There is no mention of the net debt concept, since the starting point of our exercise is the equity purchase price, i.e. implied to be post-adjustment for net debt.
The CFDF post states, “In CFDF deals, the purchase price delivered to the seller is simply the enterprise value.”
In our illustrative example, the equity value and exit proceeds to the seller is $820 million under the CFDF and non-CFDF transaction structure. However, it would be incorrect to interpret that as “purchase price = purchase equity value = enterprise value”. In the transaction assumptions section of the model, the enterprise value is $1 billion (Row 8), whereas the equity value is $820 million (Row 11) – thanks!
Ismael Peruzzo Zamoner
March 3, 2022 6:58 pm
Why are you not considering a tax shield in the transaction fees, when adjusting the closing B/S? Instead of $10, shouldn’t we reduce 10*(1-Tax) from “retained earnings”?
Brad Barlow
March 4, 2022 4:08 pm
Hi, Ismael,
Assuming all transaction fees are both expenses and paid at the time of the deal, and assuming they are tax-deductible expenses, then yes, they would need to be modified by (1 – tax rate) in the final effect on retained earnings. But you would need to consult with a tax advisor to make sure of the specifics.
Brad
Winnie Shi
August 28, 2022 4:58 pm
Any advice on fixing #NUM! errors of what might be going wrong?
Brad Barlow
August 29, 2022 7:52 am
Hi, Winnie,
The #NUM error in excel occurs by an invalid argument in an Excel function or a formula that produces a number too large or too small to be represented in the worksheet. It is not the most common error. It may be from a function you are using incorrectly.
BB
Xinxin
February 19, 2023 8:47 am
It’s usually the result of incorrect linking of 3 statement model or missing a line that’s putting the statements out of balance. Double check interest expenses are properly linked to cash flow, income statement…etc.
Brad Barlow
February 20, 2023 1:53 pm
Thanks for sharing your experience, Xinxin!
BB
Minh Sam Ho
September 5, 2022 12:18 pm
What’s the closing balance sheet adjustment for the current portion of LT debt? Assuming cash-free debt-free transaction.
Brad Barlow
March 5, 2023 8:56 pm
Hi, Minh,
In a model, it is easiest just to include CP of LT debt as part of LT debt (whether term loans or senior note), and it is paid off each year as it comes due, or at the end as part of the exit analysis.
BB
Liam
October 31, 2022 5:19 pm
Why doesn’t cash sweep break the model by introducing a circular reference.
The way I see it the cash sweep is a function of excess free cash flow, but excess free cash flow is also a function of the cash sweep because cash sweep impacts interest expense which impacts cash flow.
Whenever i try to build out this lbo this issue ends up breaking my model, but for some reason it works fine in the example. Not sure where I am going wrong.
Brad Barlow
November 1, 2022 6:04 am
Hi, Liam,
See my answer to your other question. For the model to handle a circular reference, you must enable iterative calculations (Alt F T F, Alt I).
BB
Liam
October 31, 2022 10:51 pm
Is cash sweep not a circular reference? Doesnt interest expense -> net income -> excess fcf -> cash sweep while at the same time cash sweep -> interest expense -> net income.
In other words, how can cash sweep both impact interest expense and be a function of interest expense. My model keeps messing up for this reason and not sure why it works in the correct example?
Brad Barlow
November 1, 2022 6:02 am
Hi, Liam,
Cash sweeps do cause circular references, exactly as you describe. This only happens because we use the average cash balance to calculate interest expense (for the sake of a truer result than we would get if we only used the beginning of period balance, since the balance can change daily). And to handle this, you must go to Excel options, under formulas (Alf F T F), and enable iterative calculation (Alt I).
BB
Gemma
November 11, 2022 7:00 am
For the returns analysis, shouldn’t we use the cumulative monitoring fees? ie. If exit in year 2, the sponsor receives 2m in year 1, and 2m in year 2, so 4m of fees? Thanks
Brad Barlow
November 11, 2022 3:00 pm
Hi, Gemma,
Yes, the returns should include the monitoring fees for each year, so that an exit in year 2 would be $4mm. But the timing matters for IRR, so the $2mm in year 1 is worth more than the $2mm in year 2!
BB
Anon
January 13, 2023 5:52 pm
I have this model built and the logic seems to be flowing through correctly (it fully ties to the WSP version in this tutorial), although when I make the gross margin step down to “-0.2%” through the forecast period in order to test drawing on the revolver, my forecasted balance sheet is essentially off by the amount drawn in the revolver. Is there a standard relationship that causes this?
Brad Barlow
January 13, 2023 7:53 pm
Hi, Wilson,
Make sure that you have the ending balance of the revolver linked to the balance sheet, and make sure you have the draw or paydown of the revolver linked to the CFS.
BB
Fran
January 17, 2023 6:03 pm
Can you elaborate on why deferred tax liabilities do not seem to impact the income statement but are added back to net income to arrive at CFO? Why are they being added back although they are not subtracted from revenue in the first place?
Thanks!
Brad Barlow
January 18, 2023 6:12 pm
Hi, Fran,
Deferred tax liabilities are taxes that have already been expensed in the past (so they hit past income statements) but were not yet paid in cash. In this model, they are being paid off, and thus the amount they are paid off each year is subtracted from net income to get to CFO.
BB
Xinxin
February 19, 2023 8:50 am
I recreated the entire model and was double checking the formula with the completed worksheet throughout. I think all the formulas are correct. The balance sheet is in balance. The only issue is that my ending Total Equity Value to sponsor is off by some $4M. Could this be normal with 3 statement models that use circular formulas?
Brad Barlow
February 20, 2023 1:56 pm
Hi, Xinxin,
Circularities can account for very small variances, but if you are $4mm off, it is probably because of a difference between your model and the completed version of the one in the article. But it might be an immaterial difference, like rounding off an assumption; your formulas may indeed all be correct. The only way to know for sure is to work backwards from that number through the numbers that differ from the completed model to find the source.
BB
Tom
March 2, 2023 5:58 pm
Hi! Thank you for this – very helpful.
One quick question. Why is it that you are not showing the annual ($2 million) monitoring fees on either the balance sheet or the cash flow statement? It states in the assumptions that $2m will be paid each year but only seeing that reflected on the IS. Wouldn’t this reflect a cash outflow which should be accounted for on the CFS?
Appreciate your help!
Brad Barlow
March 5, 2023 8:54 pm
Hi, Tom,
Remember that the CFS begins with net income, so since the monitoring fees are included in the IS, they automatically reduce cash via the CFS. Assuming they are paid in cash, there is nothing else that needs to be tracked on the B/S.
BB
Samiksha
March 19, 2023 3:04 pm
shouldn’t the defered tax liabilites be added back and not subtracted ??? because:
1)we have created the dtl at t=0 which will be unwinded or reversed over the years.
2)the tax that has been calculated on EBT included the depreciation on writeups (which means less tax has been recorded in books) but the cash tax outflow would be more because of such write ups not considered for cash taxes.
Brad Barlow
March 19, 2023 6:48 pm
Hi, Samishka,
The change in DTL needs to be subtracted, not added, because you are paying off that liability, and because cash taxes are higher than reported taxes; reported taxes are being lowered by the depreciation from write-ups, but this does not create a tax shield because the tax basis is not stepped up in a stock sale; therefore, you must record a DTL at t=0 that must be paid off, and thus subtracted (which is what we do with liabilities that decrease) on the CFS.
BB
Samiksha
March 20, 2023 2:08 am
Thanks for the reply! Understood ,Thanks. These learning guides are helpful.
Brad Barlow
March 21, 2023 9:37 pm
You’re welcome, Samiksha!
Marco
March 26, 2023 3:32 pm
More of a logistical question. When working on a model like this within the allotted time, are candidates expected to start from a blank sheet from scratch or is it okay to use a template similar to this? Is it possible to set the whole model up and still be able to finish it till the last step without using any text/formatting macros? Just trying to gauge if I should be practicing using this template or a blank excel sheet. Thanks for your help!
Brad Barlow
March 27, 2023 2:57 pm
Hi, Marco,
In case they specify a blank sheet, you want to be able to do a simple LBO on a blank sheet given just the inputs and assumptions they provide, and it is no problem to do this without the help of macros.
Hi, In the Exit Valuation part, the annual monitoring fee of $2 has been added to arrive at Total Proceeds to Sponsor, for example, 326+2=328, 399+2=401. Don’t we need only this number “Total Proceeds to Sponsor” (328, 401,…) to compute the IRR? Why do the annual $2 monitoring fees appear again on the Cash Outflow/Inflows table while they have already been added to compute the Total Proceeds?
Justin Kim
April 11, 2023 11:23 am
Hi Thuong – the $2 million annual monitoring fee is received by the financial sponsor each year, so we must factor in the fees collected in the prior years before the actual exit.
If we assume Year 2 is the exit year, the sponsor exit proceeds are $401 million ($399 million + $2 million). However, the $401 million neglects the $2 million collected in Year 1. Hence, the inclusion of the $2 million twice in the IRR and MOIC calculations.
Justin
Mickey
August 13, 2023 10:39 pm
Shouldn’t the total fee amount be $7? Not sure where the $8 comes from since 4+2+1 = 7.
Justin Kim
August 30, 2023 2:04 pm
Hi Mickey – the total financing fees is $7.50 million ($4.375mm + $1.875mm + $1.25mm), which the model rounds to $8 million because of the number formatting.
Selecting the cell range (K18:K22) and pressing Alt, H, 0 increases the number of decimal places displayed, thanks.
Tjark van
August 15, 2023 4:40 am
Hi, regarding the purchase price allocation, I understand why PP&E gets written up with 10%*book value of PP&E. However, why does the model use the allocable purchase premium to write-up intangible assets instead of the actual book value of intangible assets?
Brad Barlow
August 15, 2023 7:30 am
Hi, Tjark,
In the case of PP&E, it makes sense that there would be an appreciation of the assets which are recorded at original cost. But with intangible assets, they are recognizing the value of assets that never had historical cost recorded in the first place, so the estimate of % of allocable premium makes as much sense as % of book value. Either way, it is very much an estimate that should be based on prior deal experience if possible, and must be confirmed and changed later when appraisals are done.
BB
Tjark van
August 15, 2023 7:53 am
Hi Brad,
Thank you for the quick response! Understood!
Brad Barlow
August 16, 2023 8:12 am
You’re welcome!
Kate
September 20, 2023 8:47 am
Hi! Why in the calculation of cash flow from operations Deferred Tax Liabilities is subtracted? Shouldn’t it be added? (as any increase in a deferred tax asset or decrease in a deferred tax liability is subtracted and vice versa, any decrease in a deferred tax asset or increase in a deferred tax liability is added back)
Brad Barlow
September 25, 2023 2:45 pm
Hi, Kate,
Because of the DTL created in the transaction as part of the write-up of assets, that DTL will need to be paid off over the life of that asset, and thus, as you correctly note, the decrease in the DTL as it is paid off is a cash outflow.
BB
Mayank
February 25, 2024 1:36 pm
Hi Brad,
Given we are starting the cash flow statement from net income level, and don’t have a separate line item for DTL un-wind in the income statement, it means we have assumed that DTL un-wind is part of our tax expense. But then, it also means we have already deducted the DTL un-wind already to arrive at net income. Hence, when calculating cash flow from operations, we don’t need to deduct it again. Then why have we deducted it from cash flow statement? Isn’t that double counting?
Thanks,
Mayank
Brad Barlow
February 25, 2024 6:55 pm
Hi, Mayank,
Actually, the taxes on the income statement are reported taxes influenced by the higher D&A from the write-up, which means they are lower than the cash taxes paid. By subtracting the reduction in DTLs, we account for the additional cash taxes paid that are not accounted for in the income statement.
BB
Kate
September 20, 2023 9:59 am
Hello! another question, why are capitalized financing fees negative on the Balance Sheet? thanks a lot!
Brad Barlow
September 25, 2023 2:42 pm
Hi, Kate,
Capitalized financing fees are either recorded as an asset on the B/S (as in the case with the financing fee charged for a revolver), in which case they are positive, or, more commonly, the financing fees for term loans and bonds are recorded as a contra-liability, in which case they are negative and reduce the carrying value of debt. They represent the difference between the face value of the debt that will eventually have to be paid to the investors and the actual proceeds of the debt to the borrowers, which will be lower by the amount of the fees (thus they must be negative on the liability side of the balance sheet).
BB
Leveraged_Sellout
September 21, 2023 2:22 pm
Hi,
I just wonder one thing. Here the assumption “Cash Free, Debt Free” means that EV=EqV. Given that, having the amount of EV, allows us to know what will be the proceeds of the shareholders that are cashed out. I understand the Sources & Uses section, and how EV + others costs of the transactions are financed. However, when I think about it, i cannot see how the new Equity has into account the 100% of the sponsor equity. We have to pay 625$ to the previous shareholders with 300$ of debt and 70$ of rollover equity (which is actually not paid, but only for illustrations purposes). So we are left with 255$ that we have to give to the former shareholders that are exiting the business. If the Sponsor contributes with 278$, we are left with 23$ free of charge that could add to the new equity + the rollover (actually only the rollover, because the 23$ go to other costs of the transaction), but i don´t see how could be added all 278$ to the new equity and still cashing out the previous shareholders.
Regards.
Brad Barlow
September 29, 2023 11:21 am
Hi, Dario,
Of the new equity of $278, only $255 goes to the oldco owners ($625 EV less $300 financed by debt and $70 rolled over), and the remainder goes to putting cash on the balance sheet and paying fees. The $278 is a plug, it is how much remaining funds are needed to cover all the uses.
BB
Michael
November 13, 2023 12:44 am
For the Interest Expense Calculation, how come the Amortization of Financing Fees wasn’t added? Wouldn’t the current totals technically be total cash interest expenses? Thanks.
Brad Barlow
November 14, 2023 9:10 pm
Hi, Michael,
Note that amortization of financing fees is included on the income statement adjacent to interest expense, so it is in the right place. It could be reported as part of total interest expense, but this is just as good and a bit more transparent.
BB
Michael
November 13, 2023 3:05 pm
How come amortization of financing fees was not added to the total interest expense calculation (total interest expenses of all debt tranches)? Thank you!
Brad Barlow
November 14, 2023 9:03 pm
Hi, Michael,
Amortization of financing fees should be included in the interest expense line item on the income statement, even if it is not always included in the calculation of total interest expense in the schedules below. Note that in the I/S the amortization of financing fees is adjacent to interest expense.
BB
Jane
December 9, 2023 11:41 am
How can I tell if an LBO test is cash free debt free? Like when am I supposed to refund net debt in the uses vs not/ make equity value = EV? I don’t see how in the instructions it clearly states its CFDF, so I’m wondering how I’ll be able to catch that on a test.
Brad Barlow
December 11, 2023 3:59 pm
Hi, Jane,
We typically assume CFDF. However, look for wording around what is purchased and for how much. If you are purchasing a company’s stock, then you’ll calculate equity offer value, and your uses of funds will then likely include both buyout of equity and refinancing old debt, and your sources will include excess cash. But if you are given an EBITDA multiple purchase price, then put EV in your uses and don’t worry about oldco debt and cash.
BB
Aries
January 2, 2024 12:16 pm
Hi,
I have a question regarding the source & use of fund. Since the target (portfolio company) will be acquired on a CFDF model, then why the use of fund begin with the “purchase enterprise value” rather than the “purchase equity value”? I’m thinking if the existing net debt is completely irrelevant to the sponsors, then why raise debt & sponsor’s equity fund to cover the net debt, which is included in the total purchase enterprise value and hence the total use of fund?
–In the advanced LBO case study, the net debt is added-back, outputing the purchase enterprise value and being included in the total use of fund. I thought the inclusion is because 1) the transaction is not on a CFDF basis and the recapitalized target (portfolio company) will **refinancing** the net debt. Am I wrong?
Brad Barlow
January 2, 2024 1:09 pm
Hi, Aries,
In a CFDF transaction, what is being purchased is the operations of the business, which is the oldco enterprise value. The seller then pays off their own debt and walks away with any excess cash, and what remains to them is the oldco equity value (EV – debt + cash). The new debt and equity is simply how the purchase is being financed.
BB
Thad
January 20, 2024 4:32 pm
Could you explain why monitoring fees are placed below EBITDA instead of before EBITDA. When going from Gross Profit to EBITDA it looks like we’re accounting for all expenses aside from D&A. Therefore, shouldn’t we have something such as:
I suppose it is because monitoring fees are not considered part of the intrinsic operating costs of the core business, but rather costs imposed by the PE firm which may not be common to comparable companies in the sector.
BB
Thad
January 27, 2024 4:57 pm
Got it – but if they aren’t considered a part of the operating costs of the core business, shouldn’t they be placed below operating income (EBIT)? When moving from EBITDA to EBIT we just subtract the D&A. Therefore why are the monitoring fees included – they aren’t D&A?
Brad Barlow
January 28, 2024 9:41 am
Hi, Thad,
Apologies, I am just now seeing this; yes, if the fees are considered an operating expense, they should be included in EBITDA if they are paid in cash, and if they are non-operating, they should be below EBIT. I am not sure why they have been placed where they are, and I can raise this question with the content creator.
BB
Jair
April 15, 2024 11:54 am
Thanks for the case! it was really good! Just one question/observation, why is it that if the transaction is on a CFDF basis, meaning the acquirer won’t receive the pre-transaction existing cash or debt on the target’s balance sheet, for the PPA you consider the purchase price as net from the pre-transaction cash and debt? I think there might be a disconnection between the transaction assumption and the assumption for the PPA, given that the book value being acquired on day 0 won’t be $115, but rather $165 (free of cash and debt).
Brad Barlow
April 15, 2024 8:12 pm
Hi, Jair,
It will come out to the same in the end. If what is being allocated in the PPA is the fair market value of existing assets and liabilities, including debt and cash, then what is being valued is equity value, so the purchase price of equity is the starting point for that, and then debt and cash are included in how that value is allocated to the B/S (in order to get to goodwill), even if they will be eliminated in the CFDF transaction.







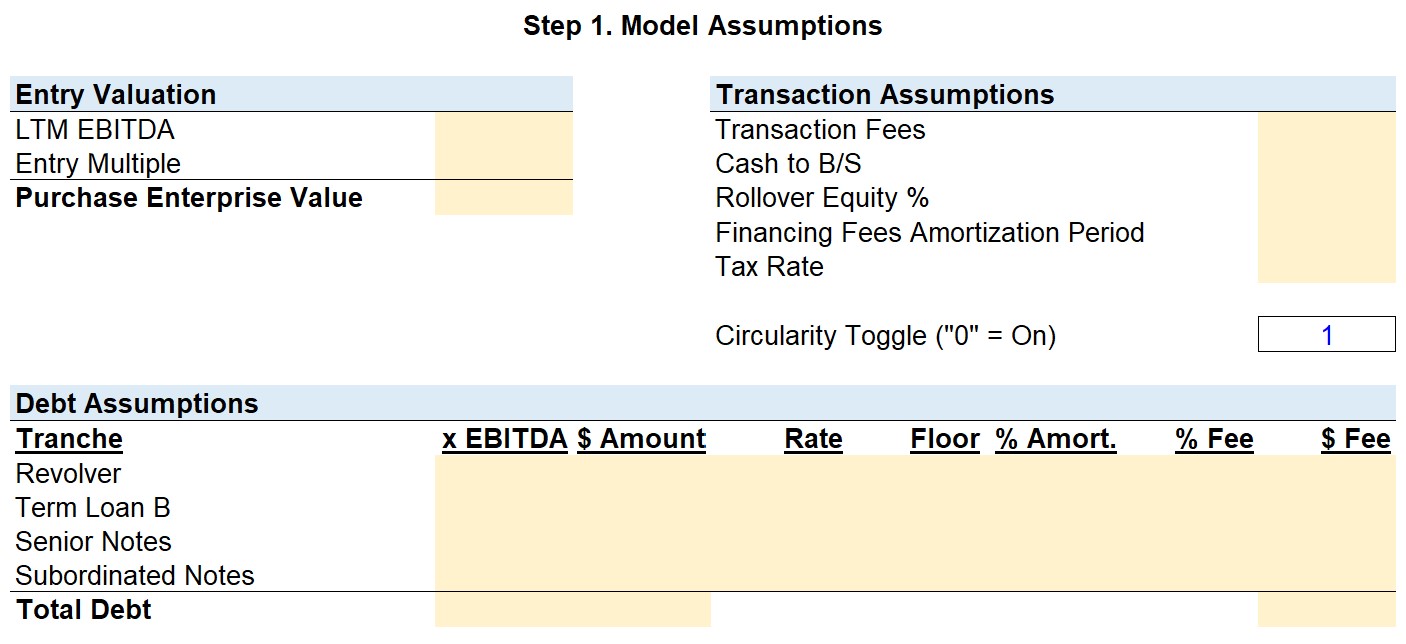
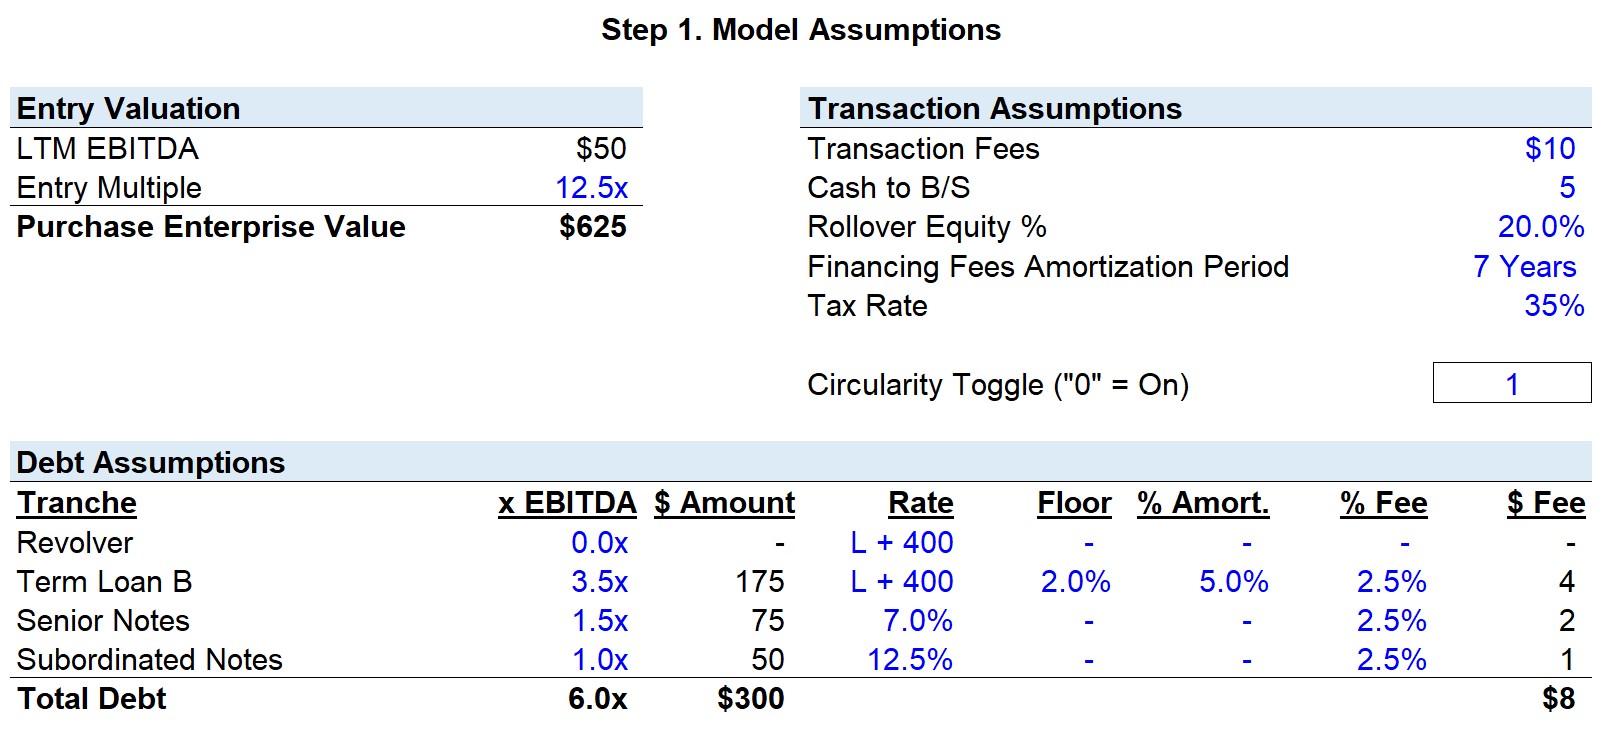
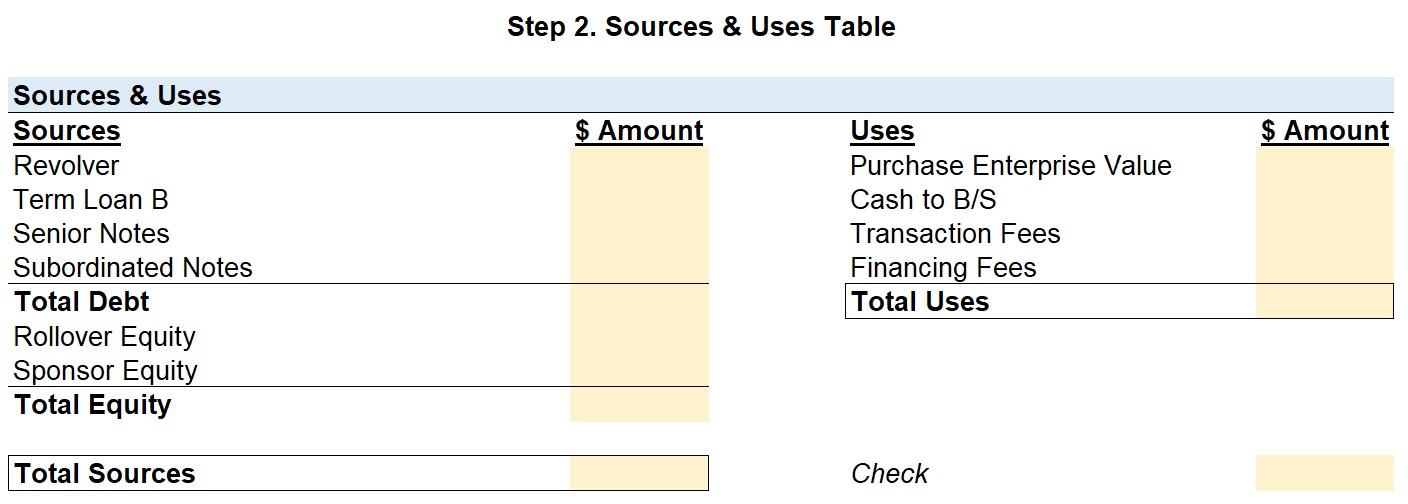
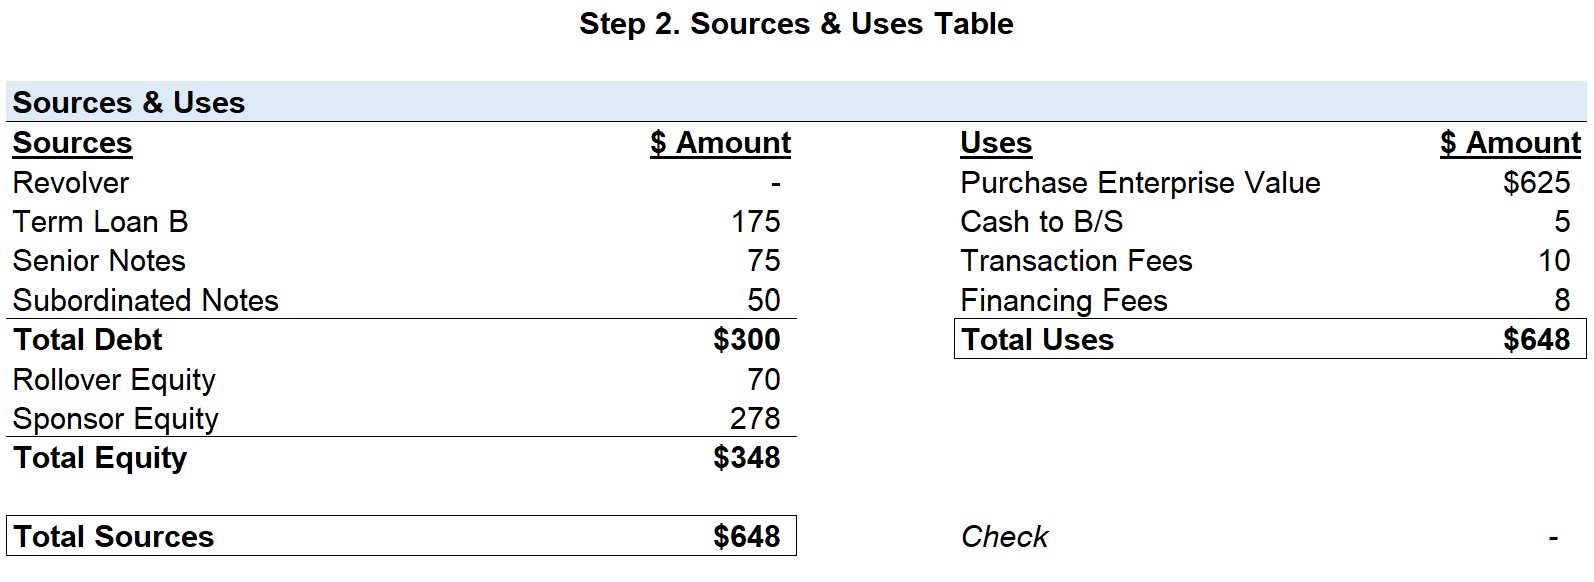
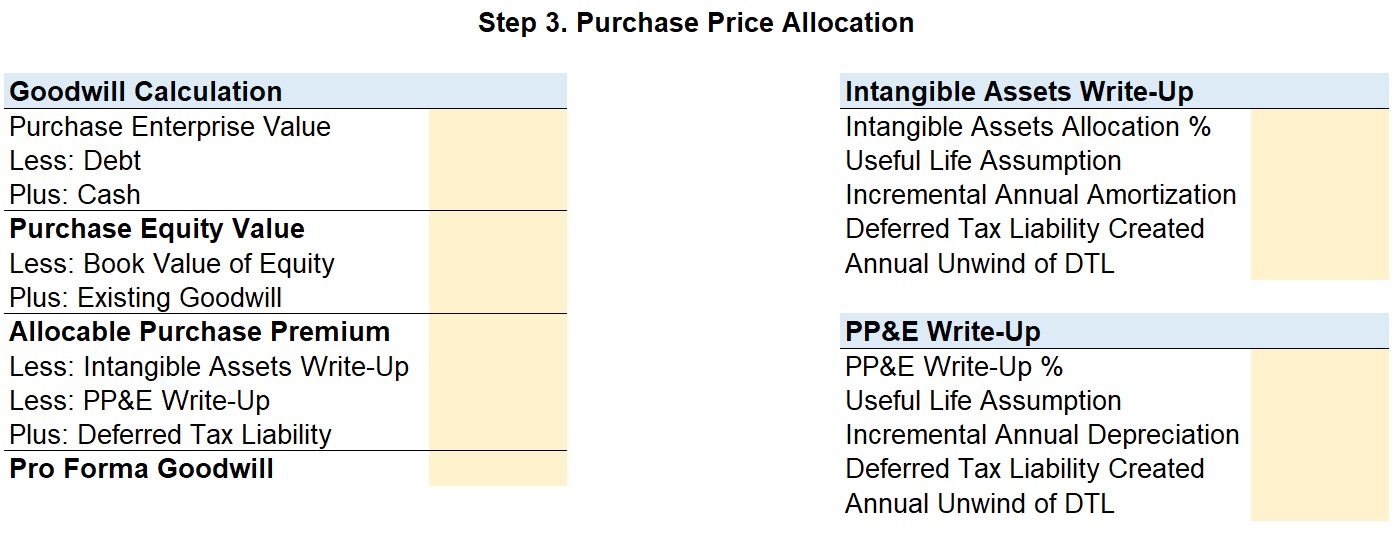
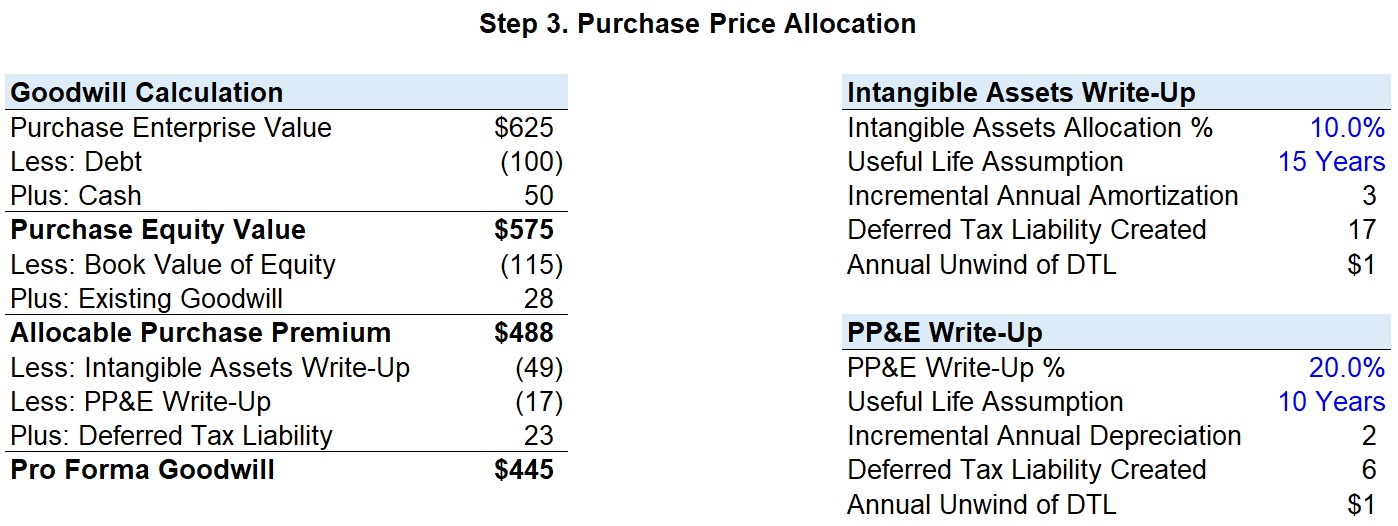
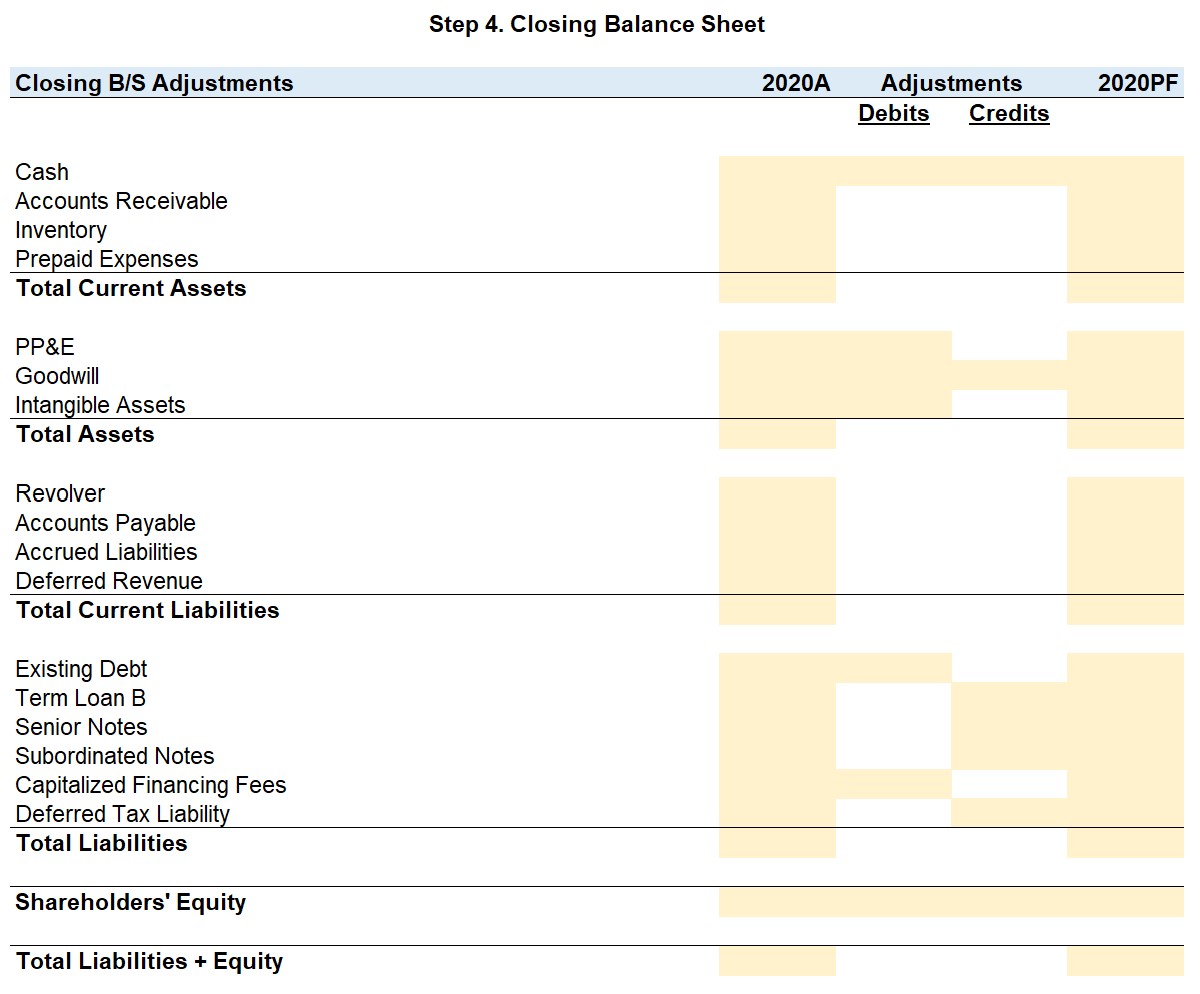
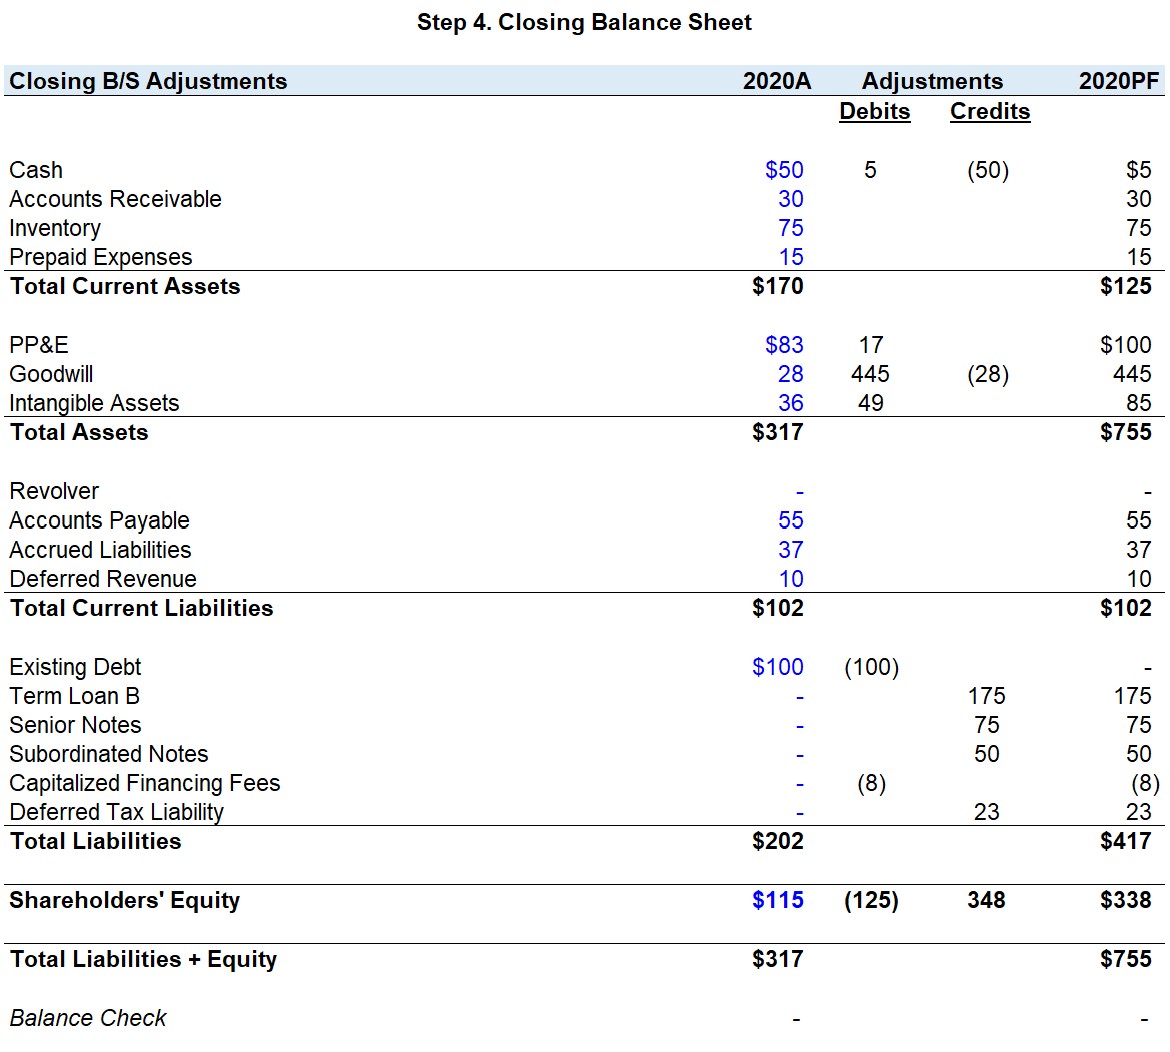
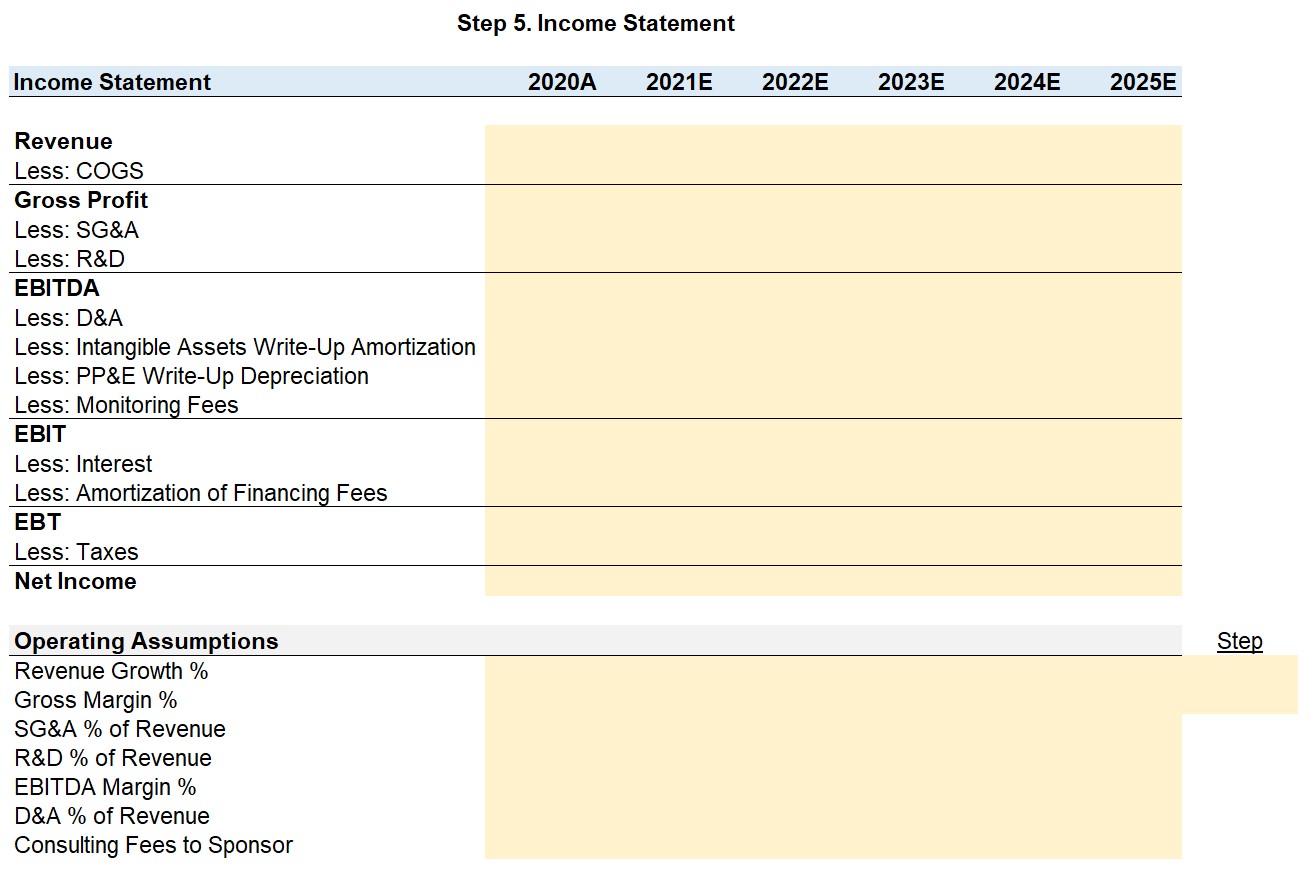
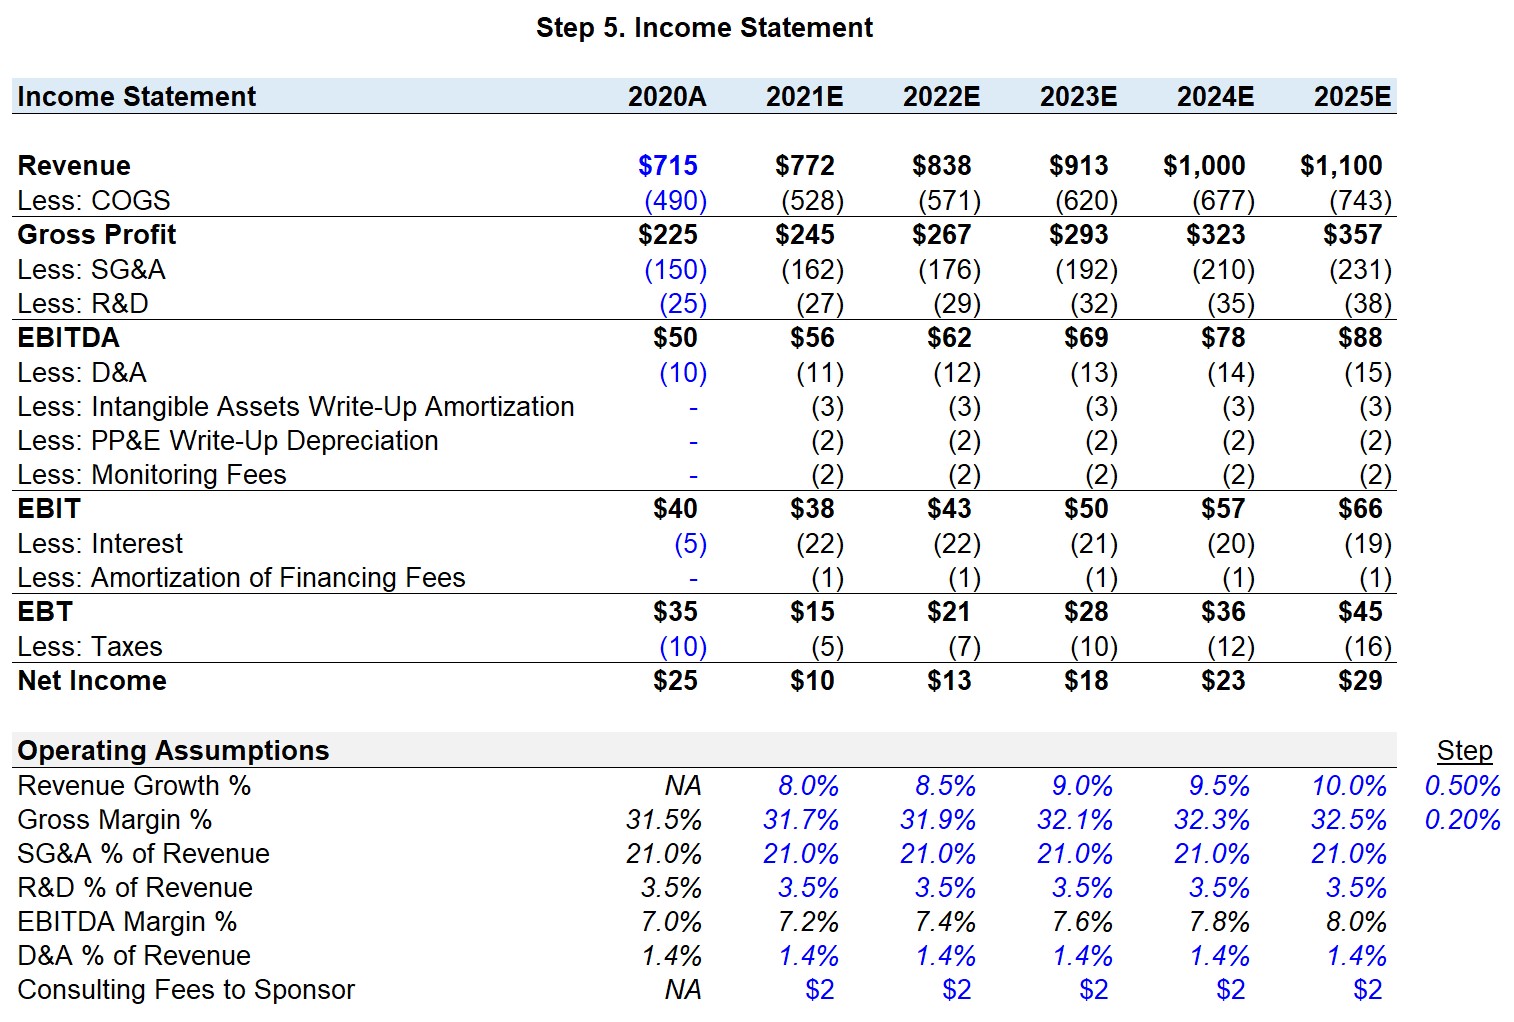
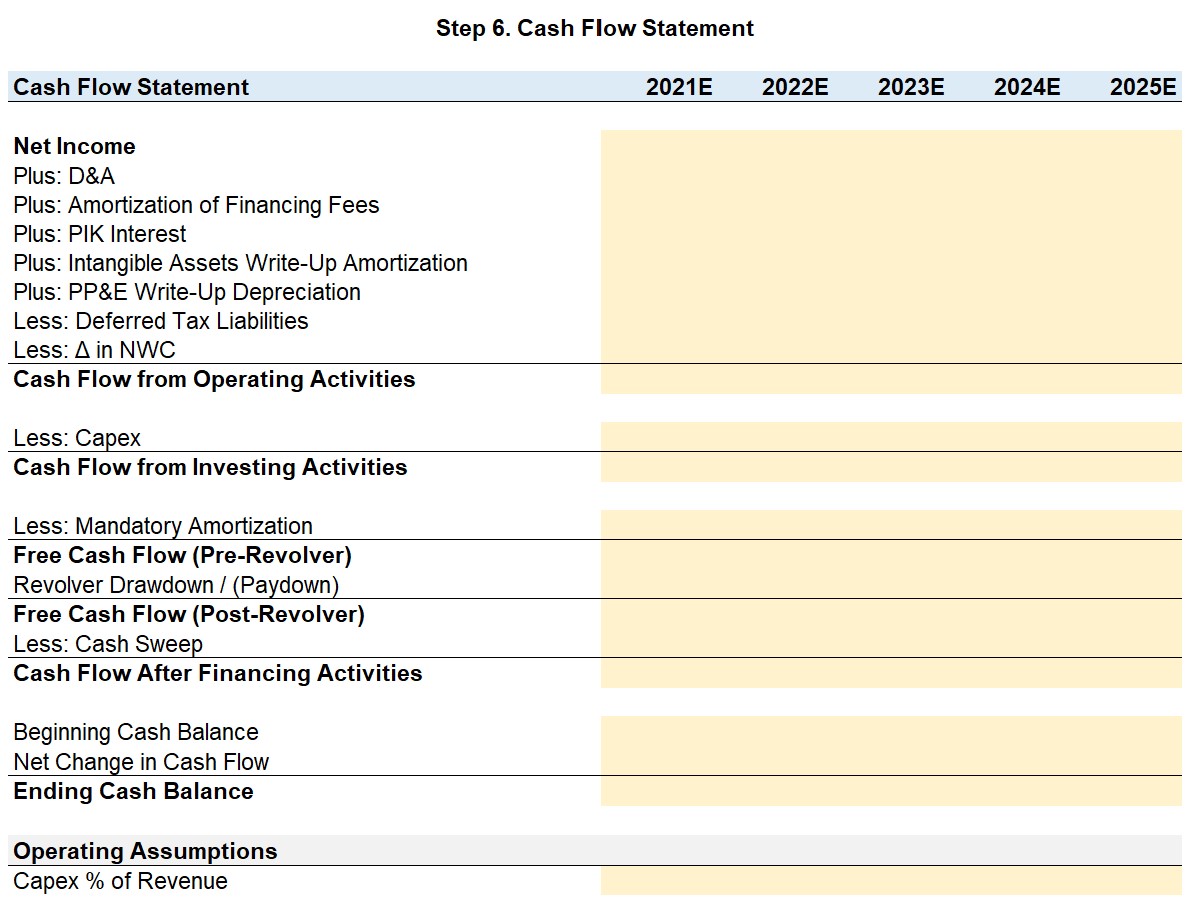
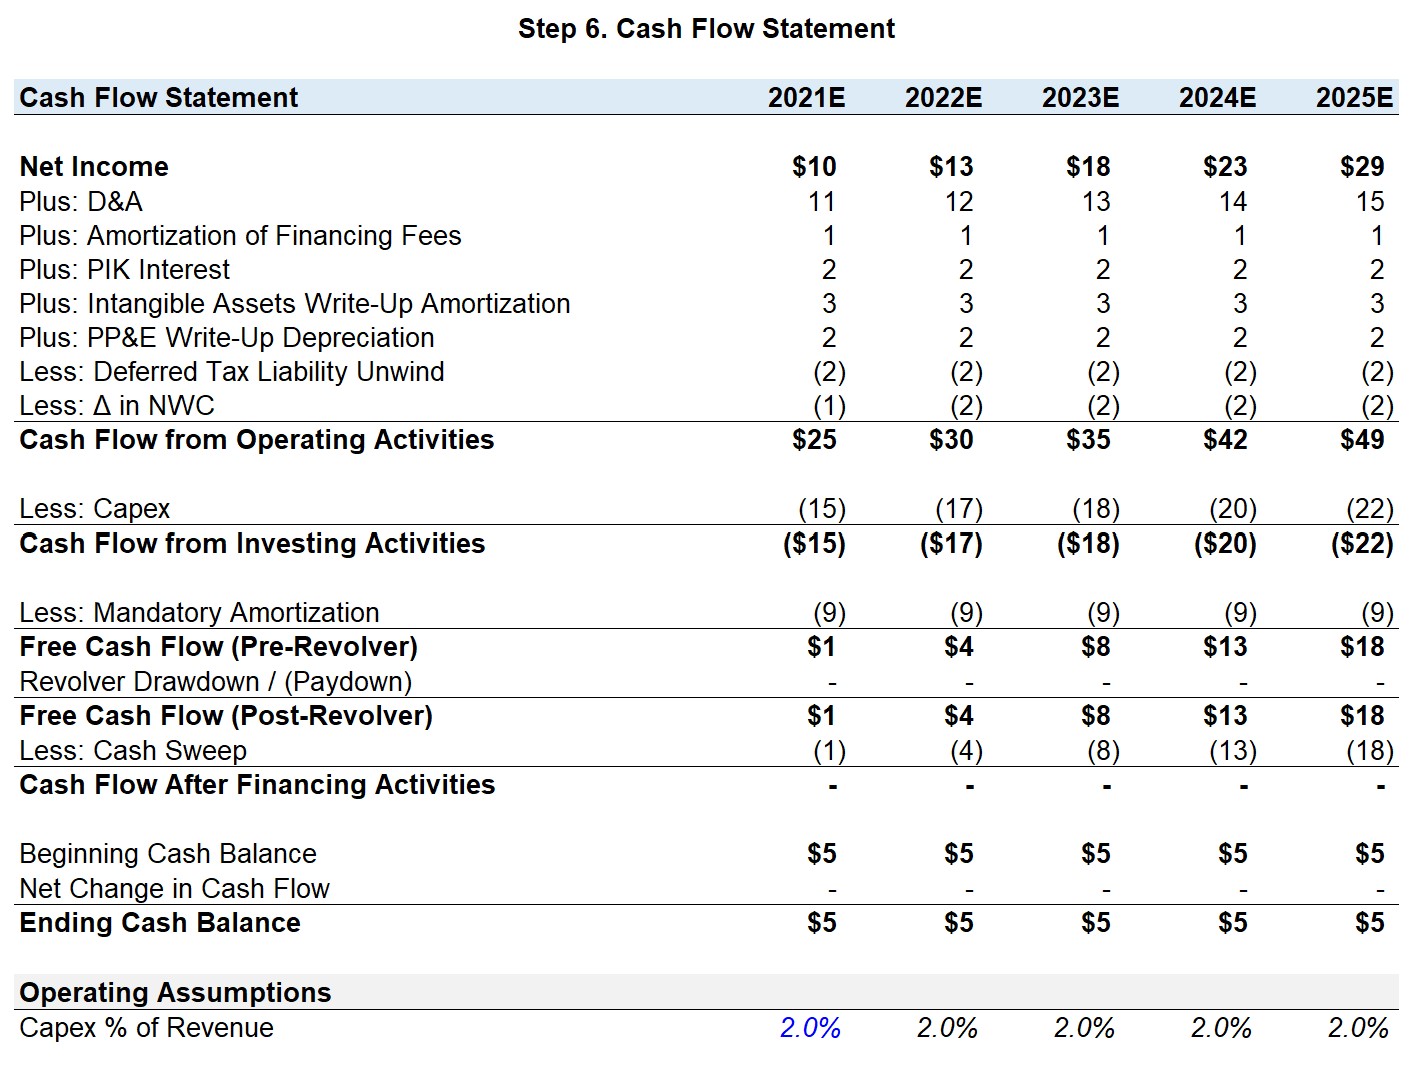
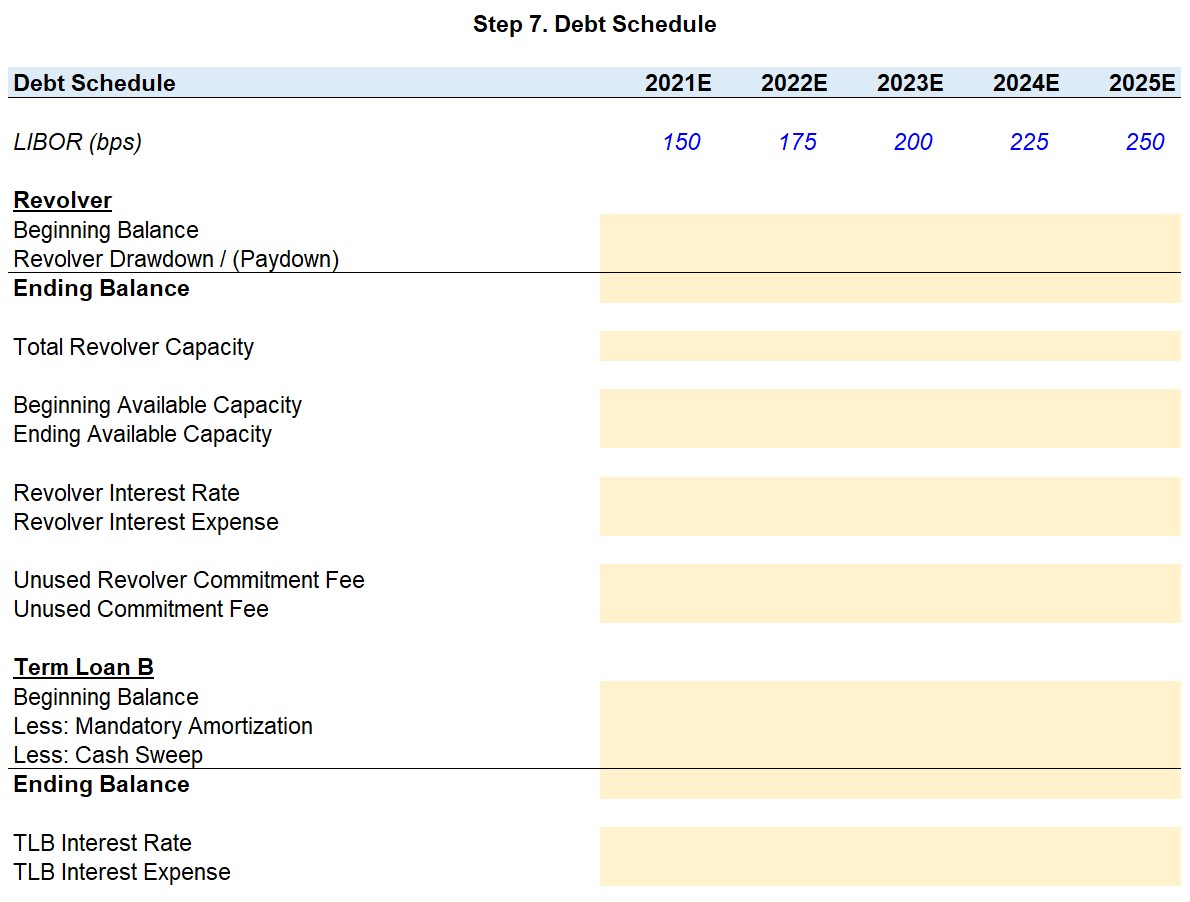
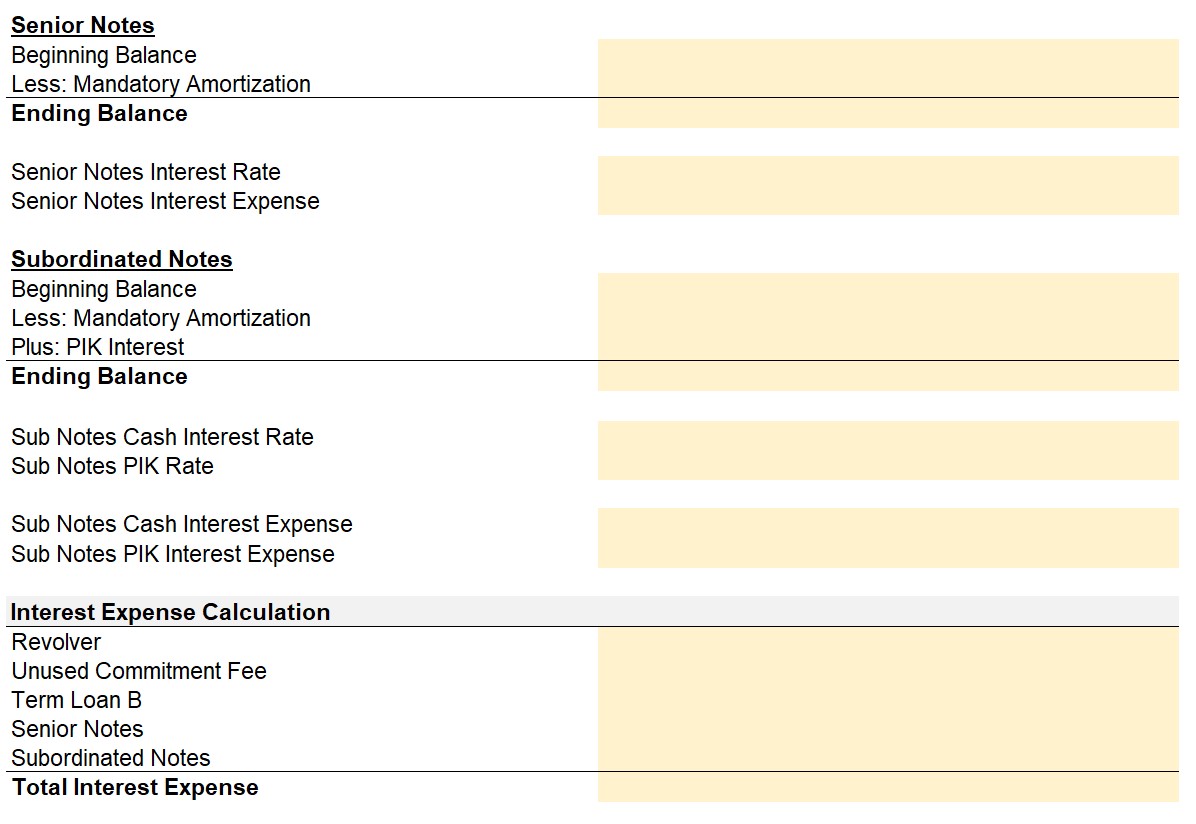

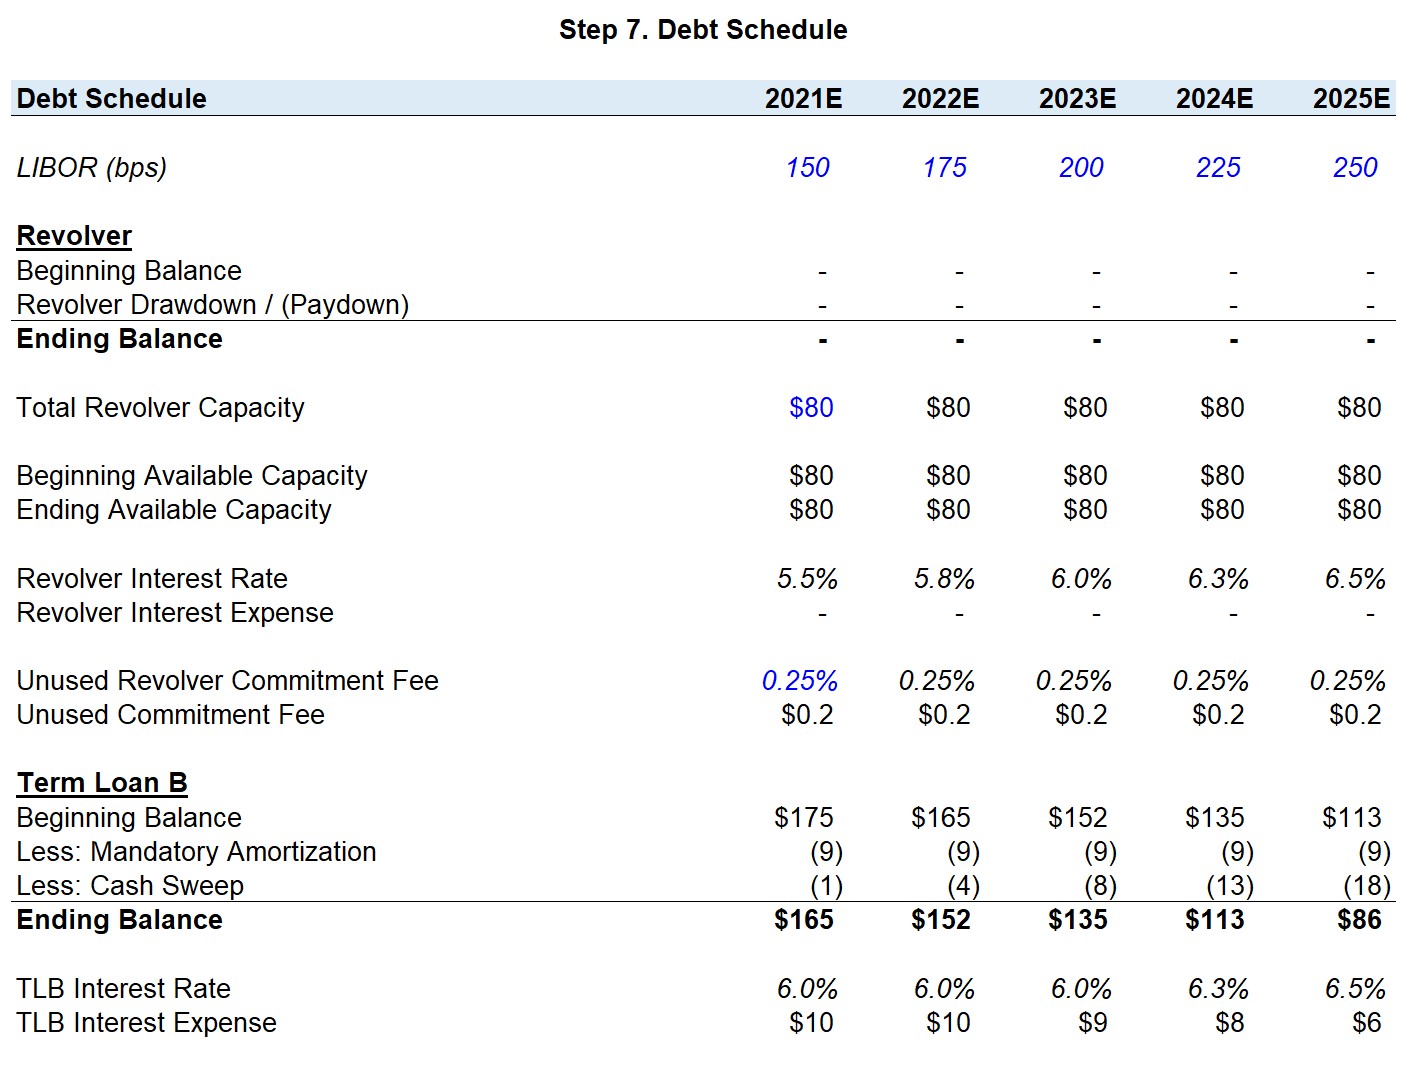
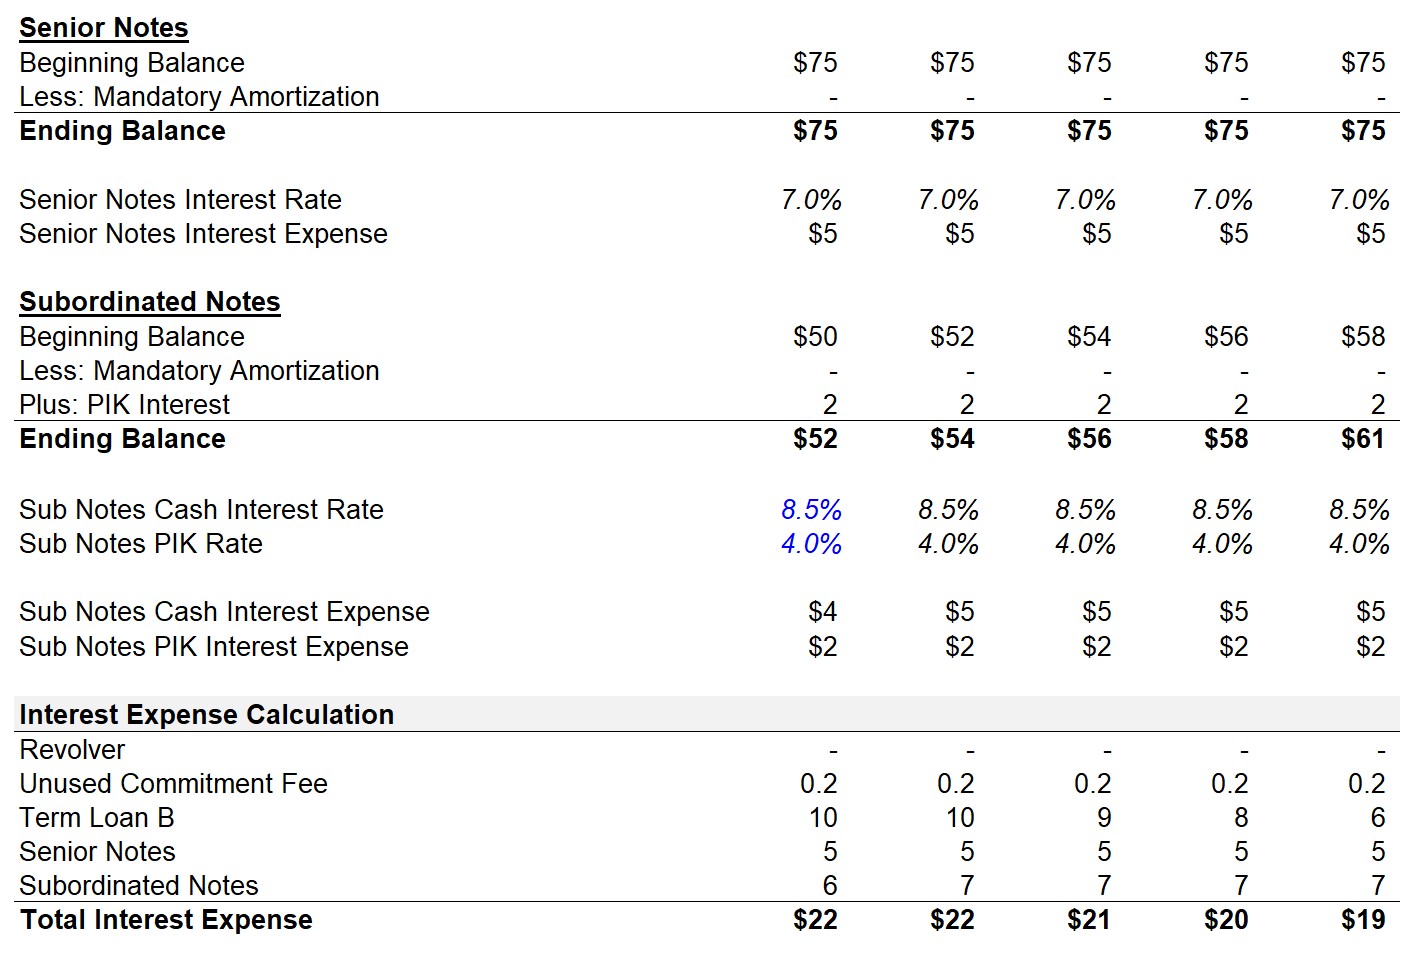
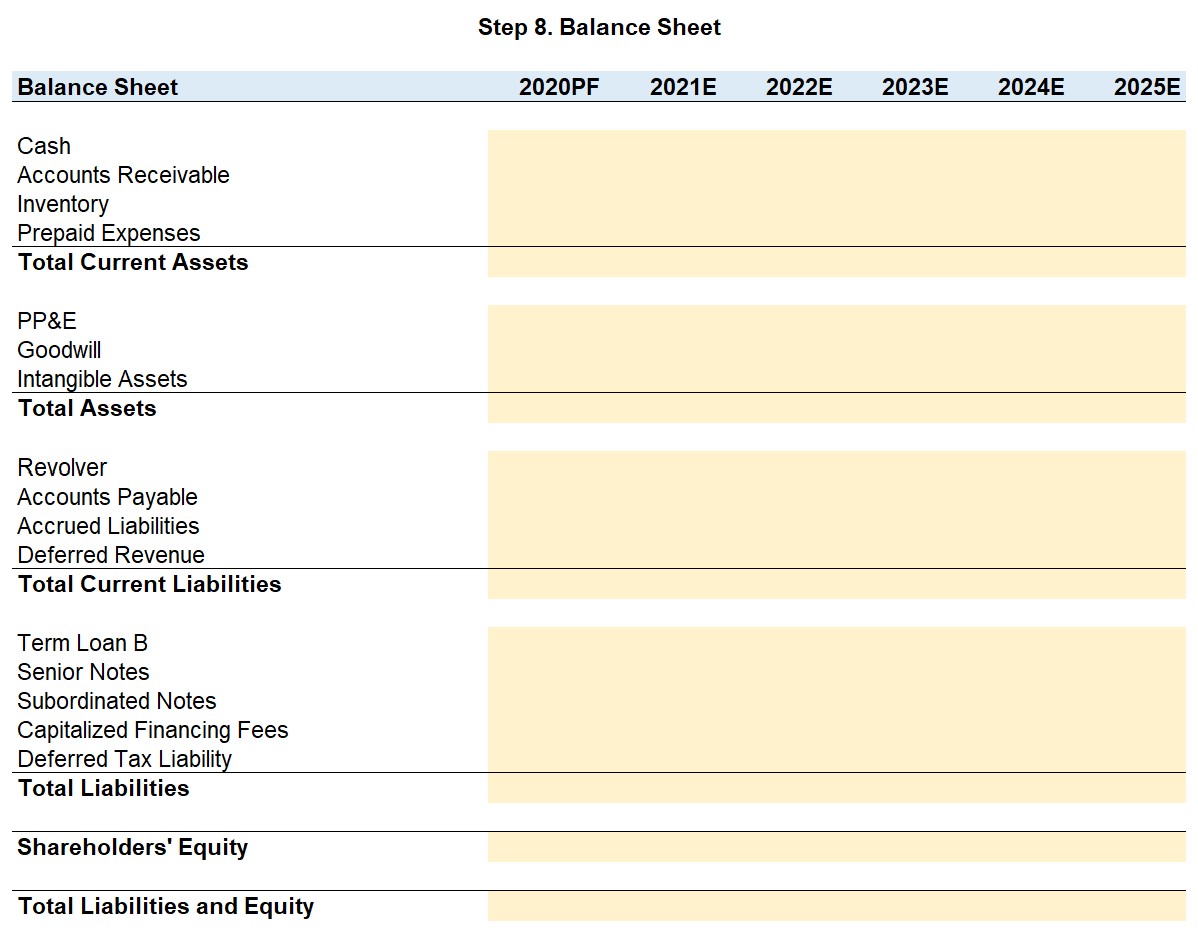
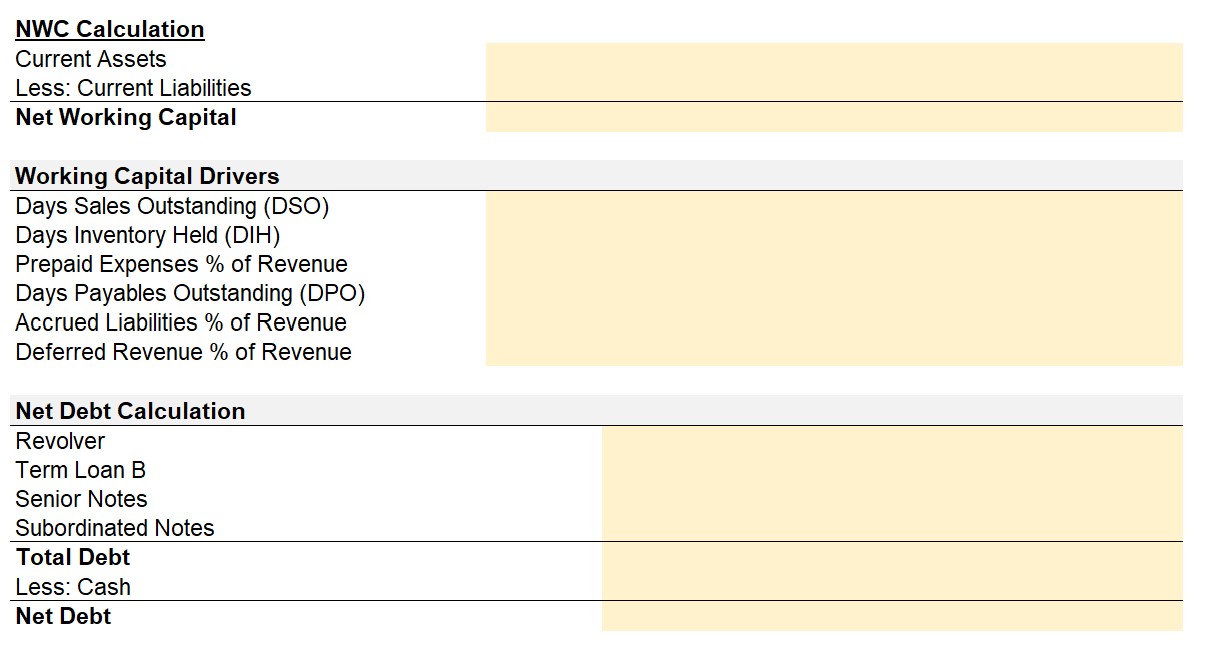
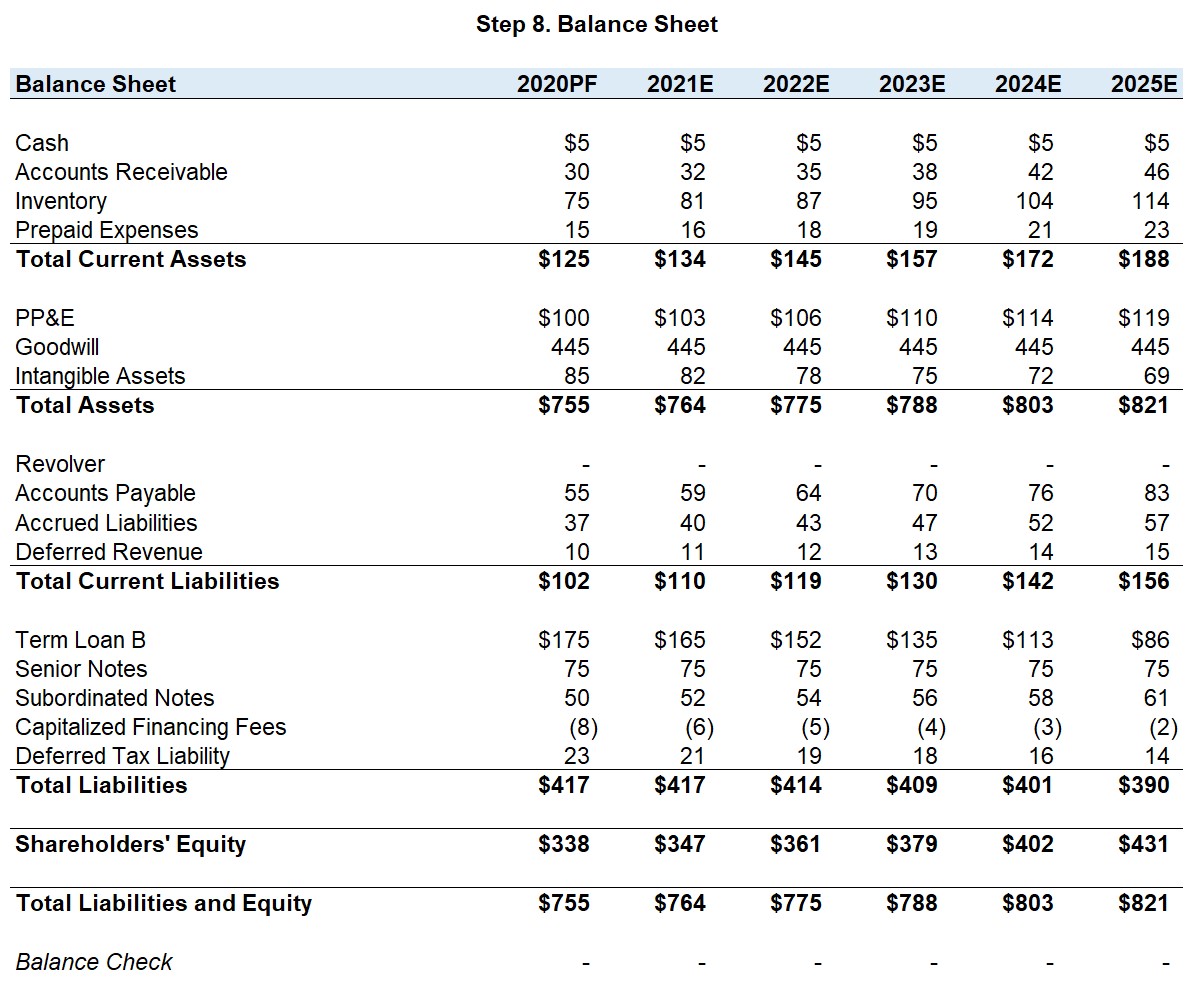
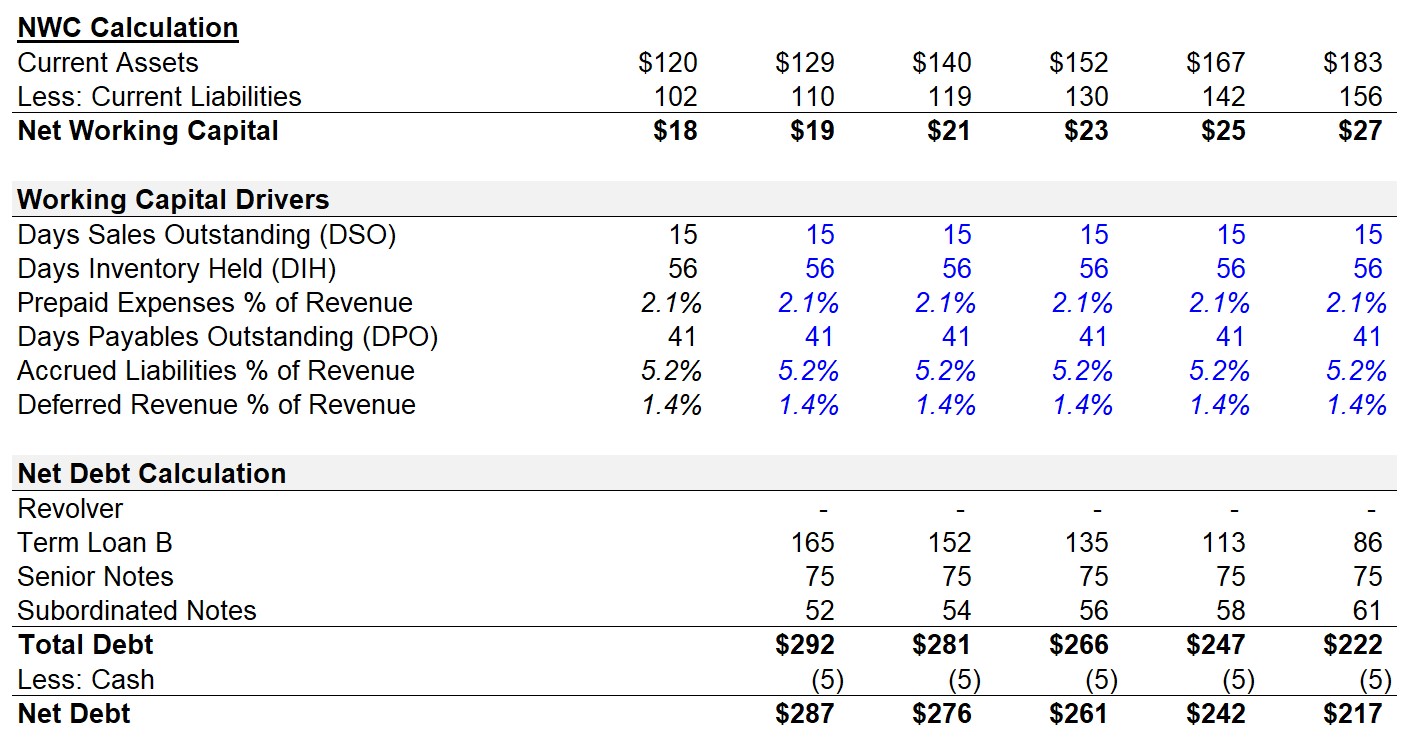
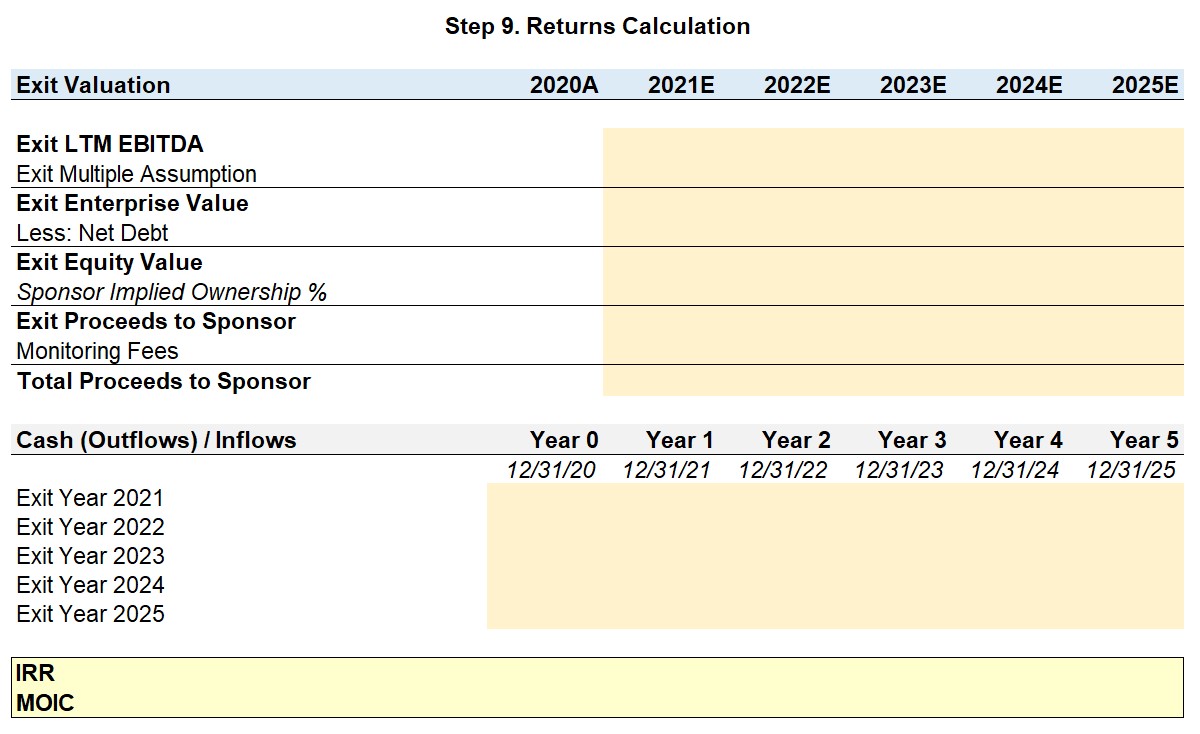
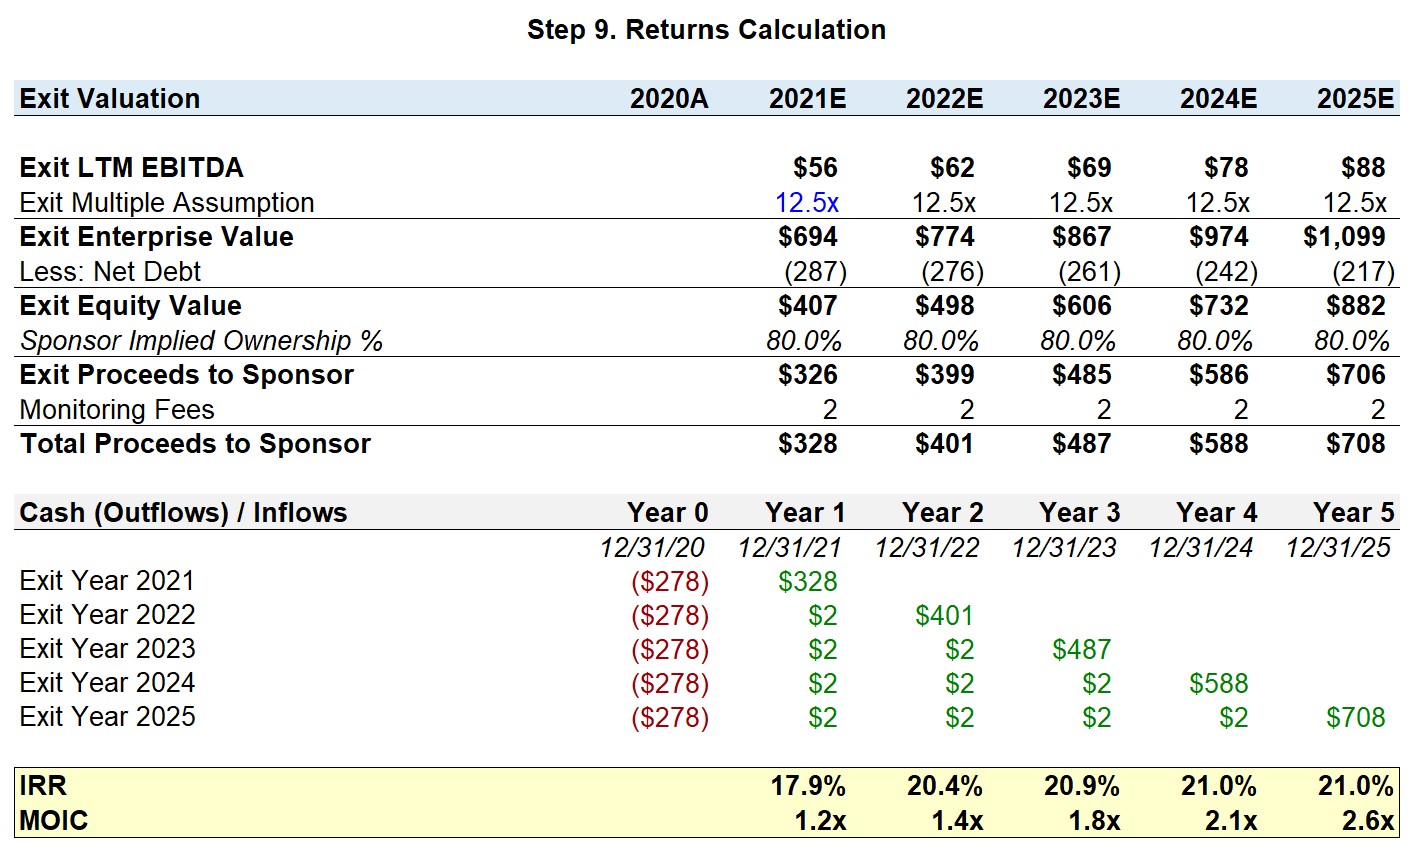
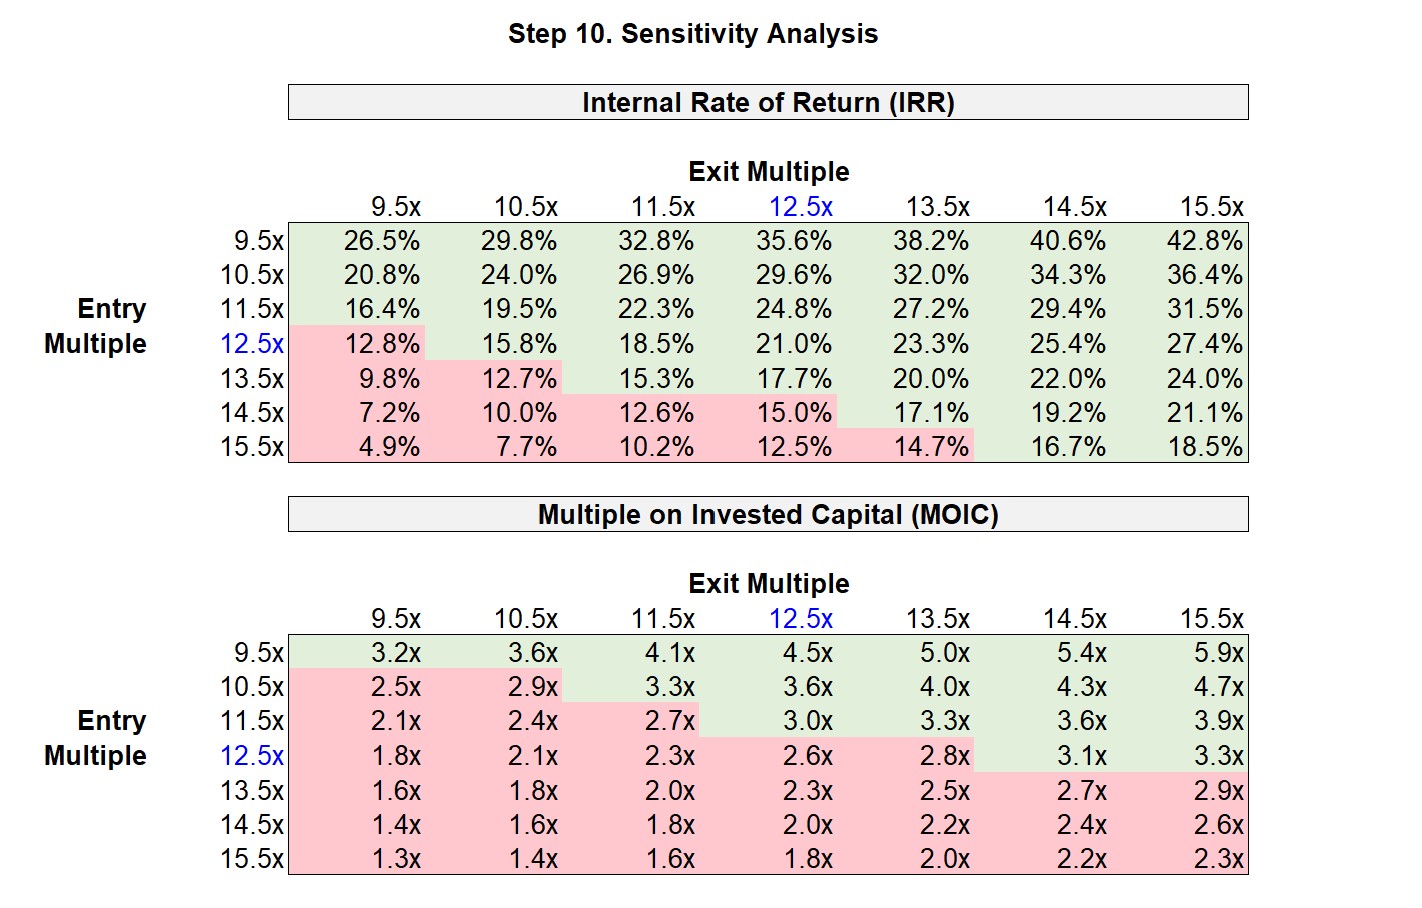
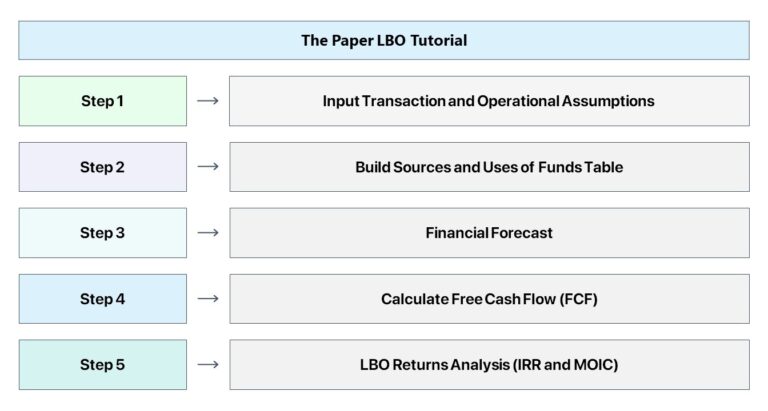




Quick question on the roll over shouldn’t the formula be 20%x(Purchase Enterprise Value) as the management is re-investing 20% of the proceeds from the initial sales (assuming they owned 100% of the target)?
Armin:
No, it would be 20% of buyout equity.
Best,
Jeff
comment deleted
Hi Jeff – to piggy back off of Armin’s question on the Rollover Equity amount calc…
In your example, the Rollover Equity amount is calculated as such:
(Total Equity $348) * 20% = $70 Rollover Equity
…where Total Equity = (Total Uses $648) – (Total Debt $300)
Wouldn’t the amount of Rollover Equity to calc be:
20% * (Purchase Equity Value $575) = $115 Rollover Equity
Why is the Equity Value based on the Total Uses and not the actual Purchase Equity Value? Any color would be appreciated.
Best – John
John:
No, that’s a fair point. It probably should be based off of the original equity and not the NewCo equity.
Best,
Jeff
John:
Adding to this, I suspect the intent was that management was not going to rollover the full amount… just 20% of the NewCo. But I agree this isn’t 100% clear.
Best,
Jeff
In this scenario, the 20% doesn’t mean that the management team is rolling over 20% of their pre-LBO equity, but rather their rollover will represent 20% of the post-LBO equity.
If the sponsor’s investment is 80% of the required equity contribution, then the management rollover comprises the rest – so, that’s the pro forma equity ownership and why the prompt states “the remaining 20% being rolled over by the existing management”.
Because we’re told the sponsor holds an 80% implied ownership stake, rollover equity can be calculated using this simplified approach, which is actually quite common in modeling tests.
The required equity contribution can be calculated from total uses less the total debt financing, $348mm ($648mm – $300mm). So, the rollover equity is 20% of the required equity, $70mm (20% x $348mm), while the sponsor equity is 80% of the required equity, $278mm (80% x $348mm).
If the rollover equity was $115mm, then the sponsor equity amounts to $233mm ($348mm – $115mm), only 67% of the post-LBO total equity.
Additionally, the amount of sale proceeds belonging to the management team was never given, so the implicit assumption you’re making is that management owned 100% of the target’s equity at exit. If data points like the value of management’s stake and percentages were listed, then we could compute the value owned by management and apply a percentage to determine the rollover amount – but in this case, we’re not given much information.
also wanted to ask if the PIK interest formula is correct in the excel – it should sum the beg. balance plus mandatory amortization (as the latter is expressed as a negative figure)? rather than deduct the mandatory amortization
Nicholas:
Good catch… you are correct that this should be an addition and not a deduction.
Best,
Jeff
Hi Nicholas,
The formula for the subordinated notes ending balance takes the sum of the beginning balance, mandatory amortization, and PIK interest.
The “Less” in front of mandatory amortization just refers to the sign convention, not the formula.
Why is PIK interest taking the net of the beginning balance and the ammortization? Isn’t PIK normally just based on beginning balance?
Amit:
If a PIK security’s principle is being paid down then the PIK accrual will be lower.
Best,
Jeff
Why is the $50M of net debt ($100M of debt and $50M of cash) on the existing balance sheet not included in the uses section? Shouldn’t it be:
Josh:
Since this is a cash-free/debt-free transaction, the seller would use the Purchase Enterprise Value proceeds to pay down the existing debt and keep the remaining cash. Therefore, the net debt/net cash is implicitly “taken care of” in the Purchase Enterprise Value of $625.
Best,
Jeff
Hi Jeff,
Since the subject transaction is a CFDF-based one, meaning the existing pre-LBO net debt will not be carried over/refinanced, then why in the use of fund side total Enterprise Value is used to directly add the transaction and financing fees? Should’t it be “EV – existing net debt + fees” to the actual balance for the total use of fund?
Moreover, the “EV” calculated using EV/EBITDA multiple should not be equal to the the purchased equity value right? Because in the Allocable Purchase Premium section the purchased equity value was obtained by deducting pre-LBO net debt from the EV.
Since the purchased EV is both net debt and equity, the total source of fund will be partially used to finance the existing net debt right? But it will be contrary to the premise narrated in the prompt – a CFDF basis.
Hi, Grace,
When we purchase a company on a CFDF basis, we are purchasing the value of the enterprise, which for the seller will equal the value of operations, which can then be used to pay off their own debt, and what remains plus any excess cash is equity value to them. EV is what we should show in uses of funds, because that is what is being purchased from the seller. The purchased equity value would be the EV – debt + cash.
BB
Regarding the goodwill calc: Why are we deducting the existing (i.e. pre-acquisition) net debt, given this is a cash- and debt free transaction?
Thanks,
Mike
Mike:
In order to calculate goodwill, we need to determine the seller’s proceeds (basically the equity value). Thus we take the purchase enterprise value, deduct debt and add cash.
Best,
Jeff
It says first that the D&A from the write-ups are not tax deductible:
“While the additional depreciation stemming from the PP&E write-up and the amortization of intangibles are deductible for book purposes, they are not deductible for tax purposes.”
Then it says “However, JoeCo is a private company being acquired by a financial buyer. Thus, a higher D&A expense results in a lower taxable income, which leads to more free cash flow available to paydown debt.”
Which one is it? Thanks!
Mike:
It is the former… I’m not sure why we say cash flows will be higher.
Best,
Jeff
Mike,
The latter point was bringing attention to how financial buyers do not have the same incentive as publicly-traded strategic acquirers, which the sections above were discussing.
A public acquirer would try to limit asset write-ups (and the incremental D&A) in order to reduce the post-acquisition EPS dilutive impact and show higher accounting profits.
But for private companies undergoing an LBO, their profits under a GAAP basis become less of a concern.
Shouldn’t capitalized financing fee be an asset and we debit it to assets vs liabilities?
Capitalized financing fees are recognized as a contra-debt account, rather than an asset.
The article below contains more details regarding the updated accounting treatment:
https://www.wallstreetprep.com/knowledge/debt-accounting-treatment-financing-fees/
I think the toggle description is backward based on the formulas used. 1 enables circular references whereas 0 does not.
Hi Amit,
“1” should enable circular references while “0” cuts off the circularity.
So if the circuit breaker is off (i.e. set to “1”), the average debt balance is output, which is then multiplied by the applicable interest rate.
Why in the current liabilities cell for the current liabilities used in the net working capital calculation do you exclude the revolver (whereas it was included in total current liabilities)?
Amit:
Debt is not considered a part of working capital (it’s a finanical liability unrelated to operations/workings).
Best,
Jeff
So instead of doing Current Assets – Current Liabilities we are doing (Current Assets – Cash) – (Current Liabilities – Revolver)?
Amit:
Yes, cash and debt are not considered working capital.
Best,
Jeff
Thoughts on deferred tax liabilities falling under Net Debt when you calculate Equity Value off of Enterprise Value?
Amit:
No DTLs are not considered debt.
Best,
Jeff
In the income statement you deduct the gross amortization of intangible write-up and gross depreciation of PP&E write-up – that reduces the tax payable. However, you mention that the write-ups should not be tax deductible. Shouldn’t you then add back the DTL unwind in the income statement, above EBIT? In the model above, DTL unwind is not accounted for in the I/S; only in CFS.
Paul:
Any deferred tax impact is implicitly included in our tax rate assumption.
Best,
Jeff
Hi, question: Why do we add the DTL on the PF goodwill calculation?
Juan:
In fairness I prefer the approach we teach in class: purchase price less the FMV of net assets. The math in this example gets you to the same answer but it’s less intuitive. You have your allocable purchase premium, some of which goes to intangibles and PP&E offset by DTLs.
Best,
Jeff
How do we get to the Book Value, Existing Goodwill and the LTM PP&E balance of $83mm in Step 3?
Lennard:
These numbers are given to you as part of the balance sheet.
Best,
Jeff
Could you elaborate on why there is double-counting in this part: “The reason we wipe out the existing equity book value is that it no longer exists (i.e. will be replaced by the new equity investment) and then we add existing goodwill because we would be double-counting it if we did not.”
It feels different from the explanation from this video https://www.wallstreetprep.com/wsp_lesson/purchase-price-allocation-exercise/
During this video, existing goodwill is reduced on assets and shareholders’ equity. Here existing goodwill is only subtracted from the assets.
Hi, Ismael,
The second explanation is a clearer presentation, in my view. But the point in the first explanation is that when you are trying to calculate the new goodwill, you add back the existing goodwill and subtract the write-up of other assets to figure out the difference between the purchase price of net assets and the existing book value. As for wiping out the old equity value, that simply means that the company’s old equity is eliminated because it has been purchased.
Brad
Thank you!
Just to follow up on this question regarding PPA. Here you have allocable purchase premium calculated as (purchase price – existing net debt) – (assets – goodwill – liabilities).
However, in your discussion regarding PPA here https://www.wallstreetprep.com/knowledge/purchase-price-allocation-ppa/, you use purchase without netting with existing net debt. This is a contradiction to the standard model PPA.
As well, in this discussion here https://www.wallstreetprep.com/knowledge/cash-free-debt-free-why-its-used-and-impact-on-enterprise-valuation/, you also say that purchase price = purchase equity value = enterprise value. This is a contradiction to the standard model PPA.
The purchase price in the PPA post refers to the “Equity Purchase Price” (Row 5). There is no mention of the net debt concept, since the starting point of our exercise is the equity purchase price, i.e. implied to be post-adjustment for net debt.
The CFDF post states, “In CFDF deals, the purchase price delivered to the seller is simply the enterprise value.”
In our illustrative example, the equity value and exit proceeds to the seller is $820 million under the CFDF and non-CFDF transaction structure. However, it would be incorrect to interpret that as “purchase price = purchase equity value = enterprise value”. In the transaction assumptions section of the model, the enterprise value is $1 billion (Row 8), whereas the equity value is $820 million (Row 11) – thanks!
Why are you not considering a tax shield in the transaction fees, when adjusting the closing B/S? Instead of $10, shouldn’t we reduce 10*(1-Tax) from “retained earnings”?
Hi, Ismael,
Assuming all transaction fees are both expenses and paid at the time of the deal, and assuming they are tax-deductible expenses, then yes, they would need to be modified by (1 – tax rate) in the final effect on retained earnings. But you would need to consult with a tax advisor to make sure of the specifics.
Brad
Any advice on fixing #NUM! errors of what might be going wrong?
Hi, Winnie,
The #NUM error in excel occurs by an invalid argument in an Excel function or a formula that produces a number too large or too small to be represented in the worksheet. It is not the most common error. It may be from a function you are using incorrectly.
BB
It’s usually the result of incorrect linking of 3 statement model or missing a line that’s putting the statements out of balance. Double check interest expenses are properly linked to cash flow, income statement…etc.
Thanks for sharing your experience, Xinxin!
BB
What’s the closing balance sheet adjustment for the current portion of LT debt? Assuming cash-free debt-free transaction.
Hi, Minh,
In a model, it is easiest just to include CP of LT debt as part of LT debt (whether term loans or senior note), and it is paid off each year as it comes due, or at the end as part of the exit analysis.
BB
Why doesn’t cash sweep break the model by introducing a circular reference.
The way I see it the cash sweep is a function of excess free cash flow, but excess free cash flow is also a function of the cash sweep because cash sweep impacts interest expense which impacts cash flow.
Whenever i try to build out this lbo this issue ends up breaking my model, but for some reason it works fine in the example. Not sure where I am going wrong.
Hi, Liam,
See my answer to your other question. For the model to handle a circular reference, you must enable iterative calculations (Alt F T F, Alt I).
BB
Is cash sweep not a circular reference? Doesnt interest expense -> net income -> excess fcf -> cash sweep while at the same time cash sweep -> interest expense -> net income.
In other words, how can cash sweep both impact interest expense and be a function of interest expense. My model keeps messing up for this reason and not sure why it works in the correct example?
Hi, Liam,
Cash sweeps do cause circular references, exactly as you describe. This only happens because we use the average cash balance to calculate interest expense (for the sake of a truer result than we would get if we only used the beginning of period balance, since the balance can change daily). And to handle this, you must go to Excel options, under formulas (Alf F T F), and enable iterative calculation (Alt I).
BB
For the returns analysis, shouldn’t we use the cumulative monitoring fees? ie. If exit in year 2, the sponsor receives 2m in year 1, and 2m in year 2, so 4m of fees? Thanks
Hi, Gemma,
Yes, the returns should include the monitoring fees for each year, so that an exit in year 2 would be $4mm. But the timing matters for IRR, so the $2mm in year 1 is worth more than the $2mm in year 2!
BB
I have this model built and the logic seems to be flowing through correctly (it fully ties to the WSP version in this tutorial), although when I make the gross margin step down to “-0.2%” through the forecast period in order to test drawing on the revolver, my forecasted balance sheet is essentially off by the amount drawn in the revolver. Is there a standard relationship that causes this?
Hi, Wilson,
Make sure that you have the ending balance of the revolver linked to the balance sheet, and make sure you have the draw or paydown of the revolver linked to the CFS.
BB
Can you elaborate on why deferred tax liabilities do not seem to impact the income statement but are added back to net income to arrive at CFO? Why are they being added back although they are not subtracted from revenue in the first place?
Thanks!
Hi, Fran,
Deferred tax liabilities are taxes that have already been expensed in the past (so they hit past income statements) but were not yet paid in cash. In this model, they are being paid off, and thus the amount they are paid off each year is subtracted from net income to get to CFO.
BB
I recreated the entire model and was double checking the formula with the completed worksheet throughout. I think all the formulas are correct. The balance sheet is in balance. The only issue is that my ending Total Equity Value to sponsor is off by some $4M. Could this be normal with 3 statement models that use circular formulas?
Hi, Xinxin,
Circularities can account for very small variances, but if you are $4mm off, it is probably because of a difference between your model and the completed version of the one in the article. But it might be an immaterial difference, like rounding off an assumption; your formulas may indeed all be correct. The only way to know for sure is to work backwards from that number through the numbers that differ from the completed model to find the source.
BB
Hi! Thank you for this – very helpful.
One quick question. Why is it that you are not showing the annual ($2 million) monitoring fees on either the balance sheet or the cash flow statement? It states in the assumptions that $2m will be paid each year but only seeing that reflected on the IS. Wouldn’t this reflect a cash outflow which should be accounted for on the CFS?
Appreciate your help!
Hi, Tom,
Remember that the CFS begins with net income, so since the monitoring fees are included in the IS, they automatically reduce cash via the CFS. Assuming they are paid in cash, there is nothing else that needs to be tracked on the B/S.
BB
shouldn’t the defered tax liabilites be added back and not subtracted ??? because:
1)we have created the dtl at t=0 which will be unwinded or reversed over the years.
2)the tax that has been calculated on EBT included the depreciation on writeups (which means less tax has been recorded in books) but the cash tax outflow would be more because of such write ups not considered for cash taxes.
Hi, Samishka,
The change in DTL needs to be subtracted, not added, because you are paying off that liability, and because cash taxes are higher than reported taxes; reported taxes are being lowered by the depreciation from write-ups, but this does not create a tax shield because the tax basis is not stepped up in a stock sale; therefore, you must record a DTL at t=0 that must be paid off, and thus subtracted (which is what we do with liabilities that decrease) on the CFS.
BB
Thanks for the reply! Understood ,Thanks. These learning guides are helpful.
You’re welcome, Samiksha!
More of a logistical question. When working on a model like this within the allotted time, are candidates expected to start from a blank sheet from scratch or is it okay to use a template similar to this? Is it possible to set the whole model up and still be able to finish it till the last step without using any text/formatting macros? Just trying to gauge if I should be practicing using this template or a blank excel sheet. Thanks for your help!
Hi, Marco,
In case they specify a blank sheet, you want to be able to do a simple LBO on a blank sheet given just the inputs and assumptions they provide, and it is no problem to do this without the help of macros.
BB
Hi, In the Exit Valuation part, the annual monitoring fee of $2 has been added to arrive at Total Proceeds to Sponsor, for example, 326+2=328, 399+2=401. Don’t we need only this number “Total Proceeds to Sponsor” (328, 401,…) to compute the IRR? Why do the annual $2 monitoring fees appear again on the Cash Outflow/Inflows table while they have already been added to compute the Total Proceeds?
Hi Thuong – the $2 million annual monitoring fee is received by the financial sponsor each year, so we must factor in the fees collected in the prior years before the actual exit.
If we assume Year 2 is the exit year, the sponsor exit proceeds are $401 million ($399 million + $2 million). However, the $401 million neglects the $2 million collected in Year 1. Hence, the inclusion of the $2 million twice in the IRR and MOIC calculations.
Justin
Shouldn’t the total fee amount be $7? Not sure where the $8 comes from since 4+2+1 = 7.
Hi Mickey – the total financing fees is $7.50 million ($4.375mm + $1.875mm + $1.25mm), which the model rounds to $8 million because of the number formatting.
Selecting the cell range (K18:K22) and pressing Alt, H, 0 increases the number of decimal places displayed, thanks.
Hi, regarding the purchase price allocation, I understand why PP&E gets written up with 10%*book value of PP&E. However, why does the model use the allocable purchase premium to write-up intangible assets instead of the actual book value of intangible assets?
Hi, Tjark,
In the case of PP&E, it makes sense that there would be an appreciation of the assets which are recorded at original cost. But with intangible assets, they are recognizing the value of assets that never had historical cost recorded in the first place, so the estimate of % of allocable premium makes as much sense as % of book value. Either way, it is very much an estimate that should be based on prior deal experience if possible, and must be confirmed and changed later when appraisals are done.
BB
Hi Brad,
Thank you for the quick response! Understood!
You’re welcome!
Hi! Why in the calculation of cash flow from operations Deferred Tax Liabilities is subtracted? Shouldn’t it be added? (as any increase in a deferred tax asset or decrease in a deferred tax liability is subtracted and vice versa, any decrease in a deferred tax asset or increase in a deferred tax liability is added back)
Hi, Kate,
Because of the DTL created in the transaction as part of the write-up of assets, that DTL will need to be paid off over the life of that asset, and thus, as you correctly note, the decrease in the DTL as it is paid off is a cash outflow.
BB
Hi Brad,
Given we are starting the cash flow statement from net income level, and don’t have a separate line item for DTL un-wind in the income statement, it means we have assumed that DTL un-wind is part of our tax expense. But then, it also means we have already deducted the DTL un-wind already to arrive at net income. Hence, when calculating cash flow from operations, we don’t need to deduct it again. Then why have we deducted it from cash flow statement? Isn’t that double counting?
Thanks,
Mayank
Hi, Mayank,
Actually, the taxes on the income statement are reported taxes influenced by the higher D&A from the write-up, which means they are lower than the cash taxes paid. By subtracting the reduction in DTLs, we account for the additional cash taxes paid that are not accounted for in the income statement.
BB
Hello! another question, why are capitalized financing fees negative on the Balance Sheet? thanks a lot!
Hi, Kate,
Capitalized financing fees are either recorded as an asset on the B/S (as in the case with the financing fee charged for a revolver), in which case they are positive, or, more commonly, the financing fees for term loans and bonds are recorded as a contra-liability, in which case they are negative and reduce the carrying value of debt. They represent the difference between the face value of the debt that will eventually have to be paid to the investors and the actual proceeds of the debt to the borrowers, which will be lower by the amount of the fees (thus they must be negative on the liability side of the balance sheet).
BB
Hi,
I just wonder one thing. Here the assumption “Cash Free, Debt Free” means that EV=EqV. Given that, having the amount of EV, allows us to know what will be the proceeds of the shareholders that are cashed out. I understand the Sources & Uses section, and how EV + others costs of the transactions are financed. However, when I think about it, i cannot see how the new Equity has into account the 100% of the sponsor equity. We have to pay 625$ to the previous shareholders with 300$ of debt and 70$ of rollover equity (which is actually not paid, but only for illustrations purposes). So we are left with 255$ that we have to give to the former shareholders that are exiting the business. If the Sponsor contributes with 278$, we are left with 23$ free of charge that could add to the new equity + the rollover (actually only the rollover, because the 23$ go to other costs of the transaction), but i don´t see how could be added all 278$ to the new equity and still cashing out the previous shareholders.
Regards.
Hi, Dario,
Of the new equity of $278, only $255 goes to the oldco owners ($625 EV less $300 financed by debt and $70 rolled over), and the remainder goes to putting cash on the balance sheet and paying fees. The $278 is a plug, it is how much remaining funds are needed to cover all the uses.
BB
For the Interest Expense Calculation, how come the Amortization of Financing Fees wasn’t added? Wouldn’t the current totals technically be total cash interest expenses? Thanks.
Hi, Michael,
Note that amortization of financing fees is included on the income statement adjacent to interest expense, so it is in the right place. It could be reported as part of total interest expense, but this is just as good and a bit more transparent.
BB
How come amortization of financing fees was not added to the total interest expense calculation (total interest expenses of all debt tranches)? Thank you!
Hi, Michael,
Amortization of financing fees should be included in the interest expense line item on the income statement, even if it is not always included in the calculation of total interest expense in the schedules below. Note that in the I/S the amortization of financing fees is adjacent to interest expense.
BB
How can I tell if an LBO test is cash free debt free? Like when am I supposed to refund net debt in the uses vs not/ make equity value = EV? I don’t see how in the instructions it clearly states its CFDF, so I’m wondering how I’ll be able to catch that on a test.
Hi, Jane,
We typically assume CFDF. However, look for wording around what is purchased and for how much. If you are purchasing a company’s stock, then you’ll calculate equity offer value, and your uses of funds will then likely include both buyout of equity and refinancing old debt, and your sources will include excess cash. But if you are given an EBITDA multiple purchase price, then put EV in your uses and don’t worry about oldco debt and cash.
BB
Hi,
I have a question regarding the source & use of fund. Since the target (portfolio company) will be acquired on a CFDF model, then why the use of fund begin with the “purchase enterprise value” rather than the “purchase equity value”? I’m thinking if the existing net debt is completely irrelevant to the sponsors, then why raise debt & sponsor’s equity fund to cover the net debt, which is included in the total purchase enterprise value and hence the total use of fund?
–In the advanced LBO case study, the net debt is added-back, outputing the purchase enterprise value and being included in the total use of fund. I thought the inclusion is because 1) the transaction is not on a CFDF basis and the recapitalized target (portfolio company) will **refinancing** the net debt. Am I wrong?
Hi, Aries,
In a CFDF transaction, what is being purchased is the operations of the business, which is the oldco enterprise value. The seller then pays off their own debt and walks away with any excess cash, and what remains to them is the oldco equity value (EV – debt + cash). The new debt and equity is simply how the purchase is being financed.
BB
Could you explain why monitoring fees are placed below EBITDA instead of before EBITDA. When going from Gross Profit to EBITDA it looks like we’re accounting for all expenses aside from D&A. Therefore, shouldn’t we have something such as:
Gross Profit
(SG&A)
(R&D)
(Monitoring Fees)
——————–
EBITDA
Thanks.
Hi, Thad,
I suppose it is because monitoring fees are not considered part of the intrinsic operating costs of the core business, but rather costs imposed by the PE firm which may not be common to comparable companies in the sector.
BB
Got it – but if they aren’t considered a part of the operating costs of the core business, shouldn’t they be placed below operating income (EBIT)? When moving from EBITDA to EBIT we just subtract the D&A. Therefore why are the monitoring fees included – they aren’t D&A?
Hi, Thad,
Apologies, I am just now seeing this; yes, if the fees are considered an operating expense, they should be included in EBITDA if they are paid in cash, and if they are non-operating, they should be below EBIT. I am not sure why they have been placed where they are, and I can raise this question with the content creator.
BB
Thanks for the case! it was really good! Just one question/observation, why is it that if the transaction is on a CFDF basis, meaning the acquirer won’t receive the pre-transaction existing cash or debt on the target’s balance sheet, for the PPA you consider the purchase price as net from the pre-transaction cash and debt? I think there might be a disconnection between the transaction assumption and the assumption for the PPA, given that the book value being acquired on day 0 won’t be $115, but rather $165 (free of cash and debt).
Hi, Jair,
It will come out to the same in the end. If what is being allocated in the PPA is the fair market value of existing assets and liabilities, including debt and cash, then what is being valued is equity value, so the purchase price of equity is the starting point for that, and then debt and cash are included in how that value is allocated to the B/S (in order to get to goodwill), even if they will be eliminated in the CFDF transaction.
BB