What is the J-Curve?
The J-Curve illustrates the timing of the receipt of proceeds by a private equity fund’s limited partners (LPs).

The J-Curve illustrates the timing of the receipt of proceeds by a private equity fund’s limited partners (LPs).
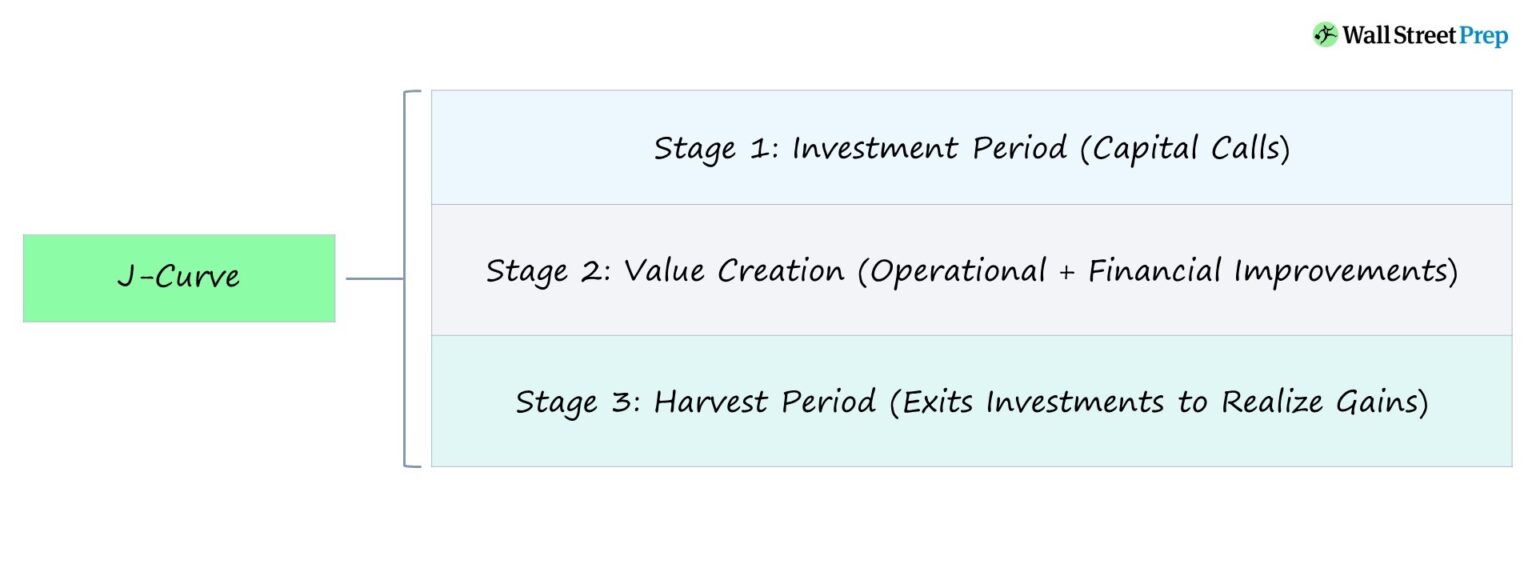
The J-curve is a graphical representation of private equity returns, where initial losses cause a dip, followed by a reversal as the firm realizes gains on its investments.
In the private equity industry, the term “J-curve” refers to the trend line that shows the timing of a fund’s lifecycle stages relative to the proceeds received by a fund’s limited partners (LPs).
The limited partners (LPs) commit capital to the private equity firm’s fund, and the firm’s general partners (GPs) invest the capital contributed on behalf of their clients.
The net realized internal rate of return (IRR) is the compounded rate of return on an investment, which in this case refers to leveraged buyouts (LBOs).
Furthermore, the graphing of the net realized IRR creates the “J” shape pattern.
The three stages of the private equity life cycle are as follows.
In the early stages of the fund’s lifespan – which typically lasts approximately 5 to 8+ years – the graphical representation of the cash inflows / (outflows) from the perspective of the LPs is a steep, downward slope.
The initial drop-off is attributable to the capital commitments from LPs and the annual management fee paid to the PE firm.
Both the initial capital commitments and the management fees represent outflows of cash.
The magnitude of the outflow will reduce over time as more capital commitments occur, meaning that the fund has less capital available to call, while the management fees remain around a fixed range.
The average holding period in private equity is five to eight years, so as the fund exits its portfolio companies, the downward curve begins to reverse course and trend upward.
The curve trending upward implies the returns to the LPs are now realized.
The three most common exit strategies for private equity firms are the following:
Level up your career with the world’s most recognized private equity investing program. Enrollment is open for the upcoming cohort.
If the returns to a fund’s limited partners were to be graphed, the shape of the returns would be in the shape of a “J”, as the graph below depicts.
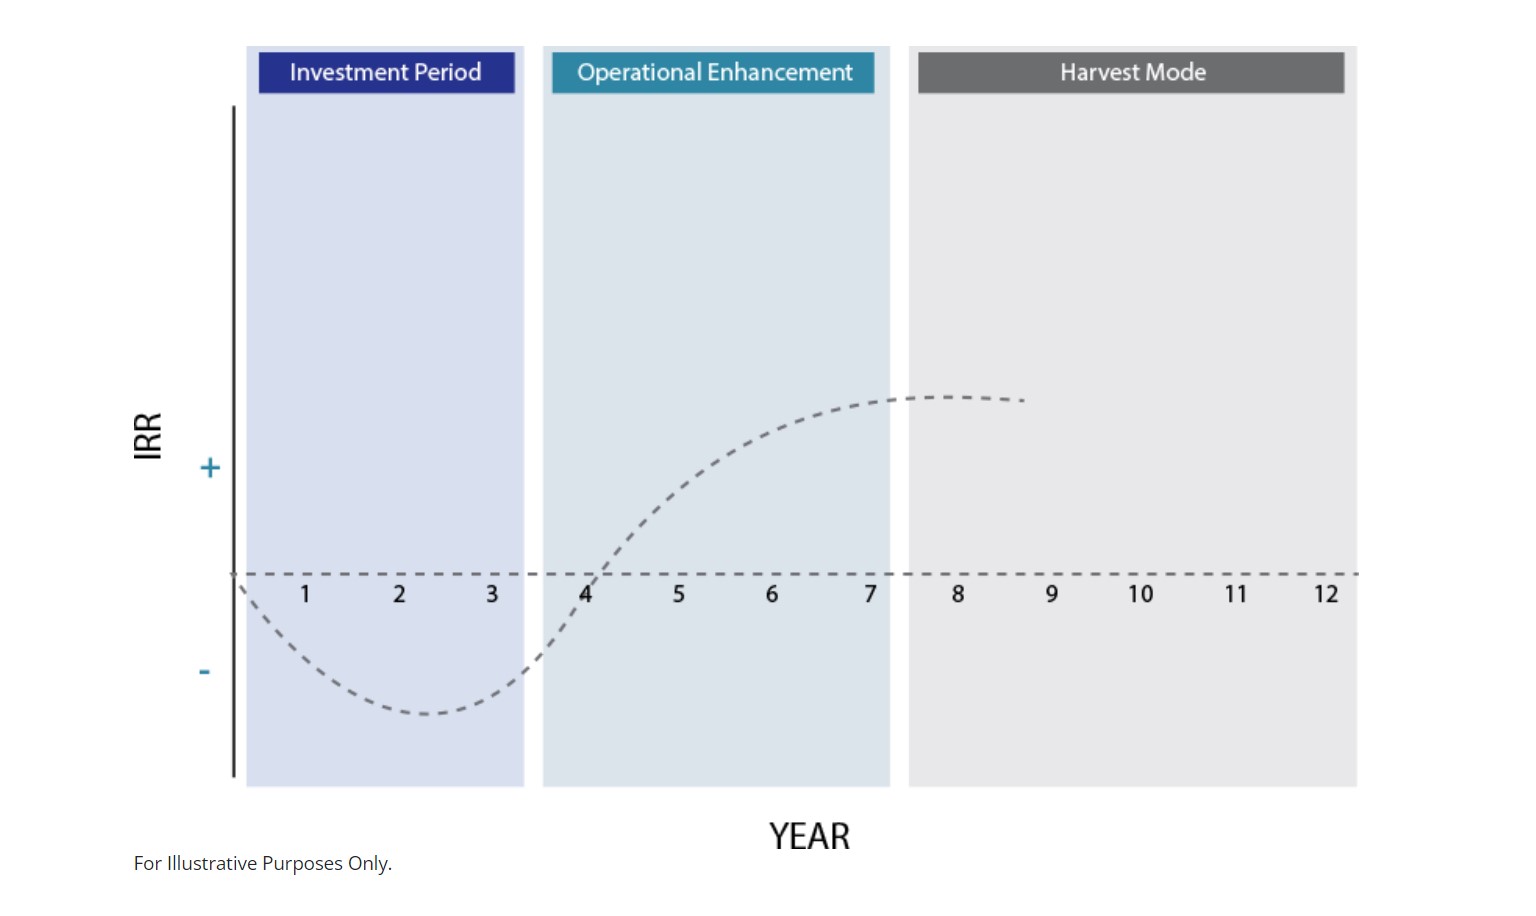
J-Curve Graph (Source: Crystal Funds)


No comments yet.