What is the Paper LBO?
The Paper LBO is a common exercise completed during the private equity interview process, for which we’ll provide an example step-by-step practice test along with a walkthrough of each of the core concepts.



The Paper LBO is a common exercise completed during the private equity interview process, for which we’ll provide an example step-by-step practice test along with a walkthrough of each of the core concepts.
Starting off, the interviewee typically receives a “prompt” – a short description containing a situational overview and certain financial data for a hypothetical company contemplating an LBO.
The interviewee will be given a pen and paper and between 5 and 10 minutes to arrive at the implied internal rate of return (IRR) and multiple on invested capital (MOIC) based on the information presented in the prompt.
For practically all private equity interviews, do not expect the interviewer to hand you a calculator, because only a pen and paper will be provided. In fact, the entire paper LBO test could even be a verbal discussion with the interviewer.
Therefore, practice completing mental math in your head until you are comfortable performing shorthand calculations, even under timed pressure.
Most private equity firms – or, in some cases, even headhunters (i.e. the “gatekeepers” of the industry) – use the paper LBO test as a method to quickly vet a potential candidate in the early stages of the PE interview process.
As candidates progress to subsequent rounds, private equity firms often ask interviewees to complete a far more detailed LBO modeling test, or perhaps even a take-home case study.
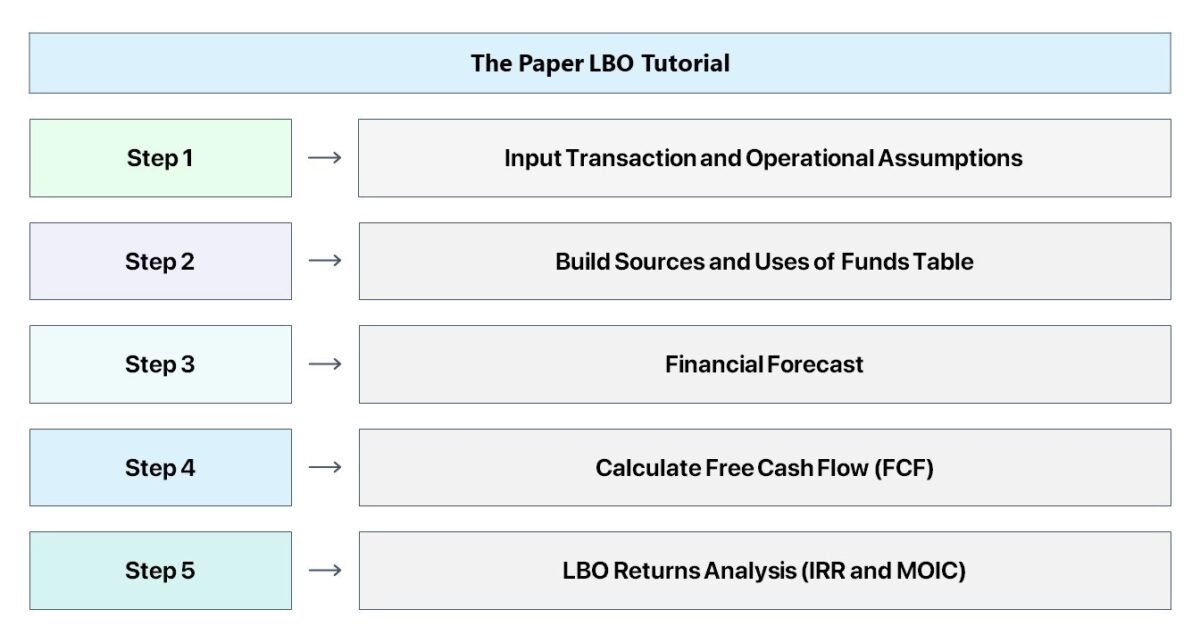
Before we begin, the steps to complete a paper LBO test are outlined below.
Level up your career with the world’s most recognized private equity investing program. Enrollment is open for the upcoming cohort.
To get started, the following is an example prompt for our practice paper LBO test.
Paper LBO Prompt Example
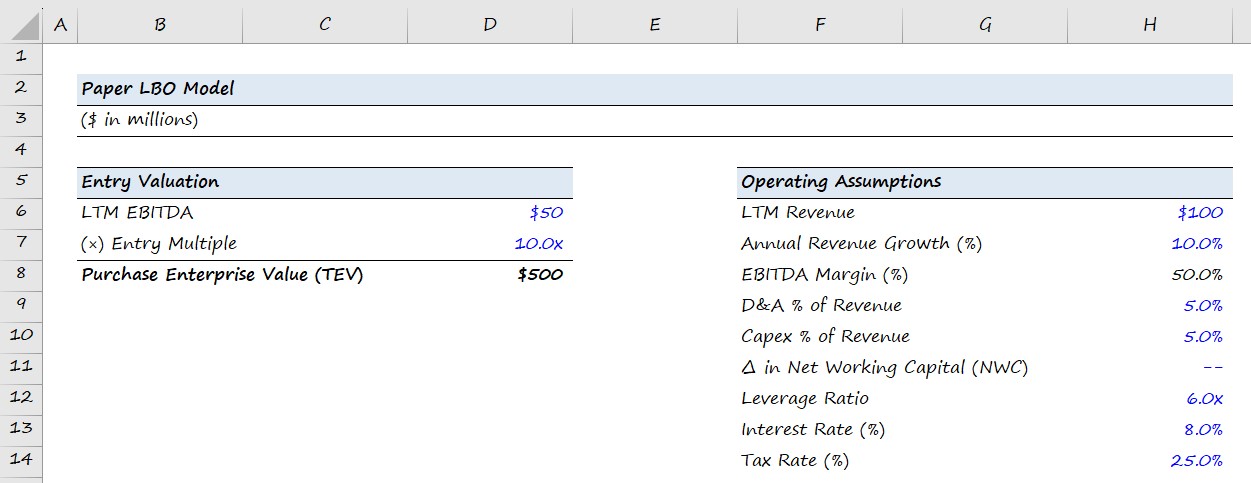
JoeCo, a coffee company, has generated $100mm in last twelve months (LTM) revenue and this figure is expected to increase by a growth rate of 10% annually into the foreseeable future.
JoeCo's LTM EBITDA was $50mm, and its EBITDA margin should remain unchanged in the years ahead.
Based upon management guidance, JoeCo's depreciation and amortization (D&A) and its capital expenditures (Capex) is expected to be 5.0% as a percentage of revenue, with no change in net working capital (NWC) and the effective tax rate fixed at 25%.
If a PE firm acquired JoeCo for 10.0x EBITDA and exited at the same multiple five years later, what is the implied internal rate of return (IRR) and multiple on invested capital (MOIC)?
For the financing of the LBO, assume the initial leverage ratio used to fund the purchase was 6.0x EBITDA and that the debt carries an interest rate of 8.0% with no required principal amortization until maturity, at which debt is fully paid down upon exit.

The paper LBO exercise is an essential part of understanding leveraged buyouts, but it typically relies on oversimplified assumptions and manual calculations. Artificial intelligence revolutionizes this process by simulating complex, real-world transaction scenarios, stress-testing assumptions, and instantly generating multiple investment outcomes. Recognizing the need for more robust analytical training, Wall Street Prep and Columbia Business School Executive Education developed the AI for Business & Finance Certificate Program to help professionals confidently approach private equity deals using AI-driven simulations and data-rich financial modeling.
Fill out the following form to access the paper LBO template, which we recommend using to confirm your calculations are correct.
However, it is rather unlikely that you'll receive a laptop with Excel in the interview setting, nor a calculator.
Therefore, print out the 1st sheet to solve this problem set and complete the exercise using pen and paper to practice under the actual testing conditions.


The first step is to lay out the operational assumptions that were provided in the prompt and to calculate the total amount paid to purchase the target company.
In the next step, we will build the Sources and Uses table, which will be a direct function of the transaction structure assumptions. In this particular example, the purchase multiple used was 10.0x EBITDA, and the deal was funded using 6.0x leverage.
More specifically, the objective of this section is to figure out the exact cost of purchasing the company, and the amount of debt and equity financing required to complete the acquisition.
The total amount of debt used will be calculated as a multiple of LTM EBITDA, while the equity contribution by the private equity investor is the remaining amount required to “plug” the gap and make both sides of the table balance.
Ultimately, the main goal of an LBO model is to determine how much the firm’s equity investment has grown. To do so, we need to first calculate the size of the initial equity check by the financial sponsor.
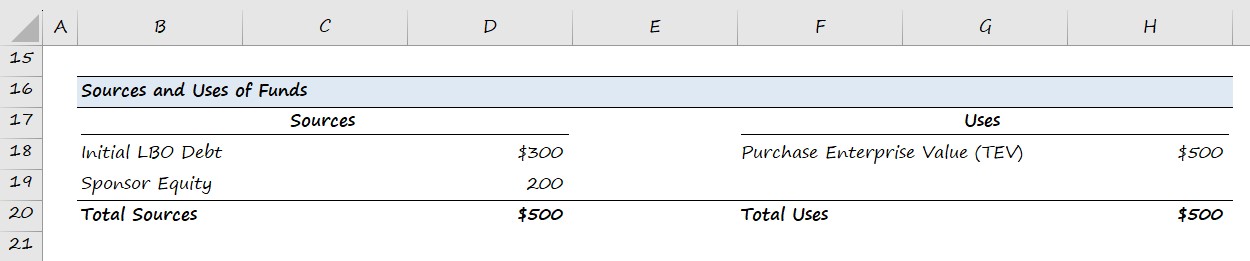
In a real LBO model, the Uses of Funds Section will likely include transaction and financing fees, among other uses. In addition, other more complex concepts like management rollover will be reflected in both the sources and uses of funds.
However, these nuances are unlikely to show up here, so unless you were explicitly provided with additional data in the prompt, focus exclusively on the data provided.
Since we have completed the Sources and Uses of Funds section of our LBO model, we will shift to forecasting the financials of JoeCo from revenue to net income (the “bottom line”).
The operational assumptions that will drive the projections were provided in the first step.
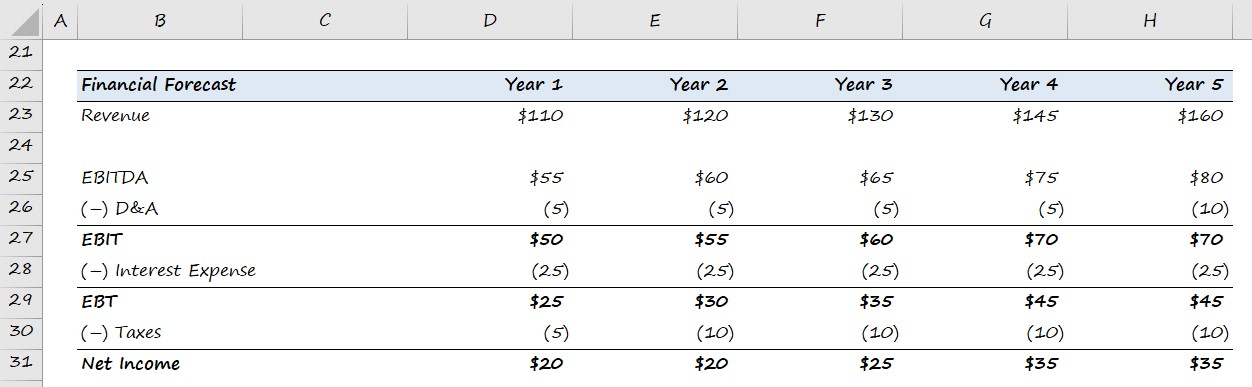
Note: In the context of a private equity interview, it is reasonable to round your calculations to the nearest whole number for convenience, i.e. round the figures to the nearest 5 or 10 to simplify the math.
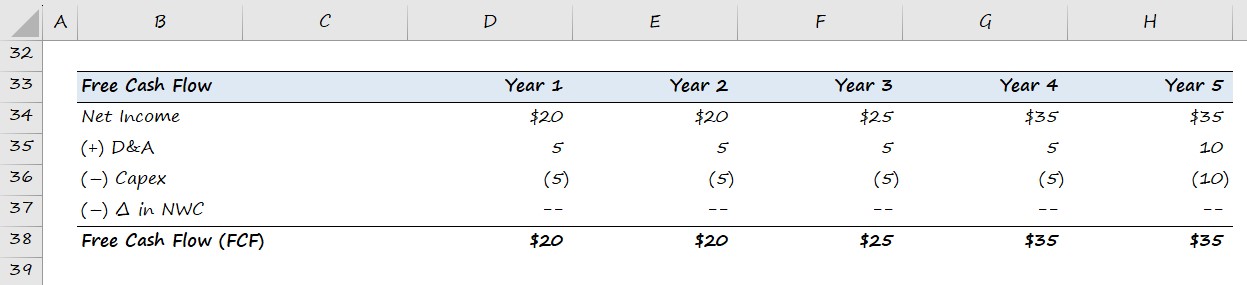
With our financial forecast complete, we can now calculate JoeCo’s free cash flows (FCFs) throughout the five-year holding period.
The FCF generation of an LBO target determines the amount of debt that can be paid down during the holding period. However, our prompt mentioned assumes no principal paydown.
In the last step, we will assess the returns of the investment using the multiple on invested capital (MOIC), or “cash-on-cash return”, and the internal rate of return (IRR).
Earlier, the prompt stated the PE firm exited the investment at the same multiple as the entry multiple (i.e. no “multiple expansion”).
Since you will likely not have access to a calculator, calculating the IRR requires some “back-of-the-envelope” math.
The standard investment holding period assumption is 5 years, so we recommend memorizing the IRR approximations based on the most common MOIC returns.
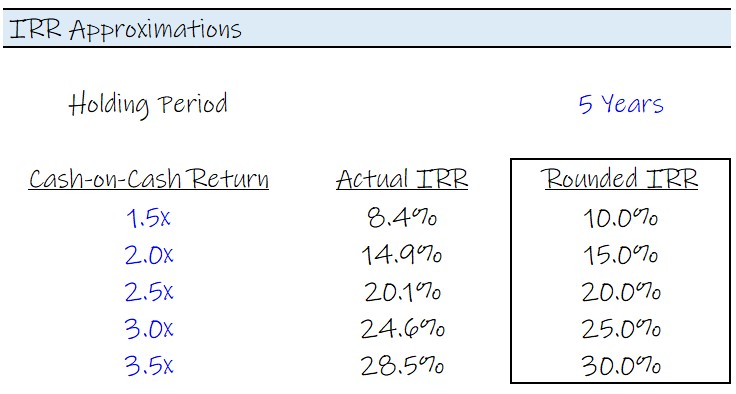
Forgot your IRR approximations?
No problem — in most cases, the return should be easy to approximate under the Rule of 72, which estimates the time that it takes to double an investment.
The approximate number of years necessary for the investment value to double in size can be determined by dividing 72 by the rate of return.
For example, over a 5-year horizon, the approximate IRR required to double the investment is ~15%.
There's also the lesser-known Rule of 115, which estimates the time it takes to triple an investment. Here, the formula takes 115 and divides it by the rate of return.
If you are facing difficulty estimating the internal rate of return (IRR), it is likely that a mistake was made in one of the prior steps.
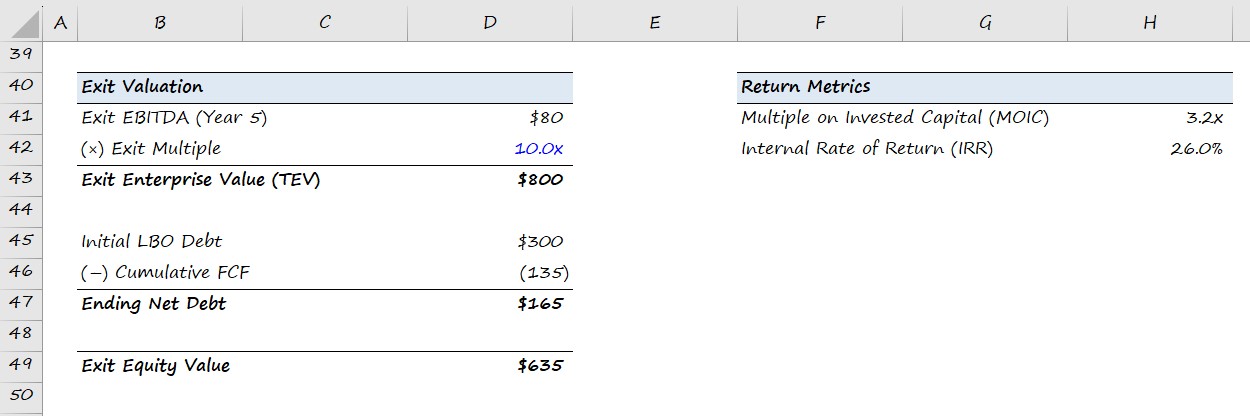
The implied MOIC in our hypothetical LBO scenario is around 3.2x, which we calculated by dividing the exit equity value by the initial sponsor equity contribution.
Using either the table above or the Rule of 72 and 115, we can estimate the internal rate of return (IRR) on our hypothetical LBO investment to be approximately ~26%.




Wouldn’t you acquire the company on an NTM EBITDA number?
Hi, Art,
Projected EBITDA is the norm for Comps analysis, to be sure, but LBOs usually work off of LTM EBITDA, that way the purchase multiple and leverage multiple can reference the same number, and leverage multiples almost always use historical numbers, because they are actual numbers.
Brad
I just completed this paper LBO – Thank you. In how long should this paper LBO need to have been completed?
Hi, Joseph,
The article says you should be able to arrive at the IRR in 5-10 minutes, so use that as a guide.
BB
Does this get you to levered or unlevered FCF?
Hi, Allison,
Actually, it’s not strictly unlevered or levered FCF: not unlevered because we begin with net income rather than EBIT, and not levered because it is FCF before debt principal payments (levered FCF includes debt borrowing and payments); the way we should think about it is the FCF that is available to pay down debt but after interest has already been paid (because interest expense is included in net income).
BB
It gets you to FCF
Hi, Antoine,
You are correct, but as I explained to Allison, FCF is used to mean different things in different contexts, and this calculation of FCF differs from both Unlevered and Levered FCF as we would use in a DCF.
BB
Hey, why did the D&A and Cap Ex not increase as a % of the increasing revenue? Why did the real figures stay constant at 5?
Hi Sarah – the model is rounding each figure to the nearest multiple of five, thanks.
Why is the IRR 26.0%? If I use the rule of 115, I get 23% (115/5=0.23)
Hi, Kate,
Rules like that are only approximations, and in the case of the rule of 115, the number of years it takes to triple in value given the rate of return. But note here that it more than triples in value (3.2x), so the rate of return will be higher than 23%.
BB
How do you find existing equity returned based on implied purchase multiple?
Hi, William,
Do you mean how to calculate the IRR to equity at a range of purchase multiples, or do you mean calculating the implied purchase multiple at a given IRR?
BB
Hey, So for the EBITDA LTM it’s the EBIT LTM – D&A LTM ?
Hi, Gabriel,
LTM EBITDA would be LTM EBIT + LTM D&A.
BB
What is the cash on cash return to get the 26%?
Hi, Prince,
The cash on cash for a 26% IRR, all other assumptions in place, is 3.2x.
BB
You can also estimate the IRR by using the Rule of 40M, where the IRR is [40 * M / No. of Years].
It works for MOIC and holding years that are not whole numbers.
In the example above (3.2x in 5 years), the IRR would be 40*3.2/5 >> 26%.
It works without memorizing a table of numbers.
Find out more: https://www.youtube.com/watch?v=aCHFgOCX1hU
Thanks for sharing this approach.
BB
Why isn’t cash taxes accounted for in the FCF walk?
Hi, AJ,
Cash taxes are very important, and a more advanced LBO model should have them. In theory, if you assume that DTAs and DTLs grow with NWC, and we account for the change in NWC and other non-current assets and liabilities in the cash flows, then we are accounting for cash taxes. However, it would be better to build a schedule that explicitly accounts for items like tax-deductible D&A, interest expense carryforward, and net operating loss carryforwards.
BB
Hi – why isn’t the FCF :
EBITDA – (Capex) – (Interest) – (Taxes)?
Thank you!
Hi, John,
That calculation would work if you also included the change in NWC. By starting with net income, we already include the impact of interest and taxes.
BB
If Revenue is growing by 10% shouldnt year 2 revenue be 121 ?
Hi, Riya,
Good question, it should be $121, and it looks like the remaining projections are not following 10% precisely.
BB