Exit to Learning Dashboard

Basics of an LBO Model

Step-by-Step Guide to Understanding the Basics of LBO Modeling

Jul. 19, 2026
6m Read
Matan Feldman
Written ByMatan Feldman
Andrew Federico
Reviewed ByAndrew Federico
UpdatedJul. 19, 2026
Read Time6m

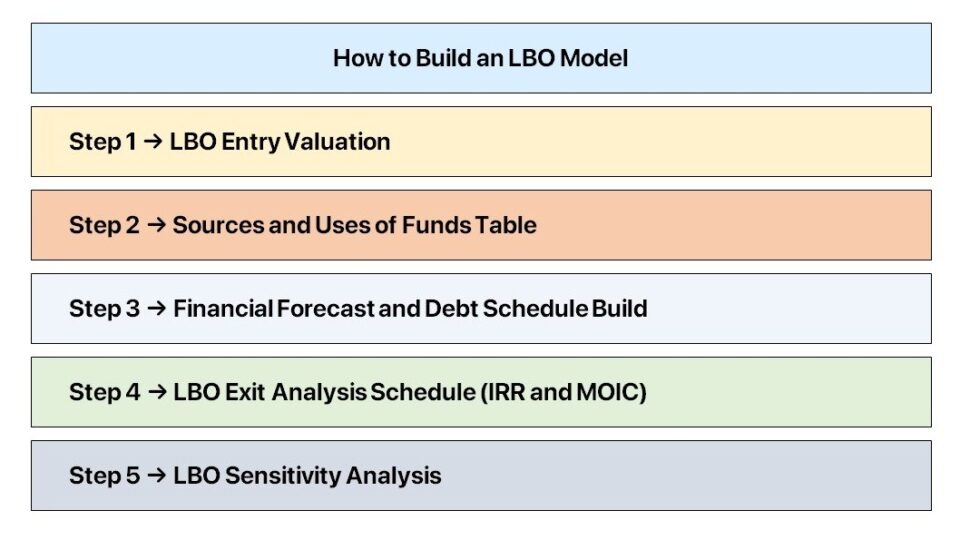
How to Build an LBO Model

LBO Modeling is a method to measure the implied returns on a leveraged buyout transaction (LBO), which is a specialized type of acquisition where a substantial percentage of the purchase price is funded using debt.

Understanding the basics of LBO modeling in Excel is necessary to perform well in private equity (PE) interviews, LBO modeling tests, and most importantly, on the job.

LBO Model Steps

Basics of an LBO Model: Private Equity Training Tutorial

An LBO model estimates the implied returns from the buyout of a target company by a financial sponsor, or private equity firm, in which a significant portion of the purchase price is funded with debt capital.

Following the leveraged buyout (LBO), the financial sponsor operates the post-LBO company for around five to seven years – with the free cash flows (FCFs) of the company used to pay down more debt each year.

From the perspective of a private equity (PE) firm, the following pieces of information must be derived from an LBO model to analyze a potential investment opportunity.

  1. Entry Valuation ➝ Pre-LBO Entry Equity Value and Enterprise Value
  2. Default Risk ➝ Credit Ratios (e.g. Leverage Ratio, Interest Coverage Ratio, Solvency Ratio)
  3. Free Cash Flow (FCF) ➝ Cumulative Debt Paid Down (and Net Debt in Exit Years)
  4. Exit Valuation ➝ Post-LBO Exit Equity Value and Enterprise Value of the Target Company
  5. LBO Return Metrics ➝ Internal Rate of Return (IRR) and Multiple on Invested Capital (MOIC)

LBO Modeling Infographic (Cheat Sheet)

Fill out the form below to access our infographic on LBO modeling.

The infographic can serve as a quick reference “cheat sheet” during the recruiting process.

LBO Modeling Cheat Sheet InfographicDownload Icon

LBO Modeling "Cheat Sheet" | File Download Form

Step 1. LBO Entry Valuation

Suppose you're currently recruiting for a position to join a private equity firm (PE), and the interviewer sitting across from you asked the following question:

Q. “Walk me through an LBO model?”

So, the first step to building an LBO model is to calculate the implied entry valuation based on an entry multiple assumption.

To calculate the enterprise value at entry, the entry multiple is multiplied by either the last twelve months (LTM) EBITDA of the target company or the next twelve months (NTM) EBITDA.

Entry Valuation = Purchase EBITDA × Entry Multiple

If we assume a “cash-free, debt-free (CFDF)” transaction, the enterprise value is the purchase price of the LBO target.

Step 2. Sources and Uses of Funds Table

All else being equal, the lower the required upfront equity contribution from the financial sponsor, the higher the returns.

The next step is to create the sources & uses schedule, which approximates:

  • Uses Side ➝ The total amount of capital required to complete the acquisition
  • Sources Side ➝ The specific details on how the firm plans to come up with the required funding

The majority of the “Uses” side will be because of the buyout of the target's existing equity. But in addition, other transaction assumptions are made, such as:

  • Transaction Costs ➝ M&A Advisory Fees, Legal Fees, and Consulting Fees
  • Financing Fees ➝ Debt Issuance Costs (Underwriting Fees)

From here, numerous financing assumptions are made regarding the “Sources” of funds, such as the:

  • Total Debt Financing (i.e. Leverage Multiple, Senior Leverage Multiple)
  • Lending Terms for Each Debt Tranche (e.g. Interest Rate Pricing, Required Amortization, Cash Sweep)
  • Management Rollover Assumptions
  • Cash to B/S (i.e. “Excess Cash”)

The remaining amount for the Sources and Uses to be equal is the equity contribution by the financial sponsor (i.e. the equity investment to “plug” the remaining funds required).

In the sources and uses of funds table, the total sources must equate to the total uses (Total Uses = Total Sources), akin to the fundamental balance sheet equation.

Where:

  • Total Uses ➝ Purchase Enterprise Value (TEV), Transaction Fees, Financing Fees
  • Total Sources ➝ Debt Capital (Senior Debt, Subordinated Debt), Mezzanine Financing, Preferred Stock, Sponsor Equity Contribution

Continue Reading Below
The Wharton Online and Wall Street Prep Private Equity Certificate Program

Level up your career with the world’s most recognized private equity investing program. Enrollment is open for the upcoming cohort.

Enroll Today

Step 3. Financial Forecast and Debt Schedule

In the subsequent step, the company's financial performance is projected for a minimum five-year time horizon, which is the standard holding period assumed on the job.

A complete 3-statement model is required for the LBO assumptions to properly impact the income statement and cash flow statement (i.e. the free cash flow build).

The debt schedule is used to closely track the following components:

  • Revolver Drawdown / (Paydown)
  • Principal Amortization (i.e. Mandatory Repayment)
  • Cash Sweep (i.e. Optional Prepayment)
  • Interest Expense Schedule

For the LBO model to accurately calculate the returns, the debt schedule must adjust each debt tranche accordingly to determine the amount of debt paid down in each period (and the ending balances).

Step 4. LBO Exit Returns Schedule (IRR and MOIC)

Next, assumptions regarding the exit – i.e. the realization of the investment by the financial sponsor – are necessary, most notably the exit EV/EBITDA multiple.

EV/EBITDA = Enterprise Value ÷ EBITDA

In practice, the conservative assumption is to set the exit multiple equal to the purchase multiple.

The exit enterprise value is determined by multiplying the exit multiple assumption by the exit year EBITDA.

Exit Enterprise Value (TEV) = Exit Multiple × Exit Year EBITDA

In the next step, the remaining net debt on the balance sheet as of the presumed date of exit can be deducted to arrive at the exit equity value.

Exit Equity Value = Exit Enterprise Value (TEV) – Net Debt

After calculating the exit equity value because of the sponsor, the key LBO return metrics – i.e. the internal rate of return (IRR) and multiple of money (MoM) – can be estimated.

The internal rate of return (IRR) is the annualized yield on an investment, with the effects of compounding factored.

Internal Rate of Return (IRR) = (Ending Value ÷ Current Value)^(1 ÷ Number of Periods) – 1
The multiple on invested capital (MOIC) is the ratio between the proceeds retrieved from an investment and the original investment.
Multiple on Invested Capital (MOIC) = Total Cash Inflows ÷ Total Cash Outflows

Step 5. LBO Sensitivity Analysis Table

In the final step, different operating cases must be considered—e.g. a “Base Case”, “Upside Case”, and a “Downside Case”—along with sensitivity analysis to assess how adjusting certain assumptions impacts the implied returns from the LBO model.

  • Base Case ➝ The outcome with the highest probability of occurrence.
  • Upside Case ➝ The most optimistic outcome, where performance far exceeds expectations.
  • Downside Case ➝ The most pessimistic outcome, in which the performance of the acquisition target fails to meet expectations.

The downside case is of particular importance in private equity (LBO) investing, because of the debt load placed on the capital structure of the target post-LBO.

In conclusion, the entry multiple and exit multiples are usually the two assumptions with the most impact on returns, followed by the leverage multiple and other operational characteristics, such as revenue growth and profit margins.

Practice LBO Modeling Tests

Since we've covered the core components that underpin an LBO model, including the intuition behind each step, here are a couple of practical LBO modeling tests to help prepare for private equity recruiting, ordered by ascending difficulty.

  1. Paper LBO Test
  2. Basic LBO Modeling Test
  3. Standard LBO Modeling Test
  4. Advanced LBO Modeling Test
Frequently Asked Questions
What is a cash sweep in an LBO?
A cash sweep is a provision in an LBO's debt agreement requiring the company to use its excess free cash flow to prepay debt early, on top of any mandatory scheduled payments. Once operating expenses, interest, and required amortization are covered, remaining cash gets applied straight to the principal balance, typically starting with the most senior debt tranche first. This accelerates deleveraging, lowers future interest expense, and increases the sponsor's equity value even if the company's EBITDA never grows.
What's the difference between senior debt and subordinated (mezzanine) debt?
Senior debt gets repaid first in the event of default and typically carries a lower interest rate because it's backed by collateral and holds the top position in the capital structure. Subordinated debt, often called mezzanine financing, sits below senior debt in repayment priority, which makes it riskier for lenders and results in a meaningfully higher interest rate, sometimes with added upside like warrants or an equity kicker. LBOs often blend both types to reduce the amount of equity a sponsor needs to put in.
What is a dividend recapitalization, and how does it affect LBO returns?
A dividend recapitalization is when a private equity firm has the company it owns take on new debt in order to pay a cash dividend back to the sponsor, effectively returning some of the original investment before the company is even sold. This can boost the fund's overall return by getting cash back early, but it also increases the company's leverage and interest burden, which raises risk and can shrink the equity cushion available at exit if performance weakens afterward.
Why do private equity firms typically hold companies for five to seven years?
Private equity firms hold companies for five to seven years mainly because that's roughly how long it takes to meaningfully grow EBITDA, pay down a significant chunk of acquisition debt, and improve operations enough to justify a profitable exit. Selling too early often means the business hasn't had time to show the operational improvements the fund is banking on, while holding too long ties up capital that could be returned to investors and redeployed into new deals.
What happens to LBO returns if a company can't pay down debt as planned?
If a company underperforms and generates less free cash flow than projected, it pays down less debt than modeled, which leaves more net debt on the balance sheet at exit and directly reduces the equity value the sponsor walks away with. In more severe cases, the company may need to draw on a revolver or renegotiate loan terms with lenders, and if performance is bad enough, missed debt payments can trigger a covenant breach or push the business toward default.
Is EBITDA a reliable stand-in for cash flow in an LBO?
Not entirely. EBITDA is a useful shorthand for a company's operating profitability, but it ignores capital expenditures, changes in working capital, and cash taxes, all of which reduce the actual cash available to service debt. A company can have strong EBITDA and still struggle to make debt payments if it requires heavy reinvestment or ties up a lot of cash in inventory and receivables, which is why LBO models build a full free cash flow forecast rather than relying on EBITDA alone.
What is an interest coverage ratio, and why does it matter in an LBO?
The interest coverage ratio measures how many times over a company's operating earnings can cover its interest payments, calculated as EBITDA divided by interest expense. Lenders use this ratio to gauge how much cushion a company has before it risks defaulting on its debt, and a ratio that's too low can restrict how much leverage a private equity firm is able to use in the first place. A shrinking interest coverage ratio during the holding period is also an early warning sign that a portfolio company is under financial strain.
What's the difference between an LBO model and a DCF model?
An LBO model estimates the return a private equity firm would earn on a leveraged acquisition, driven primarily by debt paydown, EBITDA growth, and the exit multiple. A DCF model, by contrast, estimates a company's intrinsic value by discounting its projected future cash flows back to the present, independent of how the deal might be financed. In short, a DCF answers "what is this company worth," while an LBO model answers "what return could an investor realistically earn buying it with debt."
Can a public company be taken private through a leveraged buyout?
Yes, this is called a take-private transaction, where a private equity firm acquires a publicly traded company, delists its shares from the stock exchange, and finances the purchase with a mix of debt and equity just like any other LBO. Public-to-private deals often involve a premium paid to shareholders over the current share price and can face more regulatory and shareholder-approval hurdles than acquiring a private company, but the underlying LBO mechanics of debt paydown and exit returns work the same way.
What are the most common exit strategies for a private equity-owned company?
The most common exit routes are a sale to a strategic buyer, a secondary buyout where another private equity firm buys the company, and an initial public offering that takes the company public. Some sponsors also use a dividend recapitalization to return cash without fully exiting, holding the investment longer while still realizing partial proceeds. The choice usually comes down to which option maximizes value at the time, along with market conditions and how much further growth the business has left to offer a new buyer.
Comments

No comments yet.