What is a 3-Statement Model?
The 3-Statement Model is an integrated model used to forecast the income statement, balance sheet, and cash flow statement of a company for purposes of projecting its forward-looking financial performance.



The 3-Statement Model is an integrated model used to forecast the income statement, balance sheet, and cash flow statement of a company for purposes of projecting its forward-looking financial performance.
While accounting enables us to understand a company’s historical financial statements, forecasting those financial statements enables us to explore how a company will perform under various assumptions, and visualize how a company’s decisions interact to impact the bottom line in the future.
A well-built 3-statement financial model helps insiders (corporate development professionals, FP&A professionals) and outsiders (institutional investors, sell side equity research, investment bankers and private equity) see how the various activities of a firm work together, making it easier to see how decisions impact the overall performance of a business.
It is critical that a complex financial model like the 3-statement model adheres to consistent best practices. This makes both the task of modeling and auditing other people's models far more transparent and useful.
We have written an Ultimate Guide to Financial Modeling Best Practices, but we’ll summarize some key takeaways here.
The most basic formatting rules are:
Color-code your model so that inputs are blue and formulas are black. The table below shows other color-coding best practices:
| Type of cells | Color |
|---|---|
| Hard-coded numbers (inputs) | Blue |
| Formulas (calculations) | Black |
| Links to other worksheets | Green |
| Links to other files | Red |
| Links to data providers (i.e. CIQ, FactSet) | Dark Red |
Format data consistently (for example, keep consistent unit scale, use 1 decimal place for numbers, 2 for per share data, 3 for share count).
Avoid partial inputs that commingle cell references with hard numbers.
Maintain standard column widths and consistent header labels.
One of the first decisions in building a 3-statement financial model concerns the periodicity of the model.
Namely, what are the shortest periods the model will be partitioned into annual, quarterly, monthly, or weekly?
This will typically be determined by the purpose of the 3-statement financial model.
Below we've outlined some general rules of thumb:
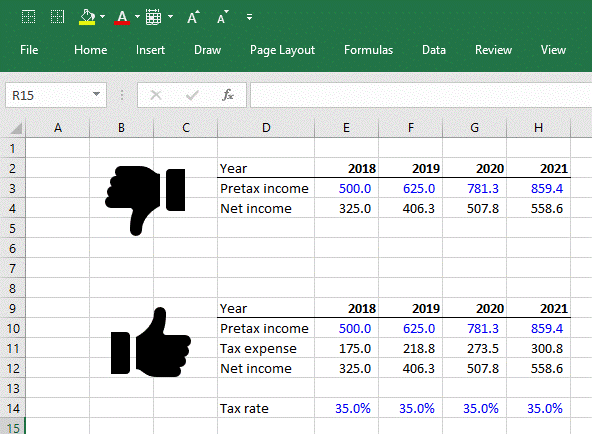
When models get large, adhering to a strict structure is critical.
The key rules of thumb to follow include the following:
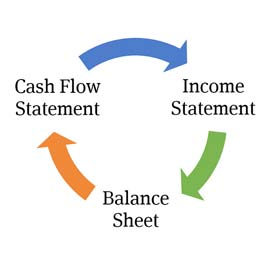
3-statement models include a variety of schedules and outputs, but the core elements of a 3-statement model are, as you may have guessed, the income statement, balance sheet, and cash flow statement.
A key feature of an effective model is that it is "integrated," which simply means that the 3-statement models are modeled in a way that accurately captures the relationship and linkages between the various line items across the financial statements.
An integrated model is powerful because it enables the user to change an assumption in one part of the model to see how it impacts all other parts of the model consistently and accurately.

Building precise, interconnected 3-statement models is a core skill in finance, yet it often requires hours of meticulous, manual work. Artificial intelligence streamlines this process by automating data integration, validating assumptions across statements in real time, and flagging inconsistencies that might otherwise go unnoticed. Wall Street Prep and Columbia Business School Executive Education launched the AI for Business & Finance Certificate Program to help professionals adopt AI-driven workflows and enhance strategic analysis across the income statement, balance sheet, and cash flow.
Before firing up Excel to begin building the model, analysts need to gather the relevant reports and disclosures.
At a minimum, they will need to gather the company’s latest SEC filings, press releases and possibly equity research reports.
Data is much harder to find for private companies than for public companies, and reporting requirements vary across countries. We have compiled a guide on gathering historical data needed for financial modeling here.
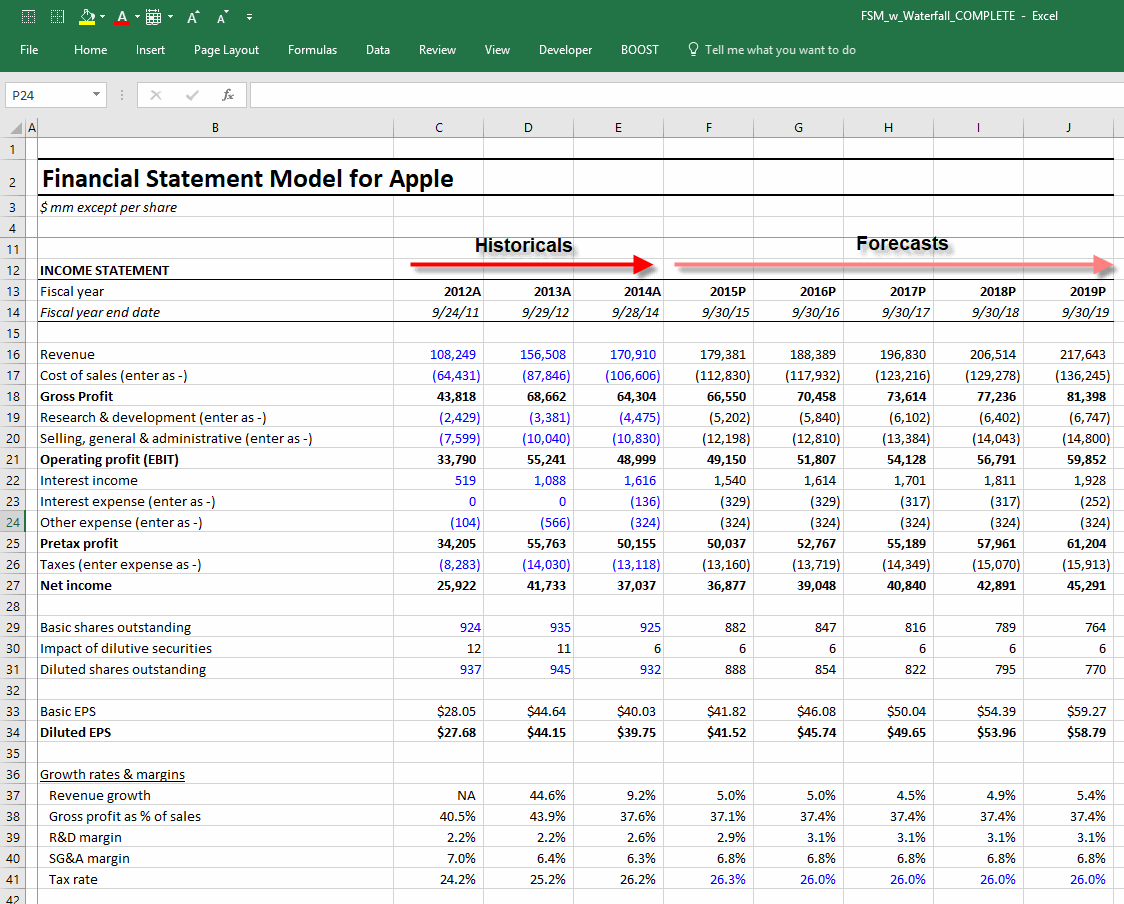
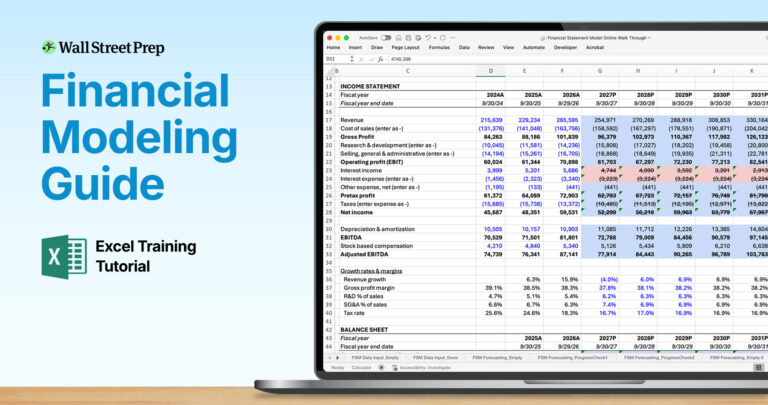
The income statement illustrates a company's profitability. All three statements are presented from left to right, with at least 3 years of historical results present to provide historical rations and growth rates on which forecasts are based.
Inputting the historical income statement data is the first step in building a 3-statement financial model.
The process involves either manual data entry from the given company's 10K or press release or the use of an Excel plugin such as FactSet or Capital IQ to drop historical data directly into Excel.
Forecasting typically begins with a revenue forecast followed by the forecasting of various expenses. The net result is a forecast of the company's income and earnings per share. The income statement covers a specified period such as a quarter or year.
For more on this, check out the complete income statement forecasting guide.
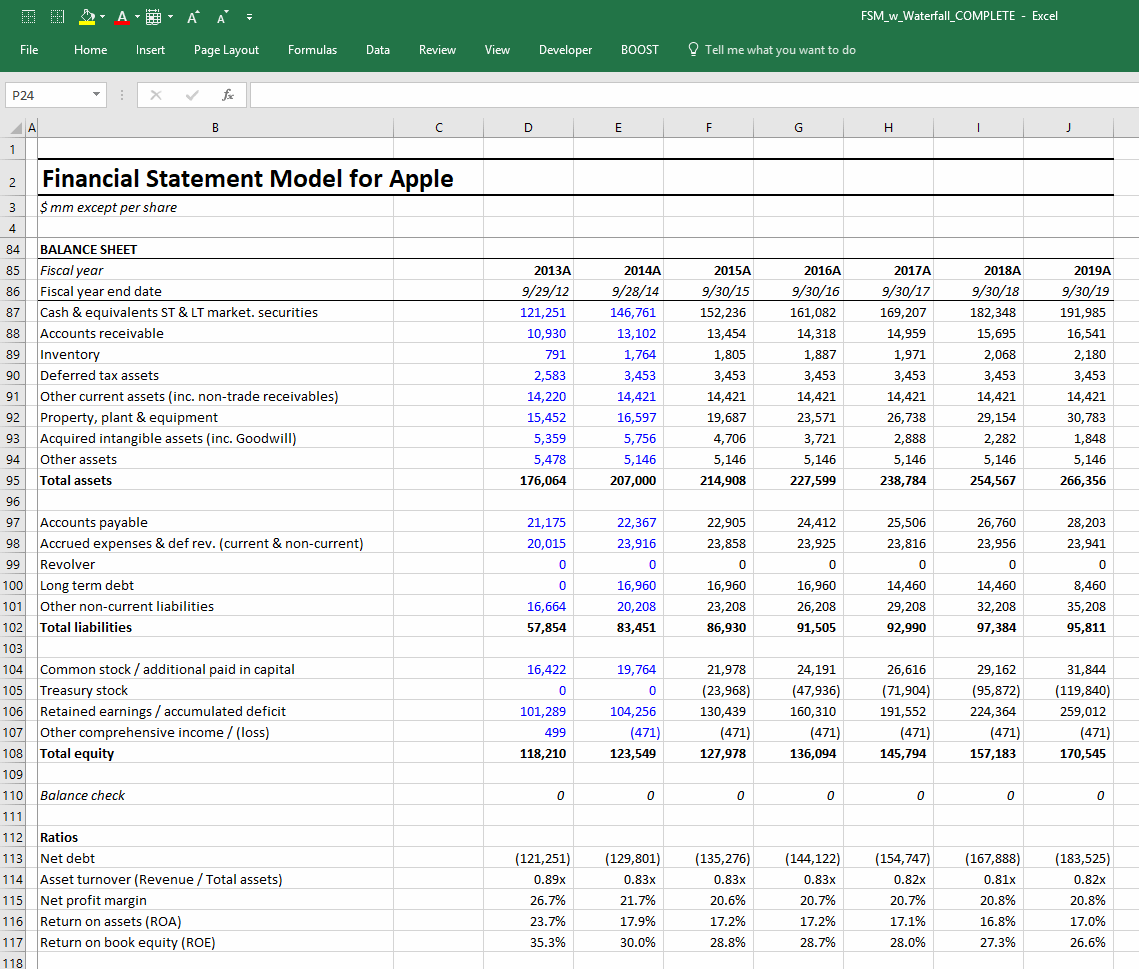
Unlike the income statement, which shows operating results over a period of time (a year or a quarter), the balance sheet is a snapshot of the company at the end of the reporting period. The balance sheet shows the company’s resources (assets) and funding for those resources (liabilities and shareholder’s equity). Inputting historical balance sheet data is similar to inputting data in the income statement. The data is inputted either manually or through an Excel plugin.
In large part, the balance sheet is driven by the operating assumptions we make on the income statement. Revenues drive the operating assumptions in the income statement, and this continues to hold true in the balance sheet: Revenue and operating forecasts drive working capital items, capital expenditures, and a variety of other items. Think of the income statement as the horse and the balance sheet as the carriage. The income statement assumptions are driving the balance sheet forecasts.
Click here for a complete guide to forecasting the balance sheet
The final core element of the 3-statement model is the cash flow statement. Unlike on the income statement or the balance sheet, you aren't actually forecasting anything explicitly on the cash flow statement and it isn’t necessary to input historical cash flow statement results before forecasting. That’s because the cash flow statement is a pure reconciliation of the year-over-year changes in the balance sheet.
Every individual line item on the cash flow statement should be referenced from elsewhere in the model (it should not be hardcoded) as it is a reconciliation. Constructing the cash flow statement correctly is critical to getting the balance sheet to balance.
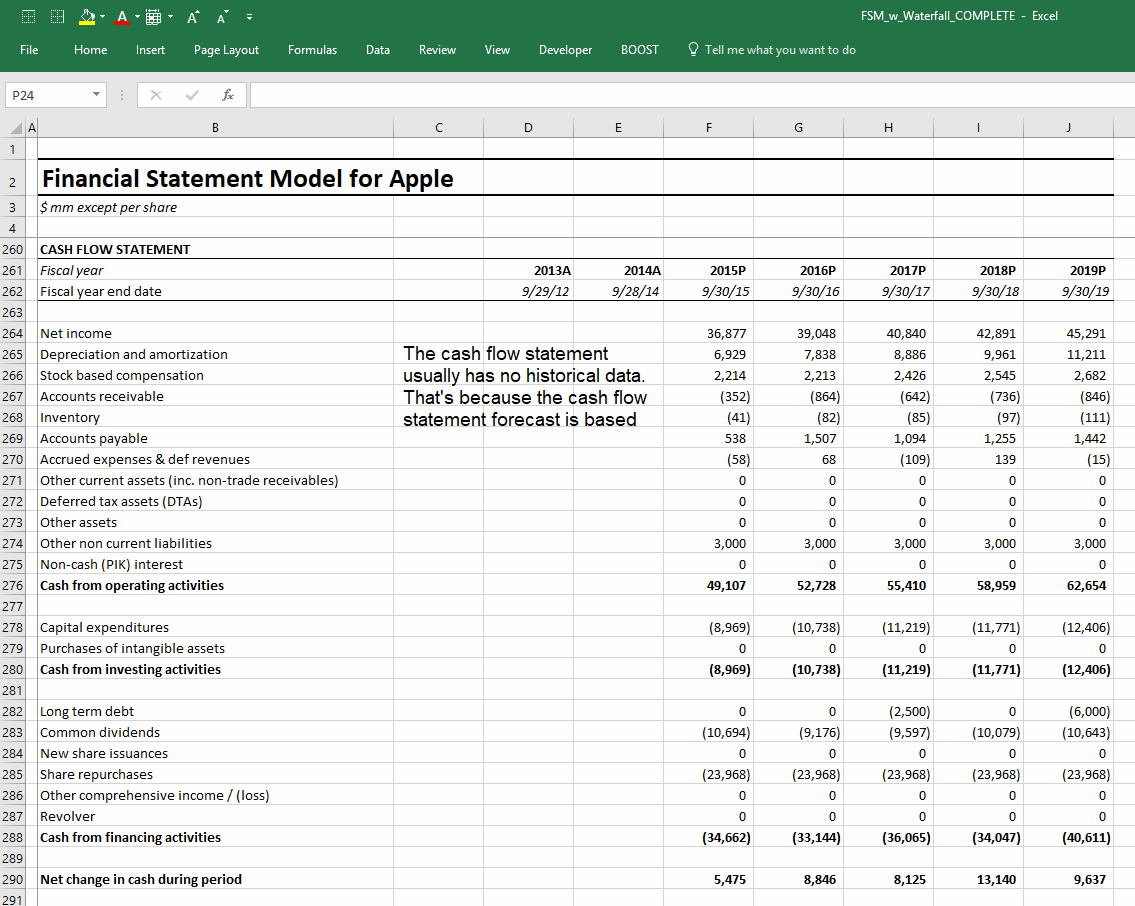
A universal feature of a 3-statement model is that cash and a revolving credit line serve as model "plugs." This simply means that a 3-statement model has an automatic way of ensuring that when the model projects a cash shortfall after all the line items are forecast, additional debt via a "revolver" account will automatically increase to finance the shortfall. Conversely, if the model projects a cash surplus, cash will accumulate by the amount of the surplus. While this seems fairly logical, modeling this can be tricky. Click here for a guide to forecasting the revolver and cash balance with a free excel template
Many financial models have to deal with a problem in Excel called circularity. A circularity in Excel occurs when one calculation either directly or indirectly depends on itself to arrive at an output. In the 3-statement model, a circularity can occur because of the model plugs described above. This makes Excel unstable and can create a variety of problems for those using the model. There are several elegant ways to deal with this issue. To learn more about how to deal with circularity, go to the "Circularity" section of our guide on financial modeling best practices.
For public companies, projecting earnings per share is key. Forecasting the numerator of EPS is described in detail in our income statement forecasting guide, but forecasting shares outstanding can be done in a variety of ways, ranging from simply keeping the historical share count constant to a more sophisticated analysis that takes into account forecasts for share repurchases and issuances. Click here for a guide to forecasting EPS.
The purpose of building a 3-statement financial model is to observe how various operating, financing and investing assumptions impact a company’s forecasts. Once the initial case is built, it is useful to see — using either equity research, management guidance, or other assumptions — how the forecasts change given changes in a variety of key model assumptions. To this end, financial models often have a drop-down list that provides the user with the option to select either the original case (often called “base case”) or a variety of other scenarios ("strong case," "weak case," "management case," etc.), which is referred to as scenario analysis.
A close cousin of scenario analysis is sensitivity analysis. Any good 3-statement financial model (or a DCF model, LBO model, or M&A model, for that matter) will include the ability to toggle between various scenarios to see how the model’s outputs change, as well as something called sensitivity analysis. Sensitivity analysis is the process of isolating one (usually critical) model output to see how changes impact one or two key inputs.
For example, how would Apple’s 2020 EPS forecast change at various assumptions for 2020 revenue growth and gross profit margins? Click here to learn how to build a sensitivity analysis into a 3-statement model.
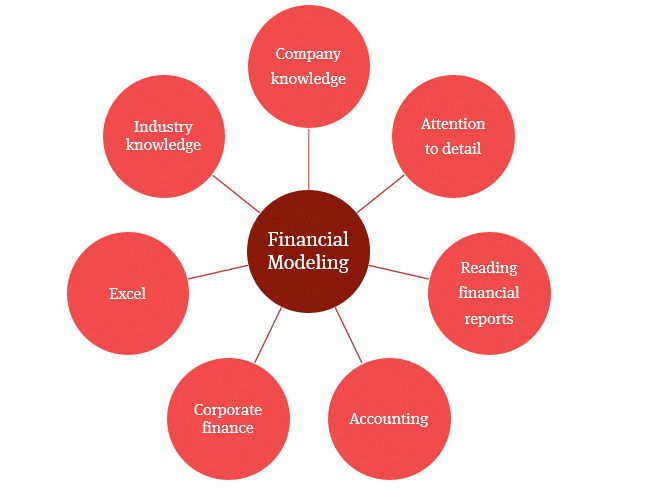
Building a 3-statement financial model requires the combination of the following skills:
At their core, all M&A, DCF, and LBO models depend on forecasts produced in the 3-statement model.
The output of a 3-statement model serves as the foundation for several types of financial models:

Enroll in The Premium Package: Learn Financial Statement Modeling, DCF, M&A, LBO and Comps. The same training program used at top investment banks.



Wonderful. I have a question. I have seen 3 statement model which is generated with the help of VBA bases macros. I guessed it needs some support files like simulation, forecasting assumptions etc to build a model. How to prepare these support files? Is it really required for modeling? Apart from this support files is any other file required? Please let me know.
Surekha:
Yes, you would need to populate some files with forecasts to pull into your VBA-based workbook. Unfortunately, there’s no way for me to tell what you need to forecast and in what format the files should be created. This would be based on the macros in your file.
Best,
Jeff
Please how do i include inflation rate in the financial model. How do I link them to the numbers in the model?
Hi, Wilson,
Financial models are usually projected in nominal terms, so not controlling for the loss of purchasing power through monetary inflation. You would capture inflation through projecting rising costs and (hopefully) rising prices in the sale of goods.
BB