The Discounted Cash Flow Model, or “DCF Model”, is a type of financial model that values a company by forecasting its cash flows and discounting them to arrive at a current, present value.
DCFs are widely used in both academia and in practice.
Valuing companies using a DCF model is considered a core skill for investment bankers, private equity, equity research, and “buy side” investors.
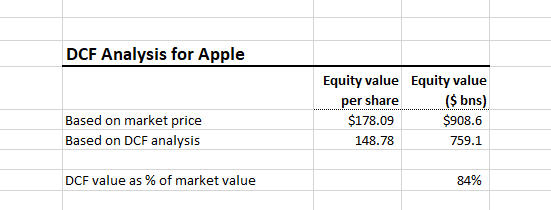
This DCF analysis suggests that Apple might be overvalued (or that our assumptions are wrong!)
A DCF model estimates a company’s intrinsic value (the value based on a company’s ability to generate cash flows) and is often presented in comparison to the company’s market value.
For example, Apple has a market capitalization of approximately $909 billion. Is that market price justified based on the company’s fundamentals and expected future performance (i.e. its intrinsic value)? That is exactly what a DCF seeks to answer.
In contrast with market-based valuation like a comparable company analysis, the idea behind the DCF model is that the value of a company is not a function of arbitrary supply and demand for that company’s stock. Instead, the value of a company is a function of a company’s ability to generate cash flow in the future for its shareholders.
Generate Key Takeaways
DCF Model Basics: Present Value Formula
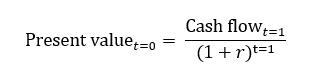
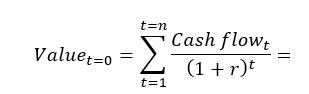
The DCF approach requires that we forecast a company’s future cash flows and discount them to the present to arrive at a present value for the company. That present value is the amount investors should be willing to pay (the company's value). We can express this formulaically as the following (we denote the discount rate as r):
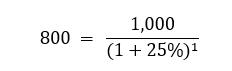
So, let’s say you decide you’re willing to pay $800 for the below. We can solve this as:
If I make the same proposition but instead of only promising $1,000 next year, say I promise $1,000 for the next 5 years.The math gets only slightly more complicated:
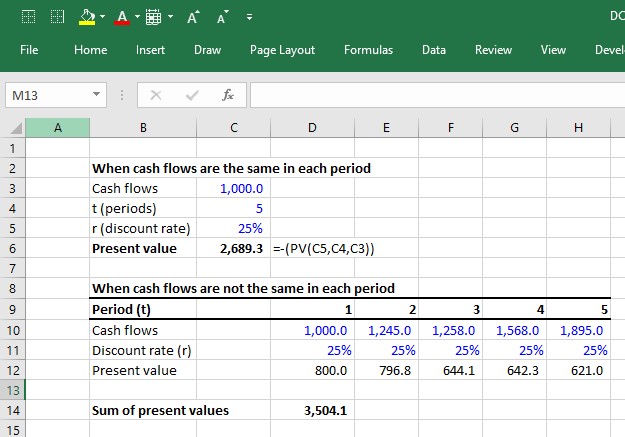
In Excel, you can calculate this using the PV function (see below). However, if cash flows are different each year, you will have to discount each cash flow separately:
Build Smarter DCF Models with AI
Hundreds of assumptions go into building a DCF model—it's hard to keep track and know if what you're doing is accurate. Fortunately, artificial intelligence is here to save us! Artificial intelligence can help you get to the right answer faster and smarter than countless hours of number crunching and late nights. Accelerate your AI literacy with our 8-week AI for Business & Finance Certificate Program in collaboration with Columbia Business School Executive Education.
The premise of the DCF model is that the value of a business is purely a function of its future cash flows. Thus, the first challenge in building a DCF model is to define and calculate the cash flows that a business generates. There are two common approaches to calculating the cash flows that a business generates.
Unlevered DCF approach Forecast and discount the operating cash flows. Then, when you have a present value, just add any non-operating assets such as cash, and subtract any financing-related liabilities such as debt.
Levered DCF approach Forecast and discount the cash flows that remain available to equity shareholders after cash flows to all non-equity claims (i.e. debt) have been removed.
Both should theoretically lead to the same value at the end (though in practice it's pretty hard to get them to be exactly equal). The unlevered DCF approach is the most common and is thus the focus of this guide. This approach involves 6 steps:
Step 1. Forecasting unlevered free cash flows
Step 1 is to forecast the cash flows a company generates from its core operations after accounting for all operating expenses and investments.
These cash flows are called "unlevered free cash flows."
Step 2. Calculating the terminal value
You can't keep forecasting cash flows forever. At some point, you must make some high-level assumptions about cash flows beyond the final explicit forecast year by estimating a lump-sum value of the business past the explicit forecast period.
That lump sum is called the "terminal value."
Step 3. Discounting the cash flows to the present at the WACC
Because unlevered free cash flows represent all operating cash flows, these cash flows “belong” to both the company’s lenders and owners.
As such, the risks of both providers of capital (i.e. debt vs. equity) need to be accounted for using appropriate capital structure weights (hence the term “weighted average” cost of capital).
Once discounted, the present value of all unlevered free cash flows is called the enterprise value.
Step 4. Add the value of non-operating assets to the present value of unlevered free cash flows
If a company has any non-operating assets such as cash or has some investments just sitting on the balance sheet, we must add them to the present value of unlevered free cash flows.
For example, if we calculate that the present value of Apple’s unlevered free cash flows is $700 billion, but then we discover that Apple also has $200 billion in cash just sitting around, we should add this cash.
Step 5. Subtract debt and other non-equity claims
The ultimate goal of the DCF is to get at what belongs to the equity owners (equity value).
Therefore if a company has any lenders (or any other non-equity claims against the business), we need to subtract this from the present value.
What’s left over belongs to the equity owners.
In our example, if Apple had $50 billion in debt obligations at the valuation date, the equity value would be calculated as:
Often, the non-operating assets and debt claims are added together as one term called net debt (debt and other non-equity claims – non-operating assets).
You’ll often see the equation: enterprise value – net debt = equity value. The equity value that the DCF calculates is comparable to the market capitalization (the market’s perception of the equity value).
Step 6. Divide the equity value by the shares outstanding
The equity value tells us what the total value to owners is. But what is the value of each share? In order to calculate this, we divide the equity value by the company’s diluted shares outstanding.
FCF = EBIT x (1- tax rate) + D&A + NWC – Capital expenditures
EBIT = Earnings before interest and taxes. This represents a company’s GAAP-based operating profit.
Tax rate = The tax rate the company is expected to face. When forecasting taxes, we usually use a company’s historical effective tax rate.
D&A = Depreciation and amortization.
NWC = Annual changes in net working capital. Increases in NWC are cash outflows while decreases are cash inflows.
Capital expenditures represent cash investments the company must make to sustain the forecasted growth of the business. If you don’t factor in the cost of required reinvestment into the business, you will overstate the value of the company by giving it credit for EBIT growth without accounting for the investments required to achieve it.
FCFs are ideally driven from a 3-statement model
Forecasting all these line items should ideally come from a 3-statement model because all of the components of unlevered free cash flows are interrelated: Changes in EBIT assumptions impact capex, NWC, and D&A. Without a 3-statement model that dynamically links all these components together, it is difficult to ensure that the changes in assumptions of one component correctly impact the other components.
Because this takes more work and more time, finance professionals often do preliminary analyses using a quick, back-of-the-envelope DCF model and only build a full DCF model driven by a 3-statement model when the stakes are high, such as when an investment banking deal goes “live” or when a private equity firm is in the later stages of the investment process.
2-Stage DCF Model Structure
The 3-statement models that support a DCF are usually annual models that forecast about 5-10 years into the future. However, when valuing businesses, we usually assume they are a going concern. In other words, the assumption is that they will continue to operate forever.
That means that the 3-statement model only takes us so far. We also have to forecast the present value of all future unlevered free cash flows after the explicit forecast period. This is called the 2-stage DCF model. The first stage is to forecast the unlevered free cash flows explicitly (and ideally from a 3-statement model). The second stage is the total of all cash flows after stage 1. This typically entails making some assumptions about the company reaching mature growth. The present value of the stage 2 cash flows is called the terminal value.
Calculating the terminal value
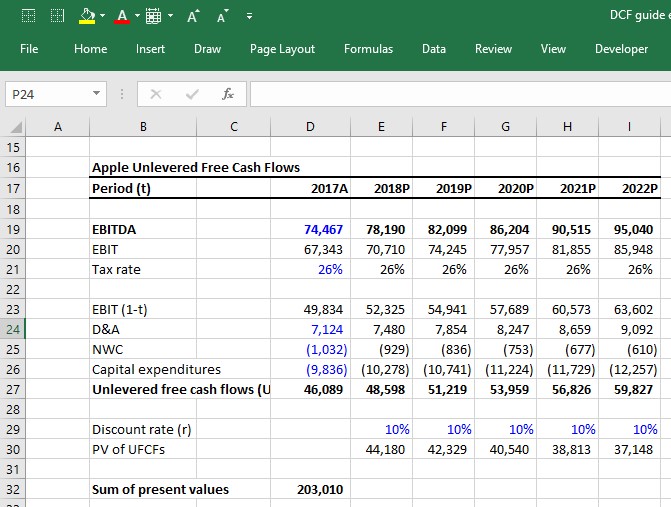
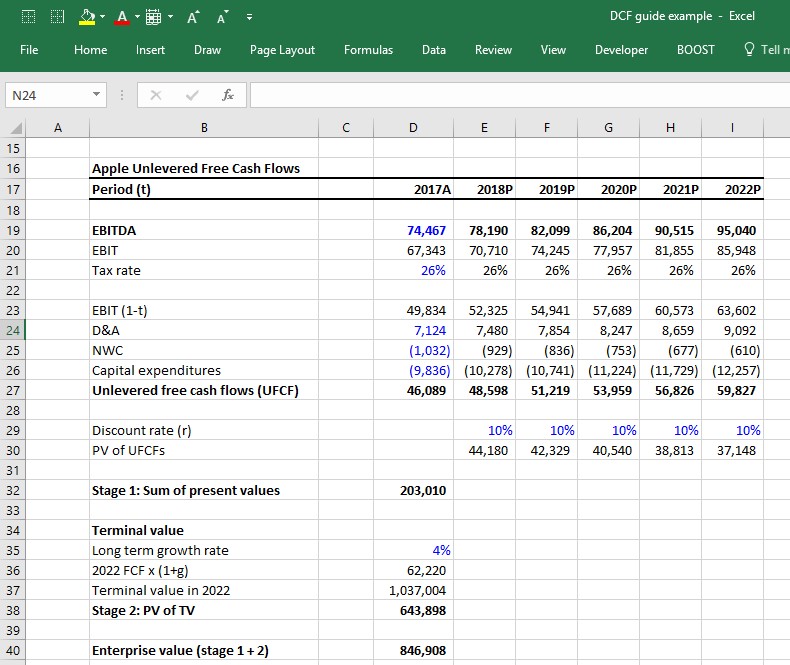
In a DCF, the terminal value (TV) represents the value the company will generate from all the expected free cash flows after the explicit forecast period. Imagine that we calculate the following unlevered free cash flows for Apple:
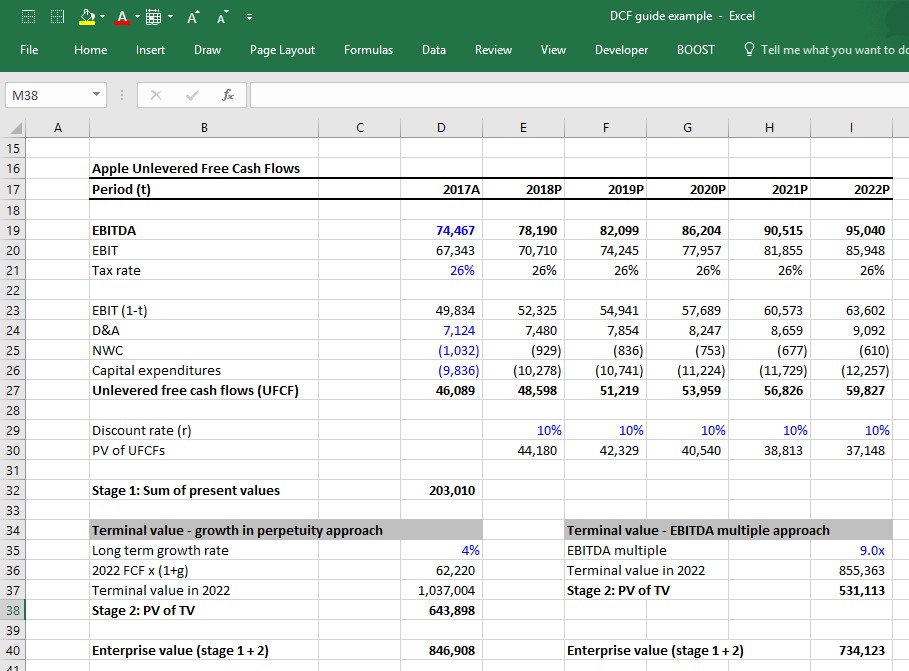
Apple is expected to generate cash flows beyond 2022, but we cannot project FCFs forever (with any degree of accuracy). So how do we estimate the value of Apple beyond 2022? There are two common approaches:
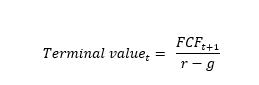
The growth in perpetuity approach assumes Apple’s UFCFs will grow at some constant growth rate assumption from 2022 to … forever. The formula for calculating the present value of a cash flow growing at a constant growth rate in perpetuity is called the "Growth in perpetuity formula":
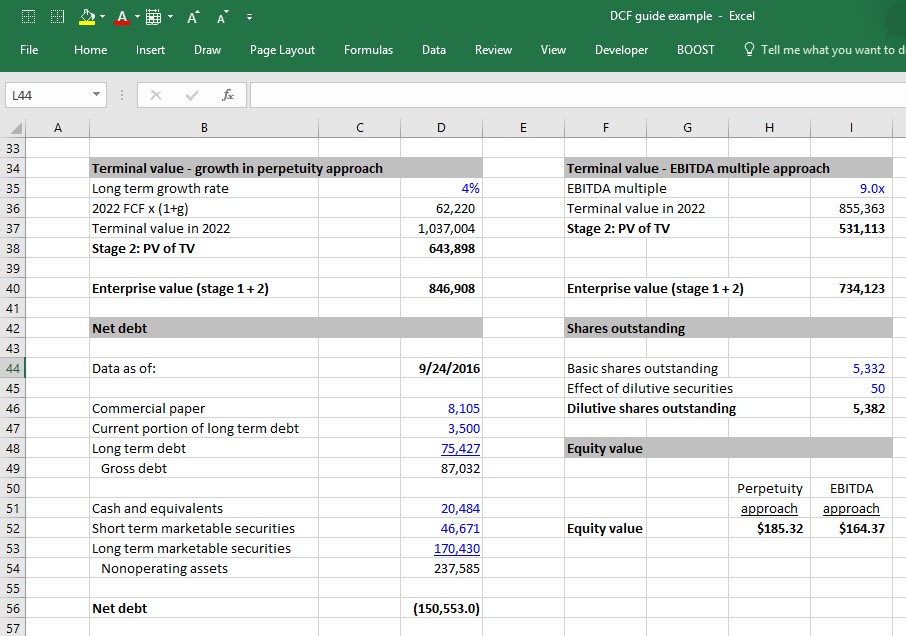
If we assume that after 2022, Apple’s UFCFs will grow at a constant 4% rate into perpetuity and will face a weighted average cost of capital of 10% in perpetuity, the terminal value (which is the present value of all Apple’s future cash flows beyond 2022) is calculated as:
At this point, notice that we have finally calculated enterprise value as simply the sum of the stage 1 present value of UFCFs + the present value of the stage 2 terminal value.
Exit EBITDA Multiple Method
The growth in perpetuity approach forces us to guess the long-term growth rate of a company. The result of the analysis is very sensitive to this assumption. A way around having to guess a company’s long-term growth rate is to guess the EBITDA multiple the company will be valued at the last year of the stage 1 forecast.
A common way to do this is to look at the current EV/EBITDA multiple the company is trading at (or the average EV/EBITDA multiple of the company’s peer group) and assume the company will be valued at that same multiple in the future. For example, if Apple is currently valued at 9.0x its last twelve months (LTM) EBITDA, we can assume that in 2022 it will be valued at 9.0x its 2022 EBITDA.
Growth in Perpetuity vs. Exit EBITDA Multiple Method
Investment bankers and private equity professionals tend to be more comfortable with the EBITDA multiple approach because it infuses market reality into the DCF. A private equity professional building a DCF will likely try to figure out what he/she can sell the company for 5 years down the road, so this arguably provides a valuation via an EBITDA multiple.
However, this approach suffers from a significant conceptual problem: It incorporates current market valuations within the DCF, which arguably defeats the whole purpose of the DCF. Making matters worse is the fact that the terminal value often represents a significant percentage of the value contribution in a DCF, so the assumptions that go into calculating the terminal value are all the more important.
Discounting Free Cash Flows (FCFs) by WACC
Up to now, we’ve been assuming a 10% discount rate for Apple, but how is that quantified?
Quantifying the discount rate, which in this case is the weighted average cost of capital (WACC), is a critical field of study in corporate finance. You can spend an entire college semester learning about it. We've written a complete guide to WACC here, but below are the basic elements for how it is typically calculated:
The WACC formula
Where:
Debt = market value of debt
Equity = market value of equity
rdebt = cost of debt
requity = cost of equity
Calculating Equity Value: Adding the Value of Non-Operating Assets
Many companies have assets not directly tied to operations. Assets such as cash increase the value of the company (i.e. a company whose operations are worth $1 billion but also has $100 million in cash is worth $1.1 billion). But up to now, the value is not accounted for in the unlevered free cash flow calculation. Therefore, these assets need to be added to the value. The most common non-operating assets include:
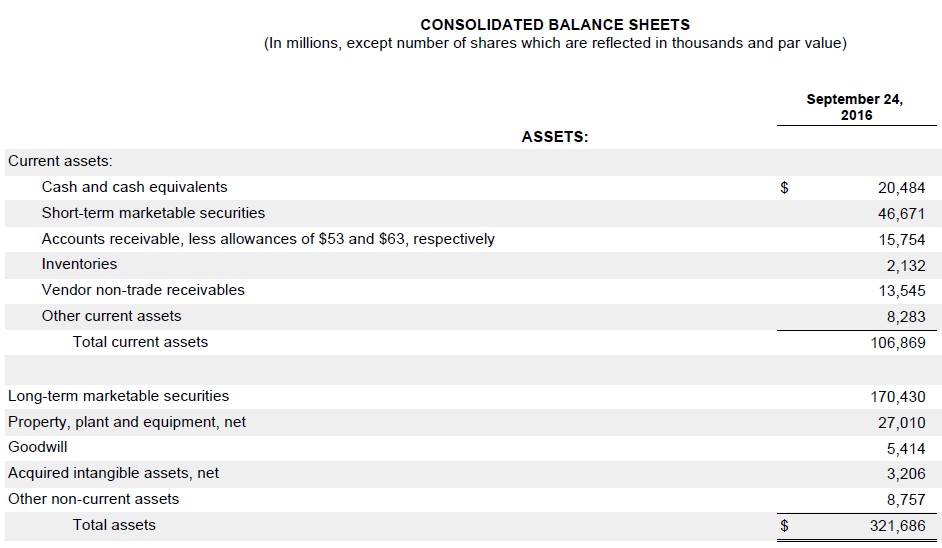
Below is Apple's 2016 year-end balance sheet. The non-operating assets are its cash and equivalents, short-term marketable securities, and long-term marketable securities. As you can see, they represent a significant portion of the company’s balance sheet.
Unlike operating assets such as PP&E, inventory, and intangible assets, the carrying value of non-operating assets on the balance sheet is usually fairly close to their actual value. That’s because they are mostly comprised of cash and liquid investments that companies generally can mark up to fair value. That’s not always the case (equity investments are a notable exception), but it’s typically safe to simply use the latest balance sheet values of non-operating assets as the actual market values.
Getting from Enterprise Value to Equity Value (Subtracting Debt and Non-Equity Claims)
At this point, we need to identify and subtract all non-equity claims on the business to arrive at how much of the company value belongs to equity owners. The most common non-equity claims you’ll encounter are:
All debt (short-term, long-term, bonds, loans, etc..)
Capital Leases
Preferred stock
Non-controlling (minority) interests
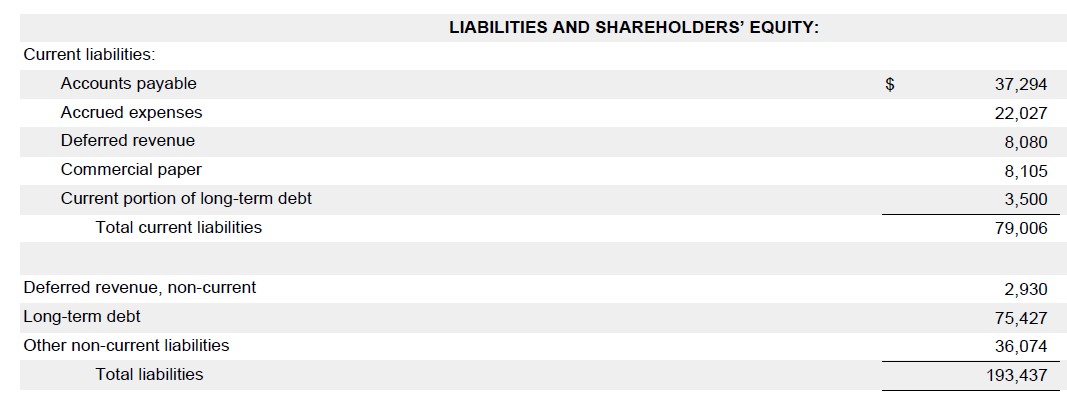
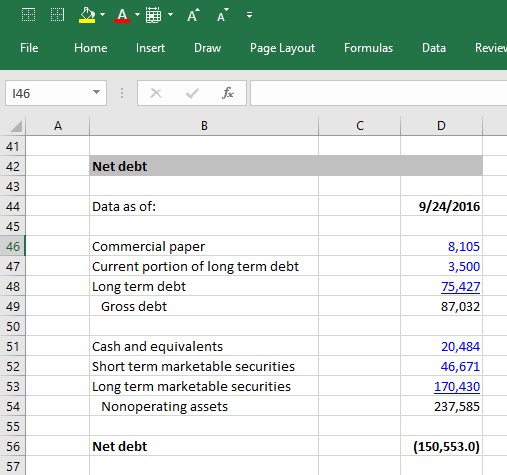
Below are Apple’s 2016 year-end balance sheet liabilities. You can see it includes commercial paper, the current portion of long-term debt, and long-term debt.
These are the three items that would make up Apple’s non-equity claims.
As with the non-operating assets, finance professionals usually just use the latest balance sheet values of these items as a proxy for their actual values. This is usually a safe approach when the market values are fairly close to the balance sheet values. The market value of debt doesn’t usually deviate too much from the book value unless market interest rates have changed dramatically since the issue or if the company’s credit profile has changed dramatically (i.e. a company in financial distress will have its debt trading at pennies on the dollar).
One place where the book value-as-proxy-for-market-value can be dangerous is with "non-controlling interests." Non-controlling interests are usually understated on the balance sheet. If they are significant, it is preferable to apply an industry multiple to better reflect their true value.
The bad news is that we rarely have enough insight into the nature of the non-controlling interests’ operations to figure out the right multiple to use. The good news is that non-controlling interests are rarely large enough to make a significant difference in valuation (most companies don’t have any).
Net debt formula
When building a DCF model, finance professionals often net non-operating assets against non-equity claims and call it net debt, which is subtracted from enterprise value to arrive at equity value:
Enterprise value – net debt = Equity value
The formula for net debt is simply the value of all nonequity claims less the value of all non-operating assets:
Gross Debt (short term, long term, bonds, loans, etc..)
+ Capital Leases
+ Preferred stock
+ Non-controlling (minority) interests
- Cash
- Marketable securities
- Equity investments
Net debt
Using Apple’s 2016 10K, we can see that it has a substantial negative net debt balance. For companies that carry significant debt, a positive net debt balance is more common, while a negative net debt balance is common for companies that keep a lot of cash.
Calculate Equity Value Per Share
Once a company’s equity value has been calculated, the next step is to determine the value of each share. To figure this out, we have to determine the number of shares that are currently outstanding. We have written a thorough guide to calculating a company’s current shares but will summarize the key steps here:
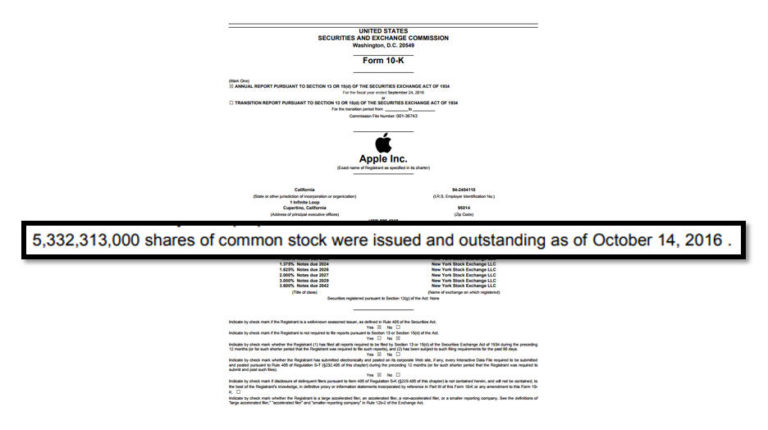
1. Take the current actual share count from the front cover of the company’s latest annual (10K) or interim (10Q) filing. For Apple, it is:
2. Next, add the effect of dilutive shares. These are shares that aren’t quite common stock yet, but that can become common stock and thus be potentially dilutive to the common shareholders (i.e. stock options, warrants, restricted stock, convertible debt, and convertible preferred stock).
Assuming that we calculated 50 million dilutive securities for Apple, we can now put all the pieces together and complete the analysis:
Key DCF Assumptions
We have now completed the 6 steps to building a DCF model and have calculated the equity value of Apple.
What were the key assumptions that led us to the value we arrived at?
The three key assumptions in a DCF model are:
The operating assumptions (revenue growth and operating margins)
The weighted average cost of capital (WACC)
Terminal value assumptions: Long-term growth rate and the exit multiple
Each of these assumptions is critical to getting an accurate model. In fact, the DCF model's sensitivity to these assumptions, and the lack of confidence finance professionals have in these assumptions, (especially the WACC and terminal value) are frequently cited as the main weaknesses of the DCF model.
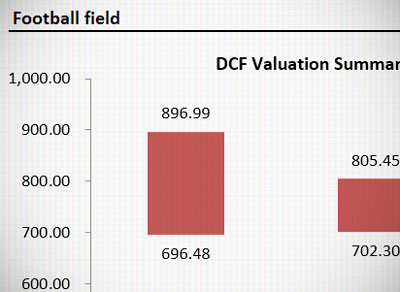
Nonetheless, the DCF model is one of the most common models used by investment bankers and other finance professionals, and the DCF output is almost always presented using a range of terminal value and WACC assumptions, as well as in context to other valuation methodologies. A common way this is presented is by using a football field valuation matrix.
We wrote this guide for those thinking about a career in finance and those in the early stages of preparing for job interviews. This guide is quite detailed, but it stops short of all corner cases and nuances of a fully-fledged DCF model.
Continue Reading Below
Step-by-Step Online Course
Everything You Need To Master Financial Modeling
Enroll in The Premium Package: Learn Financial Statement Modeling, DCF, M&A, LBO and Comps. The same training program used at top investment banks.
Is a DCF model better than comparable company analysis?
Neither is better — they answer different questions. A DCF tells you what a company is worth based on its own fundamentals and your assumptions about the future. Comparable company analysis tells you what the market is currently paying for similar businesses. DCF is more rigorous but more sensitive to assumptions; comps are faster but import the market's mispricing along with its data. In practice, investment bankers use both and present them together so the DCF can be benchmarked against what the market actually implies.
What are the biggest weaknesses of a DCF model?
The DCF's main vulnerability is its sensitivity to a small number of assumptions, particularly the terminal growth rate and discount rate, which are genuinely difficult to forecast with confidence. A half-point change in either can shift the implied value by 20% or more. The model also assumes stable, predictable cash flows, which makes it less reliable for early-stage companies, highly cyclical businesses, or firms going through structural change. These limitations don't make the DCF less useful, but they do mean the output should always be presented as a range, not a precise answer.
How do you know if a stock is overvalued or undervalued using a DCF?
You compare the DCF's implied share price to the current market price. If the DCF output is higher than the stock's trading price, the stock may be undervalued — the market is paying less than what the fundamentals suggest it's worth. If the DCF output is lower, the stock may be overvalued. In practice, the output is rarely treated as a binary buy/sell signal. Analysts look at the range of values across different scenarios and assess how much margin of safety exists before the stock would need to be considered fairly priced.
Why do two analysts build a DCF for the same company and get very different values?
Because the model's output depends almost entirely on assumptions, and reasonable people can disagree significantly on revenue growth, margins, reinvestment needs, and the appropriate discount rate. Even small differences in terminal growth rate assumptions compound dramatically over a long forecast horizon. That's why DCF results are presented as ranges with sensitivity tables, not single-point estimates — and why the model's value lies more in the disciplined thinking it forces than in any one specific number it produces.
What's the difference between a levered and unlevered DCF?
An unlevered DCF projects cash flows before debt payments and discounts them at WACC — a blended rate that accounts for both debt and equity holders. The output is enterprise value, from which you subtract net debt to get equity value. A levered DCF projects cash flows after debt payments and discounts them at the cost of equity alone, arriving directly at equity value. Both should theoretically produce the same result, but in practice the unlevered approach is far more common because it's easier to apply consistently, especially when a company's capital structure is expected to change over time.
Can you build a DCF model for a private company?
Yes, though it's harder. The mechanics are the same, but two key inputs become significantly more difficult to estimate: the discount rate and comparable data for the terminal value. WACC requires market-based inputs like beta, which isn't observable for private companies — analysts typically proxy it using a peer group of public companies and adjust for differences in leverage and size. Terminal value multiples also have to be derived from public comparables. The result is a DCF with wider uncertainty bands than a public company model, but it remains a standard tool in private equity and M&A valuations.
How does inflation affect a DCF model?
Inflation affects a DCF through both the cash flow forecasts and the discount rate. On the cash flow side, inflation erodes real purchasing power — a company that grows revenue 5% in a high-inflation environment may not be generating more real value. On the discount rate side, higher inflation typically pushes up interest rates and the risk-free rate, which increases WACC and reduces the present value of future cash flows. Models built during low-rate environments can significantly overstate value if discount rate assumptions aren't updated to reflect a higher inflation regime.
What is a football field chart in the context of a DCF?
A football field chart is a horizontal bar chart that displays valuation ranges from multiple methods side by side — typically DCF, trading comps, precedent transactions, and sometimes a 52-week trading range. Each bar represents the low-to-high range of implied values from that method. The chart gets its name from its visual resemblance to a football field. Investment bankers use it in pitch books and fairness opinions to show clients where different valuation approaches converge or diverge, and to frame where a proposed deal price lands relative to the full picture.
Do DCF models come up in finance interviews?
Yes — and in more depth than most candidates expect. Beyond being able to walk through the steps, interviewers test whether you understand the model's logic: why WACC is the right discount rate for unlevered cash flows, how a change in working capital affects value, and what it means conceptually for terminal value to represent 70–80% of the total output. Common curveball questions include: "What happens to the DCF if capex increases?" or "Walk me through a scenario where the DCF and comps give very different answers." Fluency with the model's mechanics and its limitations is the bar.
How long does it take to build a DCF model?
A back-of-the-envelope DCF — pulling high-level historical data and making rough assumptions — can be done in a few hours. A fully integrated DCF driven by a 3-statement model, with scenario toggles, sensitivity tables, and properly sourced assumptions, typically takes one to several days depending on the company's complexity. In investment banking, analysts often build quick DCFs early in a process to establish a rough valuation range, then refine the model significantly once a deal goes live and more detailed due diligence is available.
When calculating the cost of debt, how does one account for capital/ finance leases?? There is no explicit rate listed (other than the discount rate)… I want to get some sort of rate, so that I can calculate a weighted cost of debt. Thanks! Also, when calculating a weighted cost of debt, it should be based off of the principal gross of debt issuance costs, OID correct? As that it the amount the rate is technically multiplied by
Jeff Schmidt
February 23, 2020 4:33 pm
Joe:
For finance leases, you will have to dig around footnotes and see if you can impute a rate. A recent accounting change now calls for operating leases to be on the balance sheet and companies will disclose the interest rate they use for that. Yes, technically, everything should be based off of the gross principal. However, as long as the company is investment grade using the book value (which is net of issuance costs) should be de minimis.
Best,
Jeff
Patrik Lindstrom
November 9, 2020 11:45 am
Thanks for this information. Only have one question under the section “Exit EBITDA multiple method” and the calculation in cell i 37 (Stage 2: PV of TV), can you please show me the calculation how you came up to 531,113? My calculation say 517,95 and wondering what I have done wrong.
Thanks in advance!
/P
Jeff Schmidt
November 10, 2020 12:47 pm
Patrik:
I’m not sure why there would be a difference if everything is the same but you do have a Complete version of the model to check yours against.
Best,
Jeff
Atkin Kausimae
January 12, 2021 3:17 am
Thanks for this information. Well illustrated each key concept with clear and simple examples.
how do you calculate NWC using sales movement or as a percentage of sales method?
Jeff Schmidt
February 26, 2021 12:21 pm
Freddy:
I’m not sure I 100% understand your question. You simply calculate net working capital and divide it by sales. You would then project that percentage (maybe a little higher or a little lower depending on your thesis) going forward. The change in net working capital would then be included in your unlevered free cash flow calculation.
Best,
Jeff
freddy
February 26, 2021 12:38 pm
Im working on a heavily investment infra projects with a linear relation between sales and working capital, using DCF method I would consider 20-25% of current year net sales as an amount of changes in working capital. Please give me your opinion. Anyway, does this percentage also affected by net days of payable/receivable?
Jeff Schmidt
February 26, 2021 1:26 pm
Freddy:
Unfortunately, we only provide support answers to questions regarding our curriculum. It wouldn’t be appropriate for me to comment on your project’s net working capital.
Best,
Jeff
sakkel Pura
March 19, 2021 11:58 am
When calculating the NPV financial Modelling for a new business investment with debt equity capital Structure eg ; 6:4(Bank Loan ) , what amount will be considered as net investment ?only Equity or Both or only cost of Debt?
Jeff Schmidt
March 19, 2021 12:05 pm
Sakkel:
Unfortunately, our support only covers our actual material.
Best,
Jeff
Jacob Tate
April 8, 2021 11:13 am
When calculating the capex for each projection, is the 1.045 multiple just an assumption that our expenditures will increase by 4.5% p.a.?
Jeff Schmidt
April 8, 2021 11:16 am
Jacob:
That is correct.
Best,
Jeff
Jacob Tate
April 8, 2021 11:17 am
Great, thank you Jeff!
John Doe
October 25, 2021 9:08 am
I believe you wanted to say “- NWC” in your “FCF = EBIT x (1- tax rate) + D&A + NWC – CapEx” formula.
Jeff Schmidt
October 25, 2021 11:26 am
John:
It could be plus or minus depending on the change in NWC.











When calculating the cost of debt, how does one account for capital/ finance leases?? There is no explicit rate listed (other than the discount rate)… I want to get some sort of rate, so that I can calculate a weighted cost of debt. Thanks! Also, when calculating a weighted cost of debt, it should be based off of the principal gross of debt issuance costs, OID correct? As that it the amount the rate is technically multiplied by
Joe:
For finance leases, you will have to dig around footnotes and see if you can impute a rate. A recent accounting change now calls for operating leases to be on the balance sheet and companies will disclose the interest rate they use for that. Yes, technically, everything should be based off of the gross principal. However, as long as the company is investment grade using the book value (which is net of issuance costs) should be de minimis.
Best,
Jeff
Thanks for this information. Only have one question under the section “Exit EBITDA multiple method” and the calculation in cell i 37 (Stage 2: PV of TV), can you please show me the calculation how you came up to 531,113? My calculation say 517,95 and wondering what I have done wrong.
Thanks in advance!
/P
Patrik:
I’m not sure why there would be a difference if everything is the same but you do have a Complete version of the model to check yours against.
Best,
Jeff
Thanks for this information. Well illustrated each key concept with clear and simple examples.
how do you calculate NWC using sales movement or as a percentage of sales method?
Freddy:
I’m not sure I 100% understand your question. You simply calculate net working capital and divide it by sales. You would then project that percentage (maybe a little higher or a little lower depending on your thesis) going forward. The change in net working capital would then be included in your unlevered free cash flow calculation.
Best,
Jeff
Im working on a heavily investment infra projects with a linear relation between sales and working capital, using DCF method I would consider 20-25% of current year net sales as an amount of changes in working capital. Please give me your opinion. Anyway, does this percentage also affected by net days of payable/receivable?
Freddy:
Unfortunately, we only provide support answers to questions regarding our curriculum. It wouldn’t be appropriate for me to comment on your project’s net working capital.
Best,
Jeff
When calculating the NPV financial Modelling for a new business investment with debt equity capital Structure eg ; 6:4(Bank Loan ) , what amount will be considered as net investment ?only Equity or Both or only cost of Debt?
Sakkel:
Unfortunately, our support only covers our actual material.
Best,
Jeff
When calculating the capex for each projection, is the 1.045 multiple just an assumption that our expenditures will increase by 4.5% p.a.?
Jacob:
That is correct.
Best,
Jeff
Great, thank you Jeff!
I believe you wanted to say “- NWC” in your “FCF = EBIT x (1- tax rate) + D&A + NWC – CapEx” formula.
John:
It could be plus or minus depending on the change in NWC.
Best,
Jeff