The Weighted Average Cost of Capital (WACC) is one of the key inputs in discounted cash flow (DCF) analysis, and is frequently the topic of technical investment banking interviews.
The WACC is the rate at which a company’s future cash flows need to be discounted to arrive at a present value (PV) for the business. It reflects the perceived riskiness of the cash flows.
Put simply, if the value of a company equals the present value of its future cash flows, WACC is the rate we use to discount those future cash flows to the present.
Generate Key Takeaways
WACC Formula
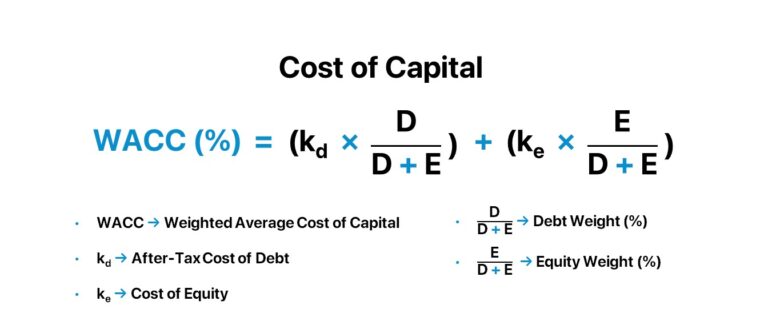
Below we present the WACC formula, it is necessary to understand the intuition behind the formula and how to arrive at each calculation.
Before getting into the details of calculating WACC, let’s understand the basics of the reason to discount future cash flows in the first place using a simple example:
Suppose I promise to give you $1,000 next year in exchange for money upfront. What’s the most you would be willing to pay me for that today? Would you be willing to pay me $500? What about $800?
The decision depends on the risk you perceive of receiving the $1,000 cash flow next year.
Low Risk = Low Return → If you feel there is little to no risk of not getting paid, you would quantify your opportunity cost as low. You'd be willing to pay more, and thus receive a lower return.
High Risk = High Return → If you feel the chance of actually collecting the $1,000 is very low, you may not be willing to part with much money today. In other words, you’d discount at a high rate.
From our illustrative exercise, it should be easy to understand how higher perceived risk correlates to a higher required return (and vice versa).
The challenge is how to quantify the risk. The WACC formula is simply a method that attempts to do that.
What are the WACC Components?
We can also think of this as a cost of capital from the perspective of the entity raising the capital. (In our simple example, that entity is me, but in practice, it would be a company.)
If I promise you $1,000 next year in exchange for money now, the higher the risk you perceive equates to a higher cost of capital for me.
Here's an easy way to see this: Imagine you decide there's a high risk of me not paying you $1000 in the future, so you're only willing to give me $500 today. For me, that amounts to a 100% interest rate ($500 principal return + $500 in interest).
It should be clear by now that raising capital (both debt and equity) comes with a cost to the company raising the capital.
While our simple example resembles debt (with a fixed and clear repayment), the same concept applies to equity. The equity investor will require a higher return (via dividends or a lower valuation), which leads to a higher cost of equity capital to the company because they have to pay the higher dividends or accept a lower valuation, which means higher dilution of existing shareholders.
It should be clear by now that raising capital (both debt and equity) comes with a cost to the company raising the capital:
Cost of Debt → The cost of debt is the interest the company must pay.
Cost of Equity → The cost of equity is the dilution of ownership. From the lender and equity investor perspective, the higher the perceived risks, the higher the returns they will expect, and drive the cost of capital up. It’s two sides of the same coin.
Let's get back to our simplified example, in which I promise to give you $1,000 next year, and you must decide how much to give me today. Even if you perceive no risk, you will likely still give me less than $1,000 simply because you prefer money in hand.
The rate you will charge, even if you estimate no risk, is called the risk-free rate. When investors purchase U.S. treasuries, it’s essentially risk-free — the government can print money, so the risk of default is zero (or close to it).
The return on risk-free securities is currently around 2.5%. Because you can invest in risk-free U.S. treasuries at 2.5%, you would be crazy to give me any more than $1,000/1.025 = $975.61.
As we'll see, it’s often helpful to think of the cost of debt and the cost of equity as starting from a baseline of the risk-free rate + a premium above the risk-free rate that reflects the risks of the investment.
How Does the Capital Structure Impact WACC?
Now that we've covered the high-level stuff, let's dig into the WACC formula. Recall the WACC formula from earlier:
Notice there are two components of the WACC formula: 1) cost of debt (rdebt) and 2) cost of equity (requity), which are both multiplied by the proportion of the company's debt and equity capital, respectively.
Lender risk is usually lower than equity investor risk, because debt payments are fixed and predictable, and equity investors can only be paid after lenders are paid. Companies are also typically under no obligation to make equity payments (like the issuance of dividends) within a certain time window.
Further, a company can choose to delay payments until some event in the future, such as an acquisition. This makes cash flows even less predictable (read: risky) for equity investors.
Because the cost of debt and cost of equity that a company faces are different, the WACC has to account for how much debt vs equity a company has and to allocate the respective risks according to the debt and equity capital weights appropriately.
In other words, the WACC is a blend of a company’s equity and debt cost of capital based on the company's debt and equity capital ratio. As such, the first step in calculating WACC is to estimate the debt-to-equity mix (capital structure).
How to Determine Capital Structure in WACC
When calculating WACC, finance professionals have two choices:
To assume the company's current mix of debt and equity capital (capital structure) will persist in the future. This approach is the most common approach.
To assume a different capital structure. This is appropriate ahead of an upcoming acquisition, when the buyer is expected to change the debt-to-equity mix, or when the company is operating with a sub-optimal current capital structure. Remember that WACC is indeed a forecast — we're calculating the discount rate that should be applied to future cash flows.
Regardless of whether you use the current capital structure mix or a different once, capital structure should remain the same throughout the forecast period. For example, if a company has $125 million in debt and $250 million in equity (33% debt/66% equity) but you assume that going forward the mix will be 50% debt/50% equity, you will assume the capital structure stays 50% debt/50% equity indefinitely. Otherwise, you will need to re-calibrate a host of other inputs in the WACC estimate.
We now calculate the % mix between equity and debt in the next section.
How to Determine Market Value of Equity
If the market value of a company's equity is readily observable (i.e. for a public company), Equity value = Diluted shares outstanding x share price
If the market value of is not readily observable (i.e. for a private company), estimate equity value using comparable company analysis.
The key point here is that you should not use the book value of a company's equity value, as this method tends to grossly underestimate the company's true equity value, and will exaggerate the debt proportion relative to equity.
How to Determine the Market Value of Debt
Most of the time, you can use the book value of debt from the company’s latest balance sheet as an approximation for the market value of debt. That's because, unlike equity, the market value of debt usually doesn't deviate too far from the book value.
But if interest rates have changed substantially since debt issuance, the market value of debt could have deviated from book values materially.
In this case, use the market price of the company’s debt if it is actively traded.
How to Determine Debt and Equity Mix (D/E Ratio)
Armed with both debt value and equity value, you can calculate the debt and equity mix as:
Debt % mix = Debt / (Debt + Equity)
Equity % mix = Equity / (Debt + Equity)
How to Calculate Cost of Debt Ratio
We now turn to calculating the costs of capital, and we'll start with the cost of debt. With debt capital, quantifying risk is fairly straightforward because the market provides us with readily observable interest rates.
For example, a company might borrow $1 million at a 5.0% fixed interest rate paid annually for 10 years.
From the borrower’s (company’s) perspective, the cost of debt is how much it has to pay the lender to get the debt. The cost of debt in this example is 5.0%.
From the lender’s perspective, 5.0% represents its expected return, which is based on an analysis of the risk of lending to the company. The higher the risk, the higher the required return.
However, unlike our overly simple cost-of-debt example above, we cannot simply take the nominal interest rate charged by the lenders as a company’s cost of debt.
That’s because the cost of debt we’re seeking is the rate a company can borrow at over the forecast period. That rate may be different than the rate the company currently pays for existing debt.
Specifically, the cost of debt might change if market rates change or if the company’s credit profile changes. Therefore, don’t look at current nominal coupon rates.
Here's how you calculate the cost of debt:
Companies with publicly traded debt (bonds): The cost of debt should reflect the yield to maturity (YTM) on the company’s long-term debt. Bloomberg is a good source for YTM.
Companies that do not have public debt but have a credit rating: Use the default spread associated with that credit rating and add to the risk-free rate to estimate the cost of debt. Credit agencies such as Moody’s and S&P provide yield spreads over U.S. treasuries by credit rating.
Companies with no rating: Use the interest rate on their latest long-term debt or calculate the company’s interest coverage ratio (EBIT/interest) and apply the default spread for the credit rating most closely associated with your company’s interest coverage ratio. Damodaran Online publishes a table that lets you map a credit rating based on interest coverage.
How the Interest Tax Shield Affects WACC
Notice in the Weighted Average Cost of Capital (WACC) formula above that the cost of debt is adjusted lower to reflect the company’s tax rate.
For example, a company with a 10% cost of debt and a 25% tax rate has a cost of debt of 10% x (1-0.25) = 7.5% after the tax adjustment.
That’s because the interest payments companies make are tax deductible, thus lowering the company’s tax bill.
Ignoring the tax shield ignores a potentially significant tax benefit of borrowing and would lead to undervaluing the business.
Marginal vs. Effective Tax Rate: What is the Difference?
Because the WACC is the discount rate in the DCF for all future cash flows, the tax rate should reflect the rate we think the company will face in the future.
This may or may not be similar to the company’s current effective tax rate. Before we explain how to forecast, let’s define effective and marginal tax rates, and explain why differences exist in the first place:
Effective tax rate = GAAP taxes / GAAP pretax income
Marginal tax rate = Statutory tax rate (21% + state and local taxes in the United States)
The difference occurs for a variety of reasons. Companies may be able to use tax credits that lower their effective tax. In addition, companies that operate in multiple countries will show a lower effective tax rate if operating in countries with lower tax rates.
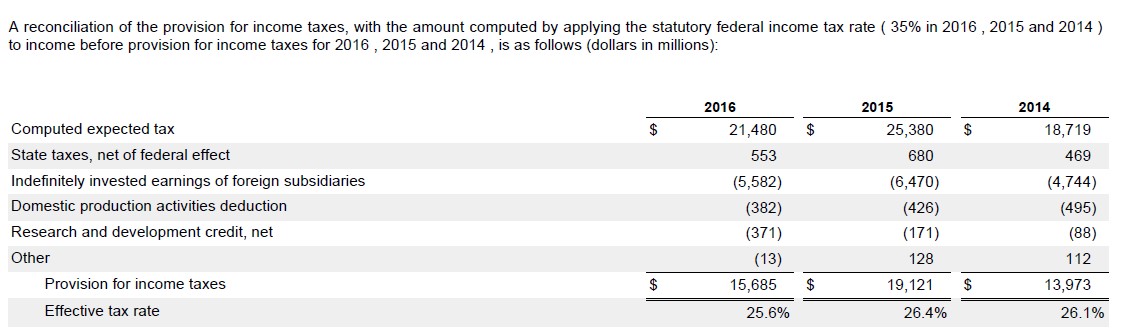
Below is an example reconciling Apple’s effective tax rate to the marginal rate in 2016 (notice the marginal tax rate was 35%, as this report was before the tax reform of 2017 that changed corporate tax rates to 21%):
As you can see, the effective tax rate is significantly lower because of the lower tax rates the company faces outside the United States.
If the current effective tax rate is significantly lower than the statutory tax rate and you believe the tax rate will eventually rise, slowly ramp up the tax rate during the stage-1 period until it hits the statutory rate in the terminal year. If, however, you believe the differences between effective and marginal taxes will endure, use the lower tax rate.
How to Calculate Cost of Equity Ratio
The cost of equity is far more challenging to estimate than the cost of debt. In fact, multiple competing models exist for estimating the cost of equity: Fama-French, Arbitrary pricing theory (APT), and the Capital Asset Pricing Model (CAPM).
The CAPM, despite suffering from some flaws and being widely criticized in academia, remains the most widely used equity pricing model in practice.
Before diving into the CAPM, let’s first understand why the cost of equity is so challenging to estimate in the first place.
Companies raise equity capital and pay a cost in the form of dilution. Equity investors contribute equity capital with the expectation of getting a return at some point down the road.
The riskier future cash flows are expected to be, the higher the returns that will be expected. However, quantifying the cost of equity is far trickier than quantifying the cost of debt.
That’s because unlike debt, which has a clearly defined cash flow pattern, companies seeking equity do not usually offer a timetable or a specific amount of cash flows the investors can expect to receive.
This creates a major challenge for quantifying the cost of equity. At the same time, the importance of accurately quantifying the cost of equity has led to significant academic research. There are now multiple competing models for calculating the cost of equity.
Capital Asset Pricing Model (CAPM)
The capital asset pricing model (CAPM) is a framework for quantifying the cost of equity.
The CAPM divides risk into two components:
Unsystematic (company-specific) risk: Risk that can be diversified away (so ignore this risk).
Systematic risk: The company’s sensitivity to market risk can’t be diversified away, so investors will demand returns for assuming this risk.
Since the CAPM essentially ignores any company-specific risk, the calculation for the cost of equity is simply tied to the company’s sensitivity to the market. The formula for quantifying this sensitivity is as follows.
Cost of Equity Formula
Cost of equity = Risk free rate +[β x ERP]
β (“beta”) = A company’s sensitivity to systematic risk
ERP (“Equity risk premium”) = The incremental risk of investing in equities over risk-free securities
Risk-Free Rate (rf)
The risk-free rate should reflect the yield of a default-free government bond of equivalent maturity to the duration of each cash flow being discounted.
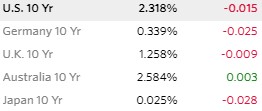
The current yield on a U.S. 10-year bond is the preferred proxy for the risk-free rate for U.S. companies. For European companies, the German 10-year is the preferred risk-free rate. The Japan 10-year is preferred for Asian companies.
Yields on Government Bonds (Source: WSJ, 11/6/2017)
Equity Risk Premium (ERP)
How much extra return above the risk-free rate do investors expect for investing in equities in general?
For example, if you plan to invest in the S&P 500 — a proxy for the overall stock market — what kind of return do you expect? Certainly, you expect more than the return on U.S. treasuries, otherwise, why take the risk of investing in the stock market? This additional expected return that investors expect to achieve by investing broadly in equities is called the equity risk premium (ERP) or the market risk premium (MRP).
But how is that risk quantified? The prevalent approach is to look backward and compare historical spreads between S&P 500 returns and the yield on 10-year treasuries over the last several decades. The logic is that investors develop their return expectations based on how the stock market has performed in the past.
There are a variety of ways of slicing and dicing past returns to arrive at an ERP, so there isn’t one generally recognized ERP. Below we list the sources for estimating ERPs.
Damodaran: Provides ERPs for free
Morningstar/Ibbotson: Provides a yearbook with various ERPs for a fee
Duff & Phelps: Provides ERPs for a fee
The ERP usually ranges from 4-6%.
Size and Country Risk Premiums
In practice, additional premiums are added to the ERP when analyzing small companies and companies operating in higher-risk countries:
Cost of equity = risk-free rate + SCP + CRP +β x ERP
Where:
SCP = small company premium
CRP =country risk premium
Premium Above ERP
Mid-cap ($800m-4b)
0.5%
Small cap ($200m-800m)
1.0%
Micro-cap (<$200m)
2.5%
Source: Ibbotson
Country Risk Premium (CRP)
United States
0.0%
United Kingdom
0.5%
Germany
0.0%
Australia
0.0%
France
0.5%
China
1.1%
India
3.4%
Middle East
1.4%
Eastern Europe
3.1%
Brazil
3.0%
Africa
5.9%
Source: Damodaran
How to Calculate Beta (Systematic Risk)
The final calculation in the cost of equity is beta. It is the only company-specific variable in the CAPM.
Beta in the CAPM seeks to quantify a company’s expected sensitivity to market changes. For example, a company with a beta of 1 would expect to see future returns in line with the overall stock market.
Meanwhile, a company with a beta of 2 would expect to see returns rise or fall twice as fast as the market. In other words, if the S&P were to drop by 5%, a company with a beta of 2 would expect to see a 10% drop in its stock price because of its high sensitivity to market fluctuations.
The higher the beta, the higher the cost of equity, because the increased risk investors take (via higher sensitivity to market fluctuations), should be compensated via a higher return.
Raw (Historical) Beta
How do investors quantify the expected future sensitivity of the company to the overall market?
Just as with the estimation of the equity risk premium, the prevailing approach looks to the past to guide expected future sensitivity.
For example, if a company has seen historical stock returns in line with the overall stock market, that would make for a beta of 1. You would use this historical beta as your estimate in the WACC formula.
The problem with historical beta is that the correlations between the company’s stock and the overall stock market end up being pretty weak.
There are several sources for beta:
Barra
Bloomberg
S&P
All of these services calculate beta based on the company’s historical share price sensitivity to the S&P 500, usually by regressing the returns of both over 60 months.
Adjusted Beta
The problem with historical beta is that the correlation between the company’s stock and the overall stock market ends up being pretty weak.
The reason for this is that in any given period, company-specific issues may skew the correlation.
For example, while you might expect a luxury goods company’s stock to rise in light of positive economic news that drives the entire stock market up, a company-specific issue (say mismanagement at the company) may skew the correlation.
Thus, relying purely on historical beta to determine your beta can lead to misleading results. Remember, you’re trying to come up with what beta will be.
To address this, Bloomberg, Barra and other services that calculate beta have tried to come up with improvements to arrive at “adjusted beta.” The adjusted beta is essentially a historical beta calculation massaged to get the beta closer to 1. This is only a marginal improvement to the historical beta.
no beta is available for private companies because there are no observable share prices. That’s where the industry beta approach comes in.
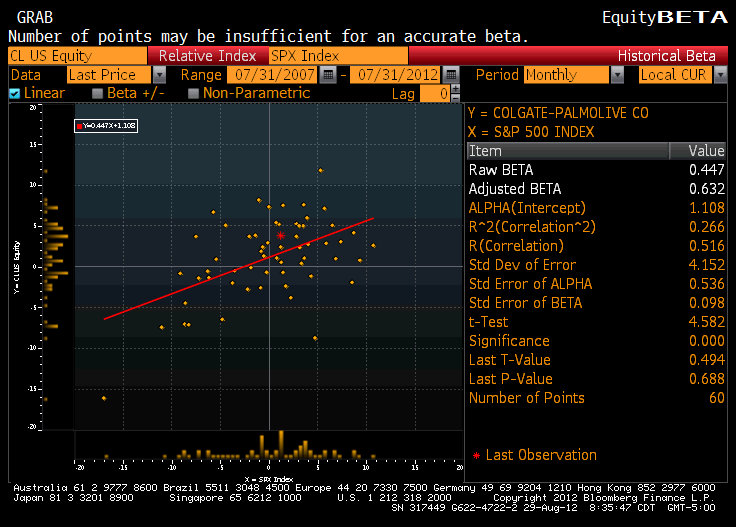
Below, we see a Bloomberg screen showing Colgate's raw and adjusted beta. Bloomberg calculates beta by looking at the last 5 years' worth of Colgate's stock returns and compares them to S&P returns for the same period.
Using beta as a predictor of Colgate's future sensitivity to market change, we would expect Colgate's share price to rise by 0.632% for a 1% increase in the S&P 500.
For the statisticians among you, notice Bloomberg also includes r squared and standard errors for this relationship, which shows you how reliable beta is as a predictor of the future correlation between the S&P and Colgate's returns. A regression with an r squared of 0.266 is generally considered very uncorrelated (an r squared of 1 is a perfect correlation, while 0 is no correlation).
Industry Beta Approach
Despite the attempts that beta providers like Barra and Bloomberg have made to try and mitigate the problem outlined above, the usefulness of historical beta as a predictor is still fundamentally limited by the fact that company-specific noise will always be commingled into the beta.
Making matters worse is that as a practical matter, no beta is available for private companies because there are no observable share prices. That’s where the industry beta approach comes in.
The industry beta approach looks at the betas of public companies that are comparable to the company being analyzed and applies this peer-group derived beta to the target company. This approach eliminates company-specific noise. It also enables one to arrive at a beta for private companies (and thus value them).
Unlevered to Levered Beta Formula
The main challenge with the industry beta approach is that we cannot simply average up all the betas. That's because companies in the peer group will likely have varying rates of leverage.
Unfortunately, the amount of leverage (debt) a company has significantly impacts its beta.
The higher the leverage, the higher the beta, all else being equal.
Fortunately, we can remove this distorting effect by unlevering the beta of the peer group and then relevering the unlevered beta at the target company's leverage ratio. We do this as follows.
Unlevering Peer Group Beta
For each company in the peer group, find the beta (using Bloomberg or Barra as described in approach #2), and unlever using the debt-to-equity ratio and tax rate specific to each company using the following formula:
Once all the peer group betas have been unlevered, calculate the median unlevered beta and relever this beta using the target company's specific debt-to-equity ratio and tax rate using the following formula:
β Levered = β(Unlevered) x [1+(Debt/Equity) (1-T)]
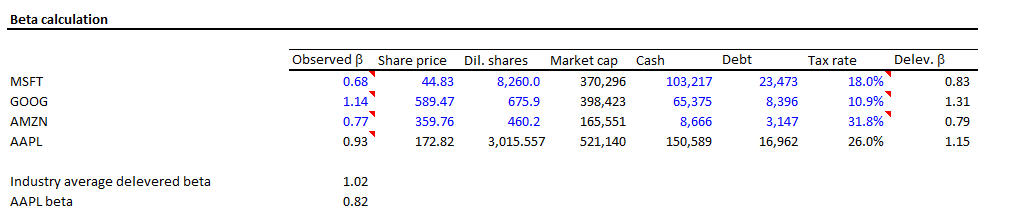
This approach will yield a beta that is usually more reliable than the beta obtained from the other approaches we've described. In our complete step-by-step financial modeling training program we build a fully integrated financial model for Apple and then, using a DCF valuation, we estimate Apple's value. Part of the work involves calculating an industry beta from Apple's peer — here's what that looks like:
Notice how Apple's observed beta was 0.93 but the relevered industry beta was more than 10% lower: 0.82. Believe it or not, that can have a significant impact on Apple's valuation.
WACC Calculation Example: Apple (AAPL)
The weighted average cost of capital (WACC) is a critical assumption in valuation analyses.
The assumptions that go into the WACC formula often make a significant impact on the valuation model output.
In this guide, we've broken down all the components of WACC and addressed many of the nuances that financial analysts must keep in mind.
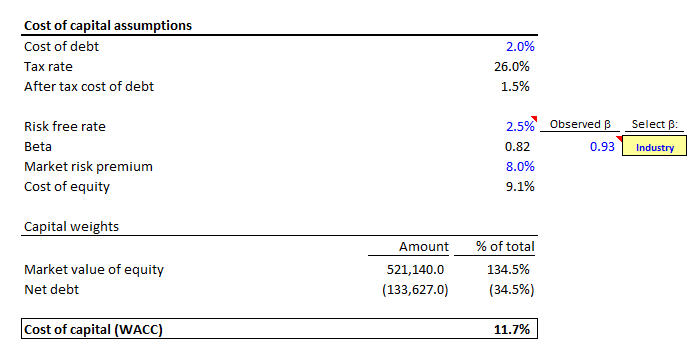
Let's now take a look at a few screenshots from the model we build in our complete step-by-step financial modeling training program to see exactly how 1) Apple's WACC is calculated and 2) How the WACC calculation directly impacts Apple's valuation:
According to our estimate, Apple's WACC is 11.7%. Notice the user can choose from an industry beta approach or the traditional historical beta approach. In addition, notice that in this particular scenario, we are using an 8% equity risk premium assumption. This is very high; Recall we mentioned that 4-6% is a more broadly acceptable range. The impact of this will be to show a lower present value of future cash flows.
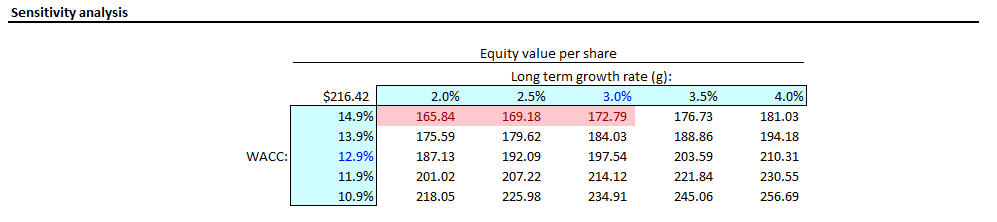
Let's now look at a sensitivity analysis to see how sensitive Apple's valuation is to changes in the WACC assumptions (as well as the long-term growth assumption):
Continue Reading Below
Step-by-Step Online Course
Everything You Need To Master Financial Modeling
Enroll in The Premium Package: Learn Financial Statement Modeling, DCF, M&A, LBO and Comps. The same training program used at top investment banks.
Should you include accounts payable or other current liabilities in the debt figure used for WACC?
No, standard current liabilities like accounts payable and deferred revenue should not be included in the debt figure used for WACC, since these aren't interest-bearing obligations that carry a cost of capital. However, short-term debt, commercial paper, and the current portion of long-term debt that show up within current liabilities on the balance sheet should be included, since these do represent interest-bearing debt even though they're due within a year.
Should you use total debt or only long-term debt when calculating WACC?
Total debt should be used when calculating WACC, not just the long-term portion. This includes both short-term and long-term interest-bearing debt, since all of it represents capital the company is paying a cost to use, regardless of maturity. Limiting the calculation to only long-term debt would understate the company's true debt load and distort the capital structure weighting in the WACC formula.
How do you calculate WACC for a company with negative net debt (more cash than debt)?
A company with more cash than debt can still have a standard WACC calculation, since WACC is based on the weighting of gross debt and equity in the capital structure, not net debt. Some analysts choose to net debt against cash when calculating leverage ratios and beta, which is a legitimate alternative approach, but the key is to stay consistent, using the same gross or net methodology throughout the entire calculation rather than mixing the two.
Does a company's net operating loss (NOL) carryforward affect its WACC?
No, a net operating loss carryforward shouldn't be baked into the tax rate used in the WACC calculation. Instead, NOLs are typically valued as a separate asset in a valuation, since they represent a distinct source of future tax savings rather than a permanent reduction in the company's ongoing tax rate. Treating the tax rate as artificially low because of an NOL would understate future cash flows once the NOL is fully used up.
How do you calculate WACC for a private company without observable market values?
For a private company, the cost of equity typically relies on the industry beta approach, using unlevered betas from comparable public companies and relevering them at the private company's own debt-to-equity ratio, since no market price exists to calculate a beta directly. The capital structure itself is usually estimated using the target or average debt-to-equity mix of comparable public companies in the same industry, rather than the private company's own book values, which can understate true equity value.
What's a reasonable WACC range for most companies?
Most established public companies have a WACC somewhere between 7% and 12%, though this varies significantly based on industry, size, and the company's specific mix of debt and equity. Capital-intensive, stable businesses with predictable cash flows tend to sit toward the lower end of that range, while smaller, riskier, or high-growth companies typically have a WACC well above 12% to reflect the added uncertainty in their future cash flows.
How does WACC differ between industries?
Capital-intensive, stable industries like utilities and regulated infrastructure tend to have lower WACCs, since they can support more debt at lower rates and their cash flows are relatively predictable. Technology and biotech companies, by contrast, typically have higher WACCs, since they often carry less debt, have higher betas reflecting more volatile stock performance, and face greater uncertainty in their future cash flows. This is why comparing WACCs across unrelated industries isn't particularly meaningful, and analysts instead benchmark a company's WACC against close industry peers.
Why does WACC generally increase if a company takes on too much debt?
Adding debt initially lowers WACC because debt is typically cheaper than equity and benefits from the interest tax shield, but beyond a certain point, additional debt increases the risk of financial distress, which drives up both the cost of debt and the cost of equity as investors demand higher returns to compensate for that added risk. This creates a tradeoff where WACC tends to decline with moderate leverage but eventually rises again once a company takes on more debt than its cash flows can comfortably support.
How do you calculate WACC for a company with operations across multiple countries?
For a multinational company, a common approach is to calculate a separate WACC for each country where the company generates significant revenue, incorporating that country's specific risk-free rate and country risk premium, and then blend those figures into a single weighted WACC based on the proportion of revenue or cash flow generated in each region. This is more accurate than using a single domestic WACC for a company with substantial international exposure, since it reflects the varying risk levels of operating across different economic and regulatory environments.
Is a higher or lower WACC better for a company?
A lower WACC is generally better for a company, since it means the company can raise capital more cheaply and its future cash flows get discounted at a lower rate, resulting in a higher valuation. That said, WACC isn't something a company should try to minimize at any cost, since taking on excessive debt to artificially lower WACC increases financial risk and can eventually backfire by driving up the cost of both debt and equity once lenders and investors start pricing in that added risk.
How to compute the total amount of debt in the company’s capital structure that will meet WACCof 10%?
GIven:
Total equity = $2,000,000
Before tax of debt is 7%
Cost of equity is 16%
Corporate income tax rate is 17%
I calculate cost of debt is 5.81%, but I do not know how to work out the rest. Please guide me. Thank you.
Haseeb Chowdhry
June 11, 2018 9:55 am
Susan,
We need to know the amount of debt outstanding to be able to decipher weights of debt and equity in the business, b/c the WACC formula is:
(After Tax Cost of Debt) * (% Debt) + (Cost of Equity) * (% Equity)
Hope this helps – thanks.
– Haseeb
Aakriti Thapa
December 19, 2019 10:08 pm
how to find WACC of a company if a company has $720 million in common stock outstanding. Its cost of equity is 12%. Moreover, it has $360 million in 6% coupon rate bonds outstanding. The bond is currently sold at par. There are no taxes in the country in which the company operates.
Jeff Schmidt
December 22, 2019 7:32 pm
Aakriti:
You have everything you need to calculate WACC but you would just ignore the tax shield if it is not applicable.
Best,
Jeff
Jasil
June 3, 2021 11:58 pm
I want to know if current liabilities included in calculation of inluded in determination of total debt to be used in calculation of WACC
Jeff Schmidt
June 4, 2021 12:14 pm
Jasil:
Under Current Liabilities you might see short-term debt, commercial paper or current portion of long-term debt. These should be included when calculating the debt weighting in WACC. Current liabilities like accounts payable or deferred revenue are not included in the WACC calculation.
Best,
Jeff
Mohd
January 16, 2020 3:11 am
Can you help in this question below, WACC is calculated to me as 12.5892.. Is it correct
The management of “BK” company is evaluating an investment project that will give a return of 15%. The project requires 10 million LE as a total investments that will be financed as follows:
6 million LE as a common stocks with a par value of 5 LE & a market value of 6 LE, with an expected cost of 13%.
100,000 shares of preferred stocks, at a par value of 10, a dividend of 10%, and market value of 8.
The rest will be financed through a long-term debt; with an interest rate of 15%. The current tax rate is 20%,
What will be the weighted average cost of capital (WACC), and what is will be your investment decision.
Jeff Schmidt
January 16, 2020 10:50 am
I’m sorry but we only comment on our material.
Best,
Jeff
Rodolfo Pena
May 13, 2020 11:37 pm
Hi,
I’m very curious to what formula was used to calculate the “delev B” for Apple beta, which is 1.15. I‘m assuming you are using the unlevered formula and if you are could you explain by detail, by plugging in values into the formula, how you got to a beta of 1.15? And if it isn’t too much could you you also explain by detail how you came to the new beta of 0.82?
Thank you
Jeff Schmidt
May 14, 2020 10:43 am
Rodolfo:
We are simply using the unlevered and levered beta formulas used on the website, along with the data presented in the Beta Calculation table.
Best,
Jeff
Rodolfo Pena
May 14, 2020 10:51 am
Thanks for your response Jeff. I still don’t understand how you came up with the numbers (I plugged them myself but do not come to the same answers as you.) Is it possible for you to show in a response how you obtained the beta values by using the equations you provided? I’m getting different answers to yours and I want to understand why…
Jeff Schmidt
May 14, 2020 11:07 am
Rodolfo:
Apple unlevered beta of 1.15 = 0.93/(1+(1-.26)*(16,962-150,589)/522,088)
Apple relevered beta of 0.83 = Average industry beta of 1.02*(1+(1-.26)*(16,962-150,589)/522,088)
Best,
Jeff
Rodolfo Pena
May 14, 2020 11:20 am
Jeff thank you so much! I see where my mistake was. I didn’t subtract cash from debt. My leading up and final question is: why is the numerator (debt) calculated as (debt-cash) and not just pure debt?
Jeff Schmidt
May 14, 2020 11:38 am
Rodolfo:
You can use either approach, as long as you use the same approach (gross or net debt) when calculating WACC.
Best,
Jeff
Rodolfo Pena
May 14, 2020 4:33 pm
You’re the man. Thank you!
Jeff Schmidt
May 14, 2020 5:13 pm
Rodolfo:
You’re welcome!
Best,
Jeff
Abdel
July 26, 2020 6:35 pm
Thank you very much. It helps me understand too.
Francis
August 11, 2021 10:53 pm
if a company generates revenue from multiple countries (e.g. Italy, US and Brazil), which country’s inflation differential should we use?
Jeff Schmidt
August 12, 2021 8:25 am
Francis:
In theory it would be weighted based on where those sales are generated (i.e., calculate a Brazilian WACC then weight it as a percentage of the WACCs of other countries).
Best,
Jeff
Eugene
September 15, 2021 3:38 pm
Can you please explain in simple words on an intuitive level the painful question, when a company issues debt, then EV does not change if this money does not go to operating activities , but for example, having issued a debt today, then the next day, why is the company worth the same? Yes, it is clear that the target capital structure is used in wacc, but, for example, taking a structure similar to those whose d/e is higher, it means that EV should change, shouldn’t it? This question is very unclear, I would like at least someone to be able to fully tell why this is happening, why they want to hear at interviews that EV will not change, for me this moment is not very clear , I will be grateful for an extensive explanation!
Jeff Schmidt
September 15, 2021 4:38 pm
Eugene:
Enterprise value doesn’t change since the increase in debt is directly offset by an increase in cash. Additionally, enterprise value is capital structure neutral so any change in capital structure should (in theory) not impact enterprise value. The answer is more difficult if the debt is used to invest in operations. Assuming the company has an ROIC greater than its WACC/cost of debt, then investing the debt should have a positive impact and increase enterprise value (and equity value).
Best,
Jeff
Gorata
November 9, 2021 8:43 pm
Yes
Cory Ireland
December 30, 2021 11:46 am
If a company that I’m analyzing has a large NOL balance, should I used 0% as the tax rate in my WACC calculation?
Jeff Schmidt
December 30, 2021 2:33 pm
Cory:
No, probably not. You would separately value the NOLs.
Best,
Jeff
ALEXANDER ARAUZ
February 18, 2022 1:23 pm
For the calculation of the debt, usually in the balance sheet we find long-term debt and short-term debt. Which is correct? to consider Total debt, (short term and long term debt), or to take only long term debt for the WACC calculation?
Brad Barlow
February 18, 2022 5:56 pm
Hi, Alexander,
Use total debt for WACC.
Brad
Dancan Mbae
October 4, 2022 10:59 am
Hi please help me
JO a small manufacturing company based in perth with annual revenue less than $10,000,000. The company produces USB drives for local markets. JO announced a plan at its recent annual general meeting to produce external hard disk as a new product line. This requires an investment of $4,000,000, which the company plan to borrow from a bank at an interest of 5%. The company’s total equity is $ 11,000,000 ordinary shares, which carries 10% annual dividend. The required rate of return is 12%.
i) How much is current tax rate?
ii). weight in % for both debt and equity
iii). after tax cost of capital for debt and equity
iv). after tax weighted cost of capital for debt and equity
Brad Barlow
October 4, 2022 11:45 am
Hi, Dancan,
This looks like a case you have been given, correct? And to be clear, the required return for equity is given at 12% and the total equity dollar value of $11mm, is that the market cap? You will have to research or make an assumption about the tax rate if it is not given. Assuming the $4mm of new borrowing is the only debt, then the total debt and equity will be $15mm, or the sum of the two, then calculate the % of each. You’d then apply the tax rate to the cost of debt (assuming 5% is pre-tax?), and then calculated the WACC. Cost of equity is already after-tax.
BB
Starry
November 21, 2022 12:33 am
Hi please help me .
Company x project requires an investment of IDR 1 billion. The source of funding is IDR 400 million from own capital with a required rate of return of 15% and the rest is a loan from bank x with an interest rate of 13%. The tax rate imposed for these company is 20%.
A. after tax cost of debt
B. WACC
I already calculate WACC but i am not sure
Thankyouuu
Brad Barlow
November 21, 2022 3:05 pm
Hi, Starry,
It sounds like you have 40% equity and 60% debt, with a cost of equity of 15% and a cost of debt of 13% * (1 – 20%), so a WACC of 12.24%.
BB
Zuhaimi Othman
December 8, 2022 9:53 am
You need $500,000 to buy a new house in 15 years. What value you must have now if the compounded annually return is 8%.
Brad Barlow
December 9, 2022 4:20 pm
Hi, Zuhaimi,
You can calculate the present amount you would need to invest at 8% for 15 years to get $500K at the end by using the PV formula: $500K / (1 + 8%) ^ 15.
I must say, it’s truly a pleasure to see such a vibrant discussion on the Weighted Average Cost of Capital (WACC) here. As someone who has dedicated a significant part of their career to understanding and solving problems related to WACC, I couldn’t resist chiming in and sharing my expertise on this fascinating topic.
WACC, as many of you already know, is a crucial financial metric used to evaluate the cost of capital for a company. It takes into account the cost of debt, cost of equity, and the weight of each component to calculate the overall cost of capital. This is essential for making informed financial decisions, including project evaluations, investment analysis, and determining the minimum acceptable rate of return.
While there’s already a wealth of knowledge out there on the basics of WACC, I want to introduce you to a concept that might be somewhat unconventional: “The WACC Spectrum.”
The WACC Spectrum: A New Perspective
Think of WACC as a spectrum rather than a single number. Imagine it as a dynamic range, much like the color spectrum, where different wavelengths represent different financial states of a company. At one end of this spectrum, you have the “Cost Optimization Zone,” and at the other end, the “Growth and Innovation Zone.”
Cost Optimization Zone: In this zone, a company’s primary focus is minimizing its WACC. This is where you see a strong emphasis on reducing debt costs, streamlining operations, and cutting unnecessary expenses. Companies operating in this area are typically mature and stable, aiming to maximize profitability with existing assets.
Example: Consider a well-established utility company that has paid down its debt and has steady cash flows. Their primary goal is to minimize WACC by refinancing at lower interest rates and maintaining cost-efficient operations.
Growth and Innovation Zone: On the other side of the spectrum, you have companies that prioritize growth and innovation. These firms are willing to take on higher WACC to invest in new ventures, research and development, and market expansion. Here, WACC becomes a strategic tool for assessing the risks and potential rewards of these investments.
Example: Think of a tech startup seeking venture capital. They are willing to take on higher equity costs and short-term debt to fund innovative projects with the potential for high returns, even if it temporarily increases their WACC.
Understanding this spectrum can revolutionize how companies approach WACC. It’s not just a static number but a strategic lever to steer the ship. Companies can transition along this spectrum as they evolve and adapt to changing market conditions.
Conclusion
In conclusion, while WACC remains a fundamental concept in finance, thinking of it as a dynamic spectrum opens up new possibilities for strategic financial decision-making. Companies can use WACC to navigate the balance between cost optimization and growth, aligning their capital structure with their strategic objectives.
I hope this fresh perspective on WACC adds another layer of understanding to this complex financial metric. Feel free to ask any questions or share your thoughts, and let’s keep the discussion going. After all, it’s through innovative thinking that we continue to push the boundaries of financial knowledge.
Ignatius Komomungondo
May 10, 2024 7:10 am
A company wants to invest in a new project. The company intends to finance the project with a long-term loan bearing 10% interest per year. The company’s cost of equity is 20%, its target Debt:Equity ratio is 30:70, and the tax rate is 30%. Calculate the target weighted average cost of capital (WACC). Round the answer off to the nearest whole number.
Brad Barlow
May 12, 2024 9:18 pm
Hi, Ignatius,
This appears to be a problem you have found elsewhere, and the purpose of this article is to explain how to calculate WACC and answer questions about it, not to solve WACC problems that people bring. However, looking at your data, you have everything you need to apply the WACC formula to solve it: WACC = cost of equity * equity weight + cost of debt * (1 – tax rate) * debt weight. So you can plug your numbers in an solve it!






How to compute the total amount of debt in the company’s capital structure that will meet WACCof 10%?
GIven:
Total equity = $2,000,000
Before tax of debt is 7%
Cost of equity is 16%
Corporate income tax rate is 17%
I calculate cost of debt is 5.81%, but I do not know how to work out the rest. Please guide me. Thank you.
Susan,
We need to know the amount of debt outstanding to be able to decipher weights of debt and equity in the business, b/c the WACC formula is:
(After Tax Cost of Debt) * (% Debt) + (Cost of Equity) * (% Equity)
Hope this helps – thanks.
– Haseeb
how to find WACC of a company if a company has $720 million in common stock outstanding. Its cost of equity is 12%. Moreover, it has $360 million in 6% coupon rate bonds outstanding. The bond is currently sold at par. There are no taxes in the country in which the company operates.
Aakriti:
You have everything you need to calculate WACC but you would just ignore the tax shield if it is not applicable.
Best,
Jeff
I want to know if current liabilities included in calculation of inluded in determination of total debt to be used in calculation of WACC
Jasil:
Under Current Liabilities you might see short-term debt, commercial paper or current portion of long-term debt. These should be included when calculating the debt weighting in WACC. Current liabilities like accounts payable or deferred revenue are not included in the WACC calculation.
Best,
Jeff
Can you help in this question below, WACC is calculated to me as 12.5892.. Is it correct
The management of “BK” company is evaluating an investment project that will give a return of 15%. The project requires 10 million LE as a total investments that will be financed as follows:
6 million LE as a common stocks with a par value of 5 LE & a market value of 6 LE, with an expected cost of 13%.
100,000 shares of preferred stocks, at a par value of 10, a dividend of 10%, and market value of 8.
The rest will be financed through a long-term debt; with an interest rate of 15%. The current tax rate is 20%,
What will be the weighted average cost of capital (WACC), and what is will be your investment decision.
I’m sorry but we only comment on our material.
Best,
Jeff
Hi,
I’m very curious to what formula was used to calculate the “delev B” for Apple beta, which is 1.15. I‘m assuming you are using the unlevered formula and if you are could you explain by detail, by plugging in values into the formula, how you got to a beta of 1.15? And if it isn’t too much could you you also explain by detail how you came to the new beta of 0.82?
Thank you
Rodolfo:
We are simply using the unlevered and levered beta formulas used on the website, along with the data presented in the Beta Calculation table.
Best,
Jeff
Thanks for your response Jeff. I still don’t understand how you came up with the numbers (I plugged them myself but do not come to the same answers as you.) Is it possible for you to show in a response how you obtained the beta values by using the equations you provided? I’m getting different answers to yours and I want to understand why…
Rodolfo:
Apple unlevered beta of 1.15 = 0.93/(1+(1-.26)*(16,962-150,589)/522,088)
Apple relevered beta of 0.83 = Average industry beta of 1.02*(1+(1-.26)*(16,962-150,589)/522,088)
Best,
Jeff
Jeff thank you so much! I see where my mistake was. I didn’t subtract cash from debt. My leading up and final question is: why is the numerator (debt) calculated as (debt-cash) and not just pure debt?
Rodolfo:
You can use either approach, as long as you use the same approach (gross or net debt) when calculating WACC.
Best,
Jeff
You’re the man. Thank you!
Rodolfo:
You’re welcome!
Best,
Jeff
Thank you very much. It helps me understand too.
if a company generates revenue from multiple countries (e.g. Italy, US and Brazil), which country’s inflation differential should we use?
Francis:
In theory it would be weighted based on where those sales are generated (i.e., calculate a Brazilian WACC then weight it as a percentage of the WACCs of other countries).
Best,
Jeff
Can you please explain in simple words on an intuitive level the painful question, when a company issues debt, then EV does not change if this money does not go to operating activities , but for example, having issued a debt today, then the next day, why is the company worth the same? Yes, it is clear that the target capital structure is used in wacc, but, for example, taking a structure similar to those whose d/e is higher, it means that EV should change, shouldn’t it? This question is very unclear, I would like at least someone to be able to fully tell why this is happening, why they want to hear at interviews that EV will not change, for me this moment is not very clear , I will be grateful for an extensive explanation!
Eugene:
Enterprise value doesn’t change since the increase in debt is directly offset by an increase in cash. Additionally, enterprise value is capital structure neutral so any change in capital structure should (in theory) not impact enterprise value. The answer is more difficult if the debt is used to invest in operations. Assuming the company has an ROIC greater than its WACC/cost of debt, then investing the debt should have a positive impact and increase enterprise value (and equity value).
Best,
Jeff
Yes
If a company that I’m analyzing has a large NOL balance, should I used 0% as the tax rate in my WACC calculation?
Cory:
No, probably not. You would separately value the NOLs.
Best,
Jeff
For the calculation of the debt, usually in the balance sheet we find long-term debt and short-term debt. Which is correct? to consider Total debt, (short term and long term debt), or to take only long term debt for the WACC calculation?
Hi, Alexander,
Use total debt for WACC.
Brad
Hi please help me
JO a small manufacturing company based in perth with annual revenue less than $10,000,000. The company produces USB drives for local markets. JO announced a plan at its recent annual general meeting to produce external hard disk as a new product line. This requires an investment of $4,000,000, which the company plan to borrow from a bank at an interest of 5%. The company’s total equity is $ 11,000,000 ordinary shares, which carries 10% annual dividend. The required rate of return is 12%.
i) How much is current tax rate?
ii). weight in % for both debt and equity
iii). after tax cost of capital for debt and equity
iv). after tax weighted cost of capital for debt and equity
Hi, Dancan,
This looks like a case you have been given, correct? And to be clear, the required return for equity is given at 12% and the total equity dollar value of $11mm, is that the market cap? You will have to research or make an assumption about the tax rate if it is not given. Assuming the $4mm of new borrowing is the only debt, then the total debt and equity will be $15mm, or the sum of the two, then calculate the % of each. You’d then apply the tax rate to the cost of debt (assuming 5% is pre-tax?), and then calculated the WACC. Cost of equity is already after-tax.
BB
Hi please help me .
Company x project requires an investment of IDR 1 billion. The source of funding is IDR 400 million from own capital with a required rate of return of 15% and the rest is a loan from bank x with an interest rate of 13%. The tax rate imposed for these company is 20%.
A. after tax cost of debt
B. WACC
I already calculate WACC but i am not sure
Thankyouuu
Hi, Starry,
It sounds like you have 40% equity and 60% debt, with a cost of equity of 15% and a cost of debt of 13% * (1 – 20%), so a WACC of 12.24%.
BB
You need $500,000 to buy a new house in 15 years. What value you must have now if the compounded annually return is 8%.
Hi, Zuhaimi,
You can calculate the present amount you would need to invest at 8% for 15 years to get $500K at the end by using the PV formula: $500K / (1 + 8%) ^ 15.
BB
I must say, it’s truly a pleasure to see such a vibrant discussion on the Weighted Average Cost of Capital (WACC) here. As someone who has dedicated a significant part of their career to understanding and solving problems related to WACC, I couldn’t resist chiming in and sharing my expertise on this fascinating topic.
WACC, as many of you already know, is a crucial financial metric used to evaluate the cost of capital for a company. It takes into account the cost of debt, cost of equity, and the weight of each component to calculate the overall cost of capital. This is essential for making informed financial decisions, including project evaluations, investment analysis, and determining the minimum acceptable rate of return.
While there’s already a wealth of knowledge out there on the basics of WACC, I want to introduce you to a concept that might be somewhat unconventional: “The WACC Spectrum.”
The WACC Spectrum: A New Perspective
Think of WACC as a spectrum rather than a single number. Imagine it as a dynamic range, much like the color spectrum, where different wavelengths represent different financial states of a company. At one end of this spectrum, you have the “Cost Optimization Zone,” and at the other end, the “Growth and Innovation Zone.”
Cost Optimization Zone: In this zone, a company’s primary focus is minimizing its WACC. This is where you see a strong emphasis on reducing debt costs, streamlining operations, and cutting unnecessary expenses. Companies operating in this area are typically mature and stable, aiming to maximize profitability with existing assets.
Example: Consider a well-established utility company that has paid down its debt and has steady cash flows. Their primary goal is to minimize WACC by refinancing at lower interest rates and maintaining cost-efficient operations.
Growth and Innovation Zone: On the other side of the spectrum, you have companies that prioritize growth and innovation. These firms are willing to take on higher WACC to invest in new ventures, research and development, and market expansion. Here, WACC becomes a strategic tool for assessing the risks and potential rewards of these investments.
Example: Think of a tech startup seeking venture capital. They are willing to take on higher equity costs and short-term debt to fund innovative projects with the potential for high returns, even if it temporarily increases their WACC.
Understanding this spectrum can revolutionize how companies approach WACC. It’s not just a static number but a strategic lever to steer the ship. Companies can transition along this spectrum as they evolve and adapt to changing market conditions.
Conclusion
In conclusion, while WACC remains a fundamental concept in finance, thinking of it as a dynamic spectrum opens up new possibilities for strategic financial decision-making. Companies can use WACC to navigate the balance between cost optimization and growth, aligning their capital structure with their strategic objectives.
I hope this fresh perspective on WACC adds another layer of understanding to this complex financial metric. Feel free to ask any questions or share your thoughts, and let’s keep the discussion going. After all, it’s through innovative thinking that we continue to push the boundaries of financial knowledge.
A company wants to invest in a new project. The company intends to finance the project with a long-term loan bearing 10% interest per year. The company’s cost of equity is 20%, its target Debt:Equity ratio is 30:70, and the tax rate is 30%. Calculate the target weighted average cost of capital (WACC). Round the answer off to the nearest whole number.
Hi, Ignatius,
This appears to be a problem you have found elsewhere, and the purpose of this article is to explain how to calculate WACC and answer questions about it, not to solve WACC problems that people bring. However, looking at your data, you have everything you need to apply the WACC formula to solve it: WACC = cost of equity * equity weight + cost of debt * (1 – tax rate) * debt weight. So you can plug your numbers in an solve it!
BB