What is CAPM?
The Capital Asset Pricing Model (CAPM) estimates the expected return on an investment based on the perceived systematic risk. The cost of equity—the required rate of return for equity holders—is calculated using the CAPM.

The Capital Asset Pricing Model (CAPM) estimates the expected return on an investment based on the perceived systematic risk. The cost of equity—the required rate of return for equity holders—is calculated using the CAPM.
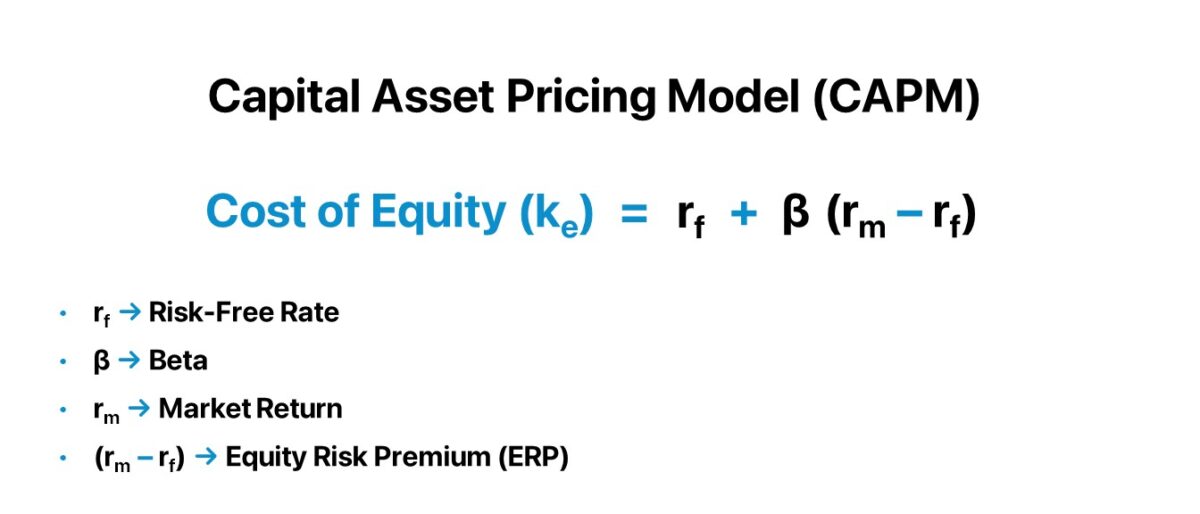
The capital asset pricing model (CAPM) is a fundamental method in corporate finance to determine the required rate of return on an equity investment given the coinciding risk profile.
In short, the CAPM establishes the relationship between the risk and expected return on an equity security based on three underlying variables:
However, the discount rate concept must be comprehended to understand the core components of the capital asset pricing model (CAPM) theory.
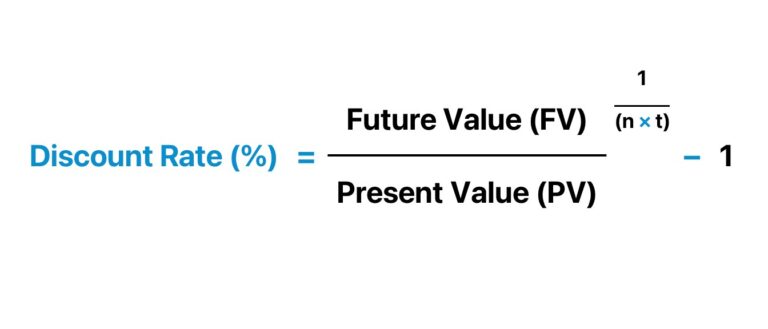
The discount rate represents the “hurdle rate” on an investment or project—i.e. the minimum rate of return corresponding to the risk profile, which could refer to share issuances by a publicly-traded company or a proposed project that a corporation is under consideration on whether to proceed.
To perform a cash flow-oriented valuation on a company, the implied intrinsic value equals the sum of its future cash flows discounted to their present value (PV) using an appropriate discount rate.
Under the specific context of equity investors, the discount rate that pertains solely to common shareholders is referred to as the “cost of equity,” which is the required rate of return to equity investors that the capital asset pricing model is used to calculate.
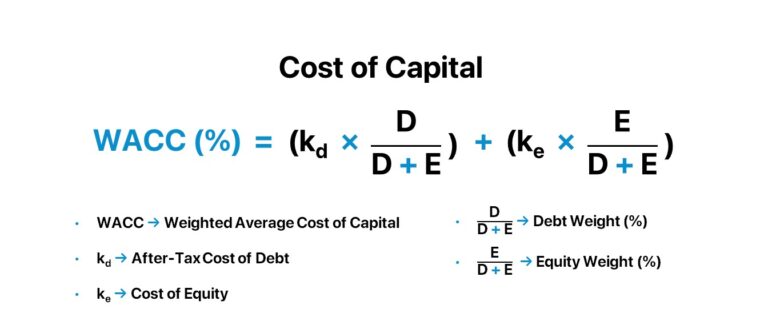
The unlevered free cash flow, or free cash flow to firm (FCFF), is generated by a company and discounted using the weighted average cost of capital (WACC), whereas levered free cash flow or free cash flow to equity (FCFE) is discounted using the cost of equity (ke).
But regardless of the type of cash flow being discounted, the cost of equity (ke) serves an integral role in either approach because it is an input in the WACC formula.
Under Modern Portfolio Theory (MPT), there are two core assumptions that underpin the capital asset pricing model (CAPM):
The cost of equity (ke) is most commonly estimated using the capital asset pricing model (CAPM), which connects the expected return on security (or portfolio of securities) to its sensitivity to the broader market.
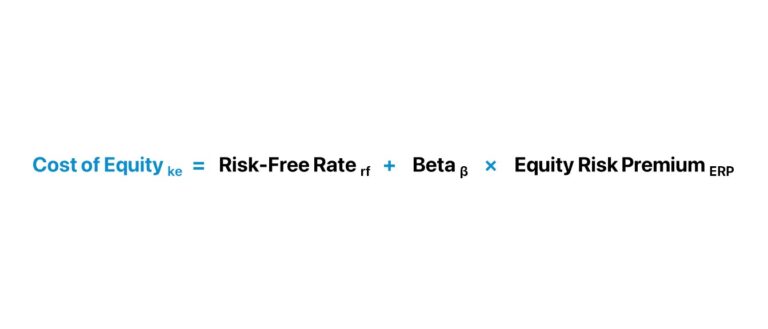
The capital asset pricing model (CAPM) formula states that the cost of equity—the return expected to be earned by common shareholders—is equal to the risk-free rate (rf) plus the product of beta and the equity risk premium (ERP).
Where:
Suppose we're computing the cost of equity (ke) using the CAPM given the following set of assumptions:
CAPM Exercise Assumptions
By entering the provided assumptions into the CAPM formula, we arrive at a cost of equity (ke) of 8.6%.
The capital asset pricing model (CAPM) equation is composed of three components:
Starting off, the risk-free rate (rf) should theoretically reflect the yield to maturity (YTM) of default-free government bonds of equivalent maturity to the duration of each cash flow being discounted.
However, due to the lack of liquidity in government bonds with the longest maturities (i.e. less trade volume and data sets), the current yield on 10-year US treasury notes has become the standard proxy for the risk-free rate assumption for companies based in the US.
In corporate finance, beta (β) measures the systematic risk of a security compared to the broader market (i.e. non-diversifiable risk).
The beta of an asset is calculated as the covariance between expected returns on the asset and the market, divided by the variance of expected returns on the market.
The relationship between beta (β) and the expected market sensitivity is as follows:
For instance, a company with a beta of 1.0 would expect to see returns consistent with the overall stock market returns. So if the market has gone up by 10%, the company should also see a return of 10%.
But if that company were to have a beta of 2.0, it would expect a return of 20%, assuming the market had gone up by 10%.
The common source of criticism is most often related to beta, as many criticize the metric as a flawed measure of risk.
Our third input, the equity risk premium (ERP), or “market risk premium,” measures the incremental risk (or excess return) of investing in equities over risk-free securities.
Since investing in risky assets such as equities comes with additional risk (i.e. potential for loss of capital), the equity risk premium serves as additional compensation for investors to have an incentive to take on the risk.
The equity risk premium has been around the 4% to 6% range, based on historical spreads between the S&P 500 returns over the yields on risk-free government bonds.
Learn how institutional investors identify high-potential undervalued stocks. Enrollment is open for the upcoming cohort.
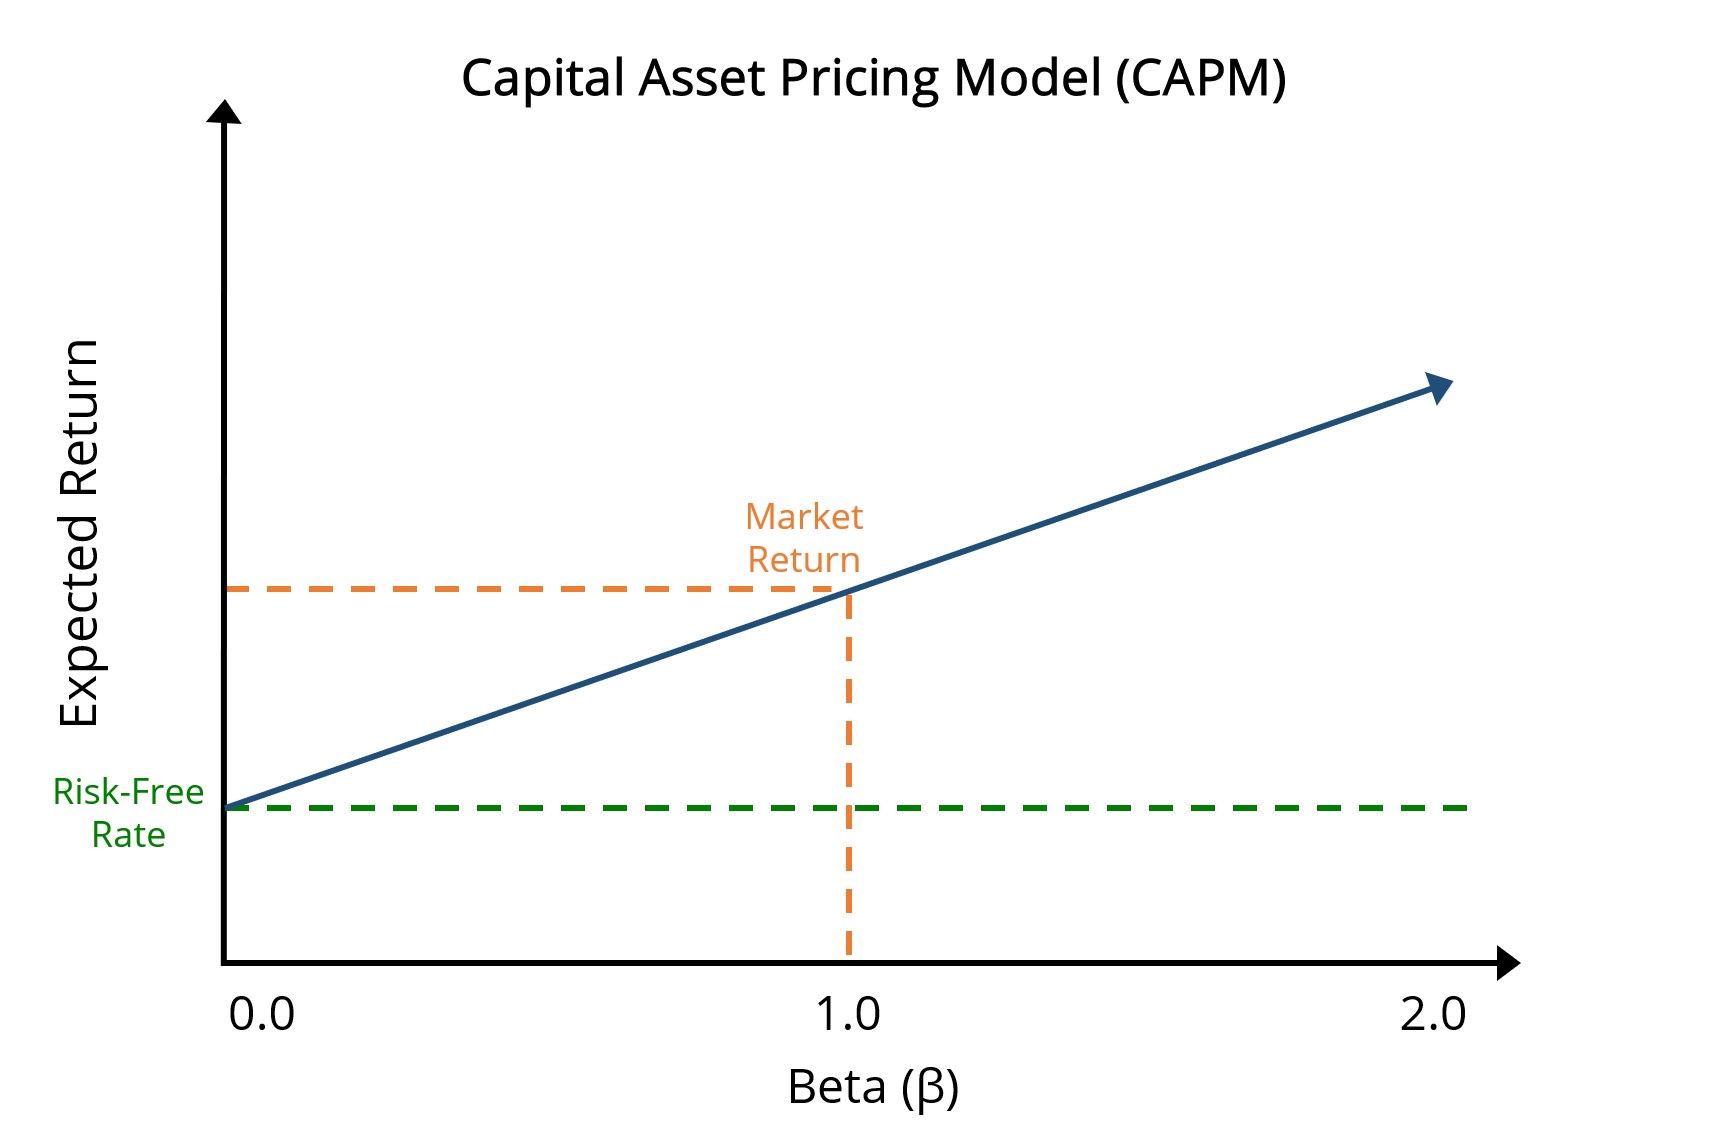
The following graph of the capital asset pricing model (CAPM) illustrates the relationship between expected returns (y-axis) and beta (x-axis).
The difference between the yield earned on the risk-free rate and the market return represents the equity risk premium (ERP).
If plotted on a chart, the capital asset pricing model (CAPM) depicts the relationship between the expected return and trade-off with regard to risk.
The CAPM graph implies the expected returns (i.e. the y-axis) rise in tandem as more risk is undertaken by the investor (i.e. the x-axis), and vice versa.
Note: The market beta is equal to 1.0 here.
Capital Asset Pricing Model Graph (CAPM)

Using the Capital Asset Pricing Model (CAPM) to estimate returns is foundational to finance, but its simplified assumptions can obscure market complexity. Artificial intelligence addresses this by analyzing large-scale market data, improving risk factor identification, and enhancing return predictions. The AI for Business & Finance Certificate Program from Wall Street Prep and Columbia Business School Executive Education provides practical instruction on integrating AI into asset pricing and investment strategy.
We’ll now move on to a modeling exercise, which you can access by filling out the form below.


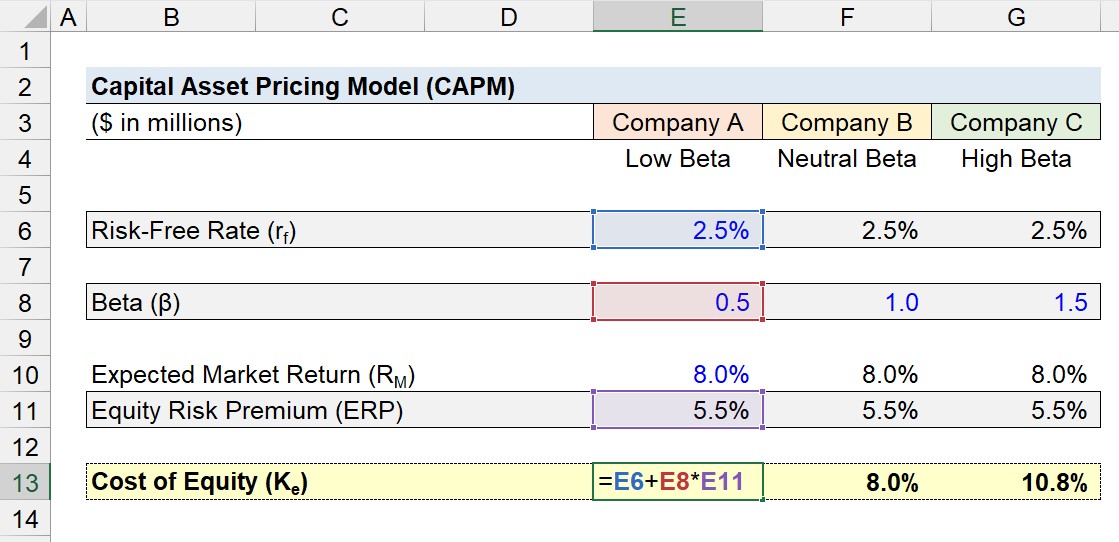
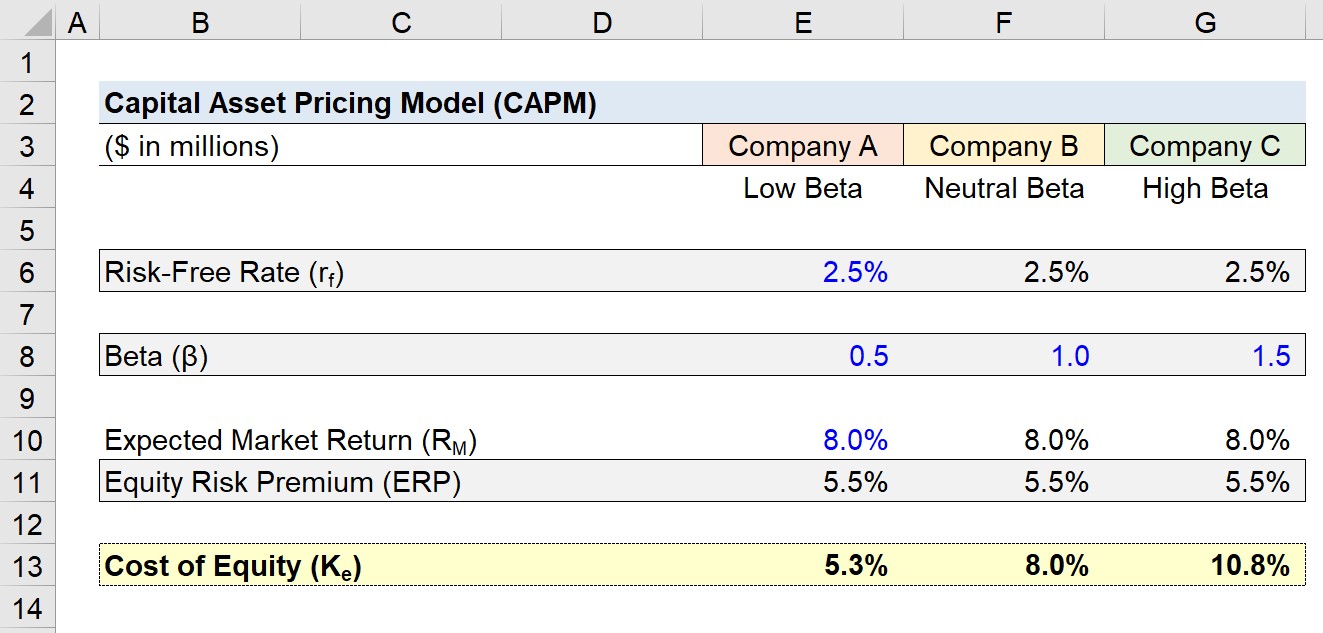
Suppose we have three companies that each share the following assumptions:
Since we’re given the expected return on the market and risk-free rate, we can calculate the equity risk premium (ERP) for each of the three companies using the formula below:
The difference in expected returns among the three companies will be attributable to the beta (i.e. systematic risk).
To calculate the cost of equity (Ke), we'll take the risk-free rate and add it to the product of beta and the equity risk premium, with the ERP calculated as the expected market return minus the risk-free rate.
For example, Company A's cost of equity can be calculated using the following equation:
Under the provided assumptions, the expected equity returns for the three companies come out to 5.3%, 8.0%, and 10.8%, respectively.
In the final section of our practice exercise in Excel, we'll review the core concepts covered in our illustrative cost of equity calculation using the capital asset pricing model (CAPM):
In conclusion, a company with a high beta implies increased risk and higher volatility relative to the overall market (i.e. greater sensitivity to market fluctuations).
Therefore, a higher cost of equity would be used by investors to discount the future cash flows generated by the company, causing a reduction to the implied valuation, all else being equal.

To calculate the CAPM,risk-free rate and add it to the product of beta and the equity risk premium, with the CAPM calculated as the expected market return minus the risk-free rate.
Is this a question or an attempted summary? CAPM estimates cost of equity (risk free rate + beta x equity risk premium).
The beta used here is the ‘levered’ beta, right?
Yes, the beta in the CAPM formula is levered beta.
BB
Thanks Brad!
You’re welcome!
Using the CAPM Model, how do you rearrange to work out the Rf rate?
Hi, Jay,
We typically treat Rf (risk-free rate) as an input for CAPM, based on current 10yr treasury rate. However, you could back into it if you took cost of equity as a given, and subtracted the market risk premium * beta.
BB
can the beta of a security, Bi be substituted for the beta of a portfolio? or would the beta of a portfolio be the sum of weighted beta’s (portfolio weighting x individual beta)
Hi, Lucky,
You can use the beta of an individual security, but an industry beta is a weighted average of delevered individual security betas.
BB
why is risk-free rate considered in calculating capm?
Hi, Btrice,
Think of it as an opportunity cost. An investor could invest in treasury securities where the interest and principal payments are virtually guaranteed, so in order to invest in a stock instead, they will have to consider how much they could have earned (the risk free rate) and factor that into their discount rate.
BB
HI, If we have to make a valuation for another 5 years on a company based on the above formula, where to look for the data and values I mean which sheets should I look for
Hi, Rashmeet,
Could you be more specific? Do you mean where would you look for the information to calculate cost of equity using CAPM? If it is a public company, you could find beta on Yahoo Finance (or similar open source), find the latest 10yr UST yield for the risk free rate, and search for the latest equity risk premium from Duff & Phelps.
BB