What is Market Volatility?
Market Volatility describes the magnitude and frequency of pricing fluctuations in the stock market and is most often used by investors to gauge risk by helping to predict future price movements.

Market Volatility describes the magnitude and frequency of pricing fluctuations in the stock market and is most often used by investors to gauge risk by helping to predict future price movements.
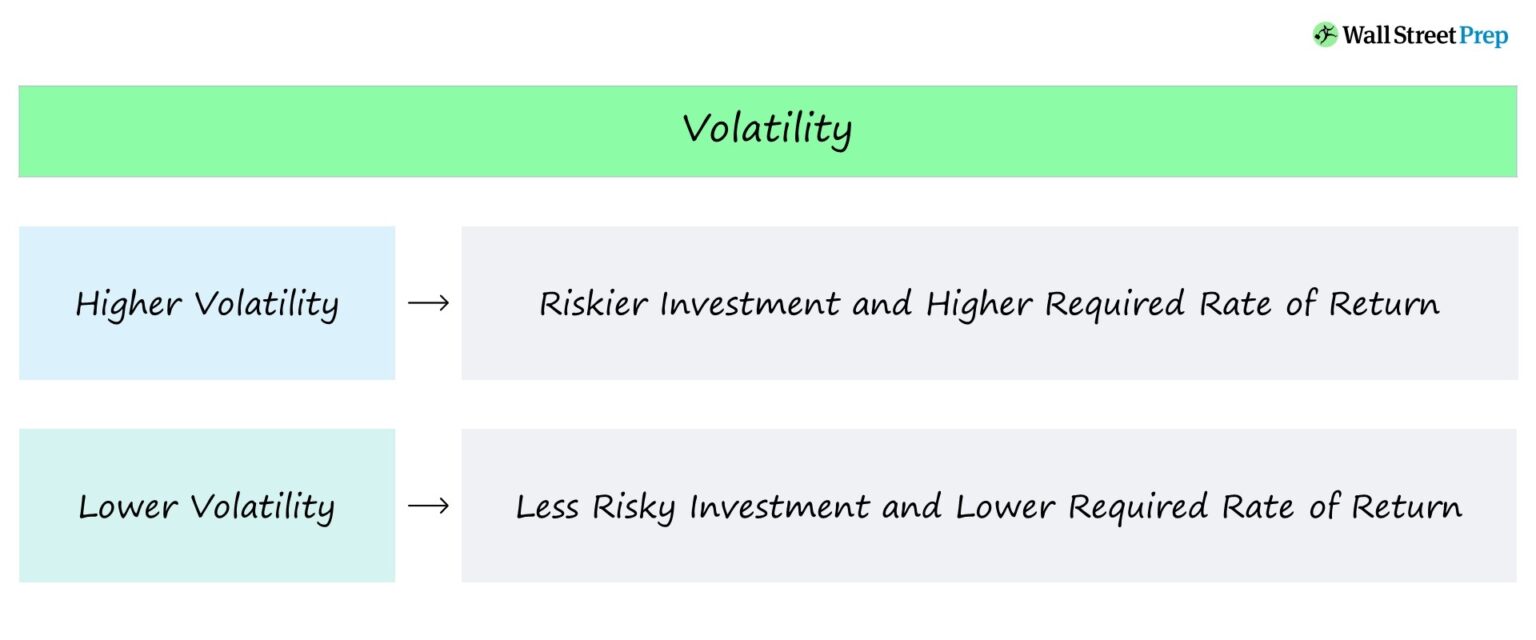
Market volatility measures the frequency and magnitude of movements in asset prices – i.e. the size and rate of "swing-like" fluctuations.
Volatility is inherent to all asset values in the stock market and is a critical component of investing.
In the context of the stock market, volatility is the rate of fluctuations in a company's share price (i.e. equity issuances) in the open markets.
The relationship between volatility and the perceived investment risk is the following:
If a company's share price has historically undergone dramatic swings in pricing on a frequent basis, the stock would be considered to be volatile.
By contrast, if a company's share price has remained stable with minimal deviation over time, the stock possesses low volatility, i.e. the share's value does not fluctuate significantly or change frequently.
The price of an asset is a function of supply and demand in the markets, so the root cause of volatility is uncertainty among investors.
Said differently, for volatile stocks, sellers are unsure where to set the asking price, and buyers are not certain what a reasonable bid price would be.
Furthermore, factors such as seasonality, cyclicality, market speculation, and unexpected events can affect the amount of uncertainty in the market.
Learn how institutional investors identify high-potential undervalued stocks. Enrollment is open for the upcoming cohort.
Investing is the act of balancing risk and reward, so the potential for outsized gains cannot exist without the possibility of incurring substantial losses.
If a company's share price is constantly fluctuating, selling the investment for a profit (i.e. capital gain) requires "timing the market" properly and avoiding any unfavorable directional changes.
Otherwise, the investor could be forced to hold the investment for an extended period of time, which makes the stock a less attractive opportunity.
In effect, investors demand a higher rate of return to compensate for undertaking more uncertainty, i.e. a higher cost of equity.
Volatility can be separated into two distinct measures:
In practice, implied volatility (IV) holds more weight than historical volatility due to being a forward-looking rather than a backward-looking statistical gauge calculated from past price changes.
The implied volatility in the broader market can be affected by events such as
In valuation, one common measure of volatility is called "beta (β)" – which is defined as the sensitivity of a security (or portfolio of securities) to systematic risk relative to the broader market.
Most practitioners use the S&P 500 as the proxy market return to compare against a particular company's stock price data.
The difference between systematic and unsystematic risk is explained below:
Beta depicts the correlation between a particular stock's price and the S&P 500 ("the market"), which is interpreted using the following guidelines.
The implied volatility and beta are both measurements of a stock's volatility.
The Chicago Board Options Exchange (CBOE) created the Volatility Index (VIX) in 1993.
Since then, the VIX is one of the most frequently used to gauge market volatility and investor sentiment by market participants such as traders and investors.
The VIX estimates the S&P's implied volatility by looking at the prices of options on the underlying equities tracked within a 30-day time frame, which is then annualized to determine a formal prediction.
The implied volatility attempts to quantify the volatility expectations by options traders (i.e. put and call options) – hence, the VIX is often referred to as the "fear index."
Often, if the VIX is high, the stock prices in the market fall, and investors allocate more of their capital to fixed-income securities (e.g. treasury bonds, corporate bonds) and "safe havens" like gold.
For example, the impact of the COVID pandemic in early 2020 (i.e. the sudden spike) can clearly be seen in the VIX chart below.
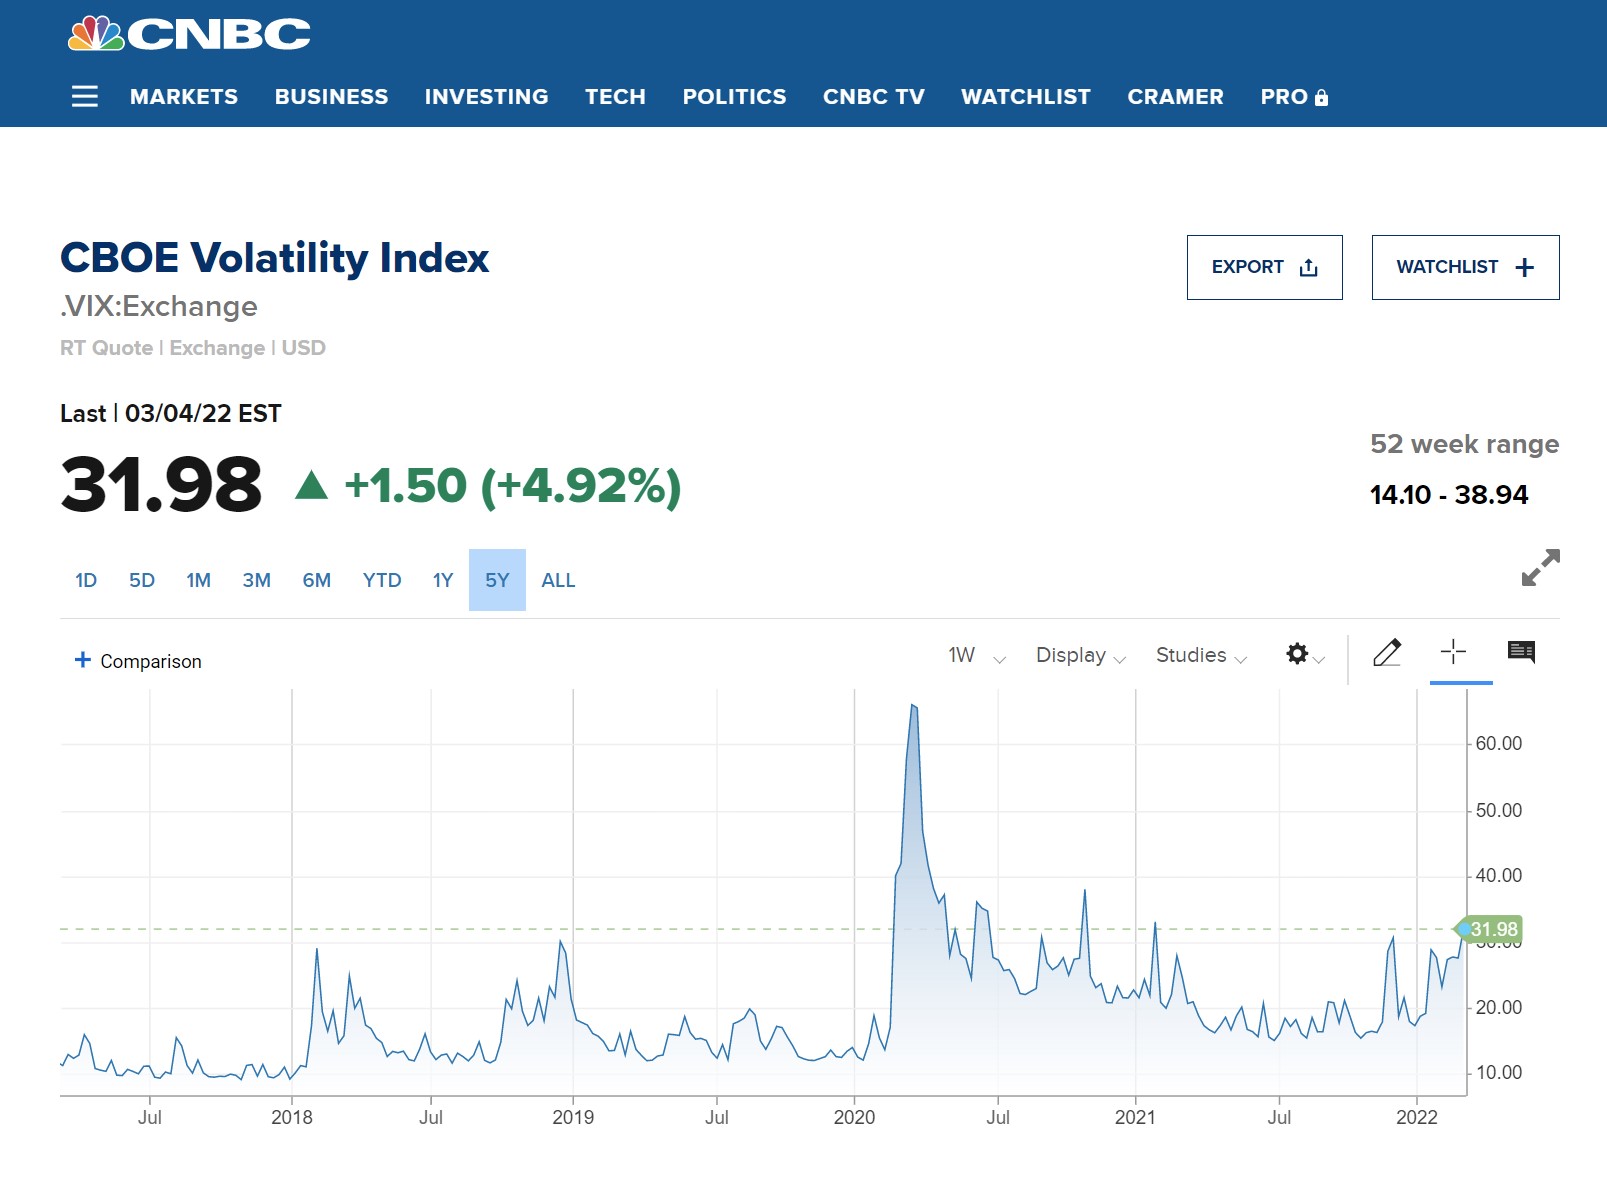
CBOE VIX Chart (Source: CNBC)
Leading up to a company's earnings report, the implied volatility tends to increase substantially (i.e. options activity and variance), especially for high-growth equities.
The implied volatility can be derived by looking at the pricing of options, with the general rules of thumb listed below:
Volatility is not inherently a negative sign for investors, but investors must still understand that the potential for outsized returns comes at the cost of incurring significant losses.


No comments yet.