A financial model is a great way to assess the performance of a business on both a historical and projected basis. It provides a way for the analyst to organize a business’s operations and analyze the results in both a “time-series” format (measuring the company’s performance against itself over time) and a “cross-sectional” format (measuring the company’s performance against industry peers).
Generate Key Takeaways
Typically, once an analyst inputs both historical financial results and assumptions about future performance, he/she can then calculate and interpret various ratio analyses, and other operational performance metrics such as profit margins, inventory turnover, cash collections, leverage and interest coverage ratios, among others.
General Rule of Thumb in Sensitivity Analysis
A scenario manager allows the analyst to “stress-test” the financial results because the reality is that expectations can and usually do change over time.
In previous articles, we discussed the fact that these forward-looking assumptions may not always hold true, and that the use of a scenario manager is a great way to incorporate several performance possibilities into your financial model. This allows the analyst to “stress-test” the financial results because the reality is that expectations can and often do change over time. Because the future cannot be predicted with any certainty, it's never a good idea to take your financial model’s results and claim, either to your boss or to your client, that the results are final.
So what can you do if the financial model’s results are not the final results? Isn’t that why you build a model in the first place — to get some clarity or answer as to the future performance of the business? Yes and no. The purpose of the financial model is to provide some insight into future performance, but there is no one correct answer. Clients and managing directors like to see a range of possible outcomes, and this is where the sensitivity analysis, or “what-if” analysis comes into play.
Data Table Format: Endless Possibilities in Analysis
It's not unusual for a client to never even look at a financial model and opt to see the results presented in a data table format.
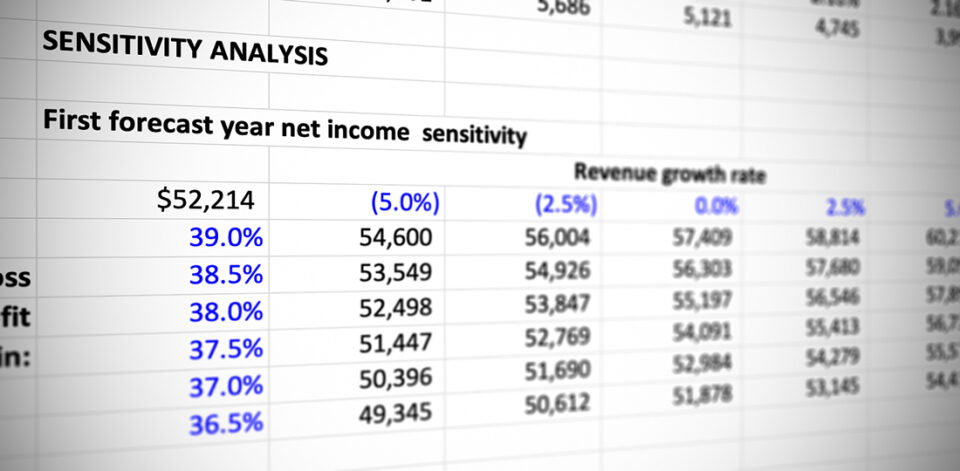
A sensitivity analysis, otherwise known as a "what-if" analysis or a data table, is another in a long line of powerful Excel tools that allows a user to see what the desired result of the financial model would be under different circumstances. It allows the user to select two variables, or assumptions, in the model and see how a desired output, such as earnings per share (a common metric used) would change based on the new assumptions. It is the perfect complement to a scenario manager, adding even more flexibility to one’s financial and valuation models when it comes to analysis and presentation.
In fact, it's not unusual for a client to never even look at a financial model and opt to see the results presented in a data table format along with select financial data. This is why it's important for the analyst to understand the mechanics of creating the data table and be able to interpret its results to make sure the analysis is working properly. We shall go over the mechanics of the data table next.
Sensitivity Analysis Data Table – Excel Template
Use the form below to download our sample Data Table:
You’re logged in! Form submission not required. Access your file below.
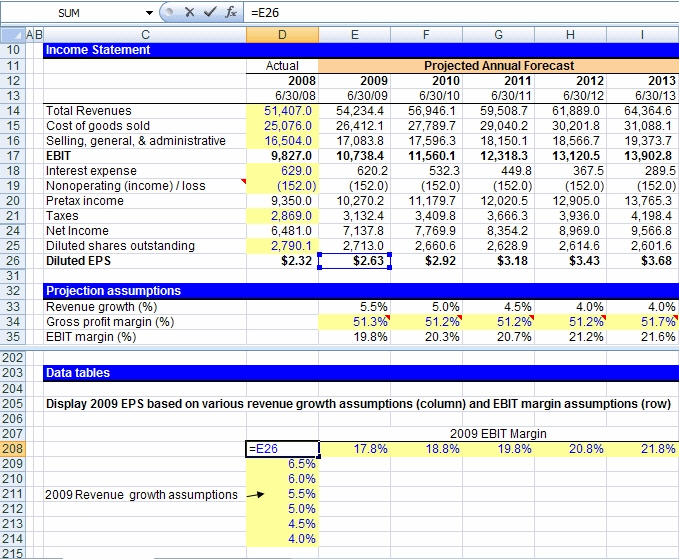
Let’s say, for example, that you have built a dynamic financial statement model in order to predict future earnings per share (EPS) for your business. Your model is flawlessly constructed and gives you an EPS result of $2.63 for the year 2009. Now, instead of presenting to your client that the answer to the question “What will EPS be in 2009?” is unquestionably going to be $2.63, it makes more sense to present a range of possibilities for 2009 EPS that depend on sensitizing certain assumptions in the model. Let’s look at an actual example below to illustrate our point:
Constructing the Matrix in Excel
In a cell on the worksheet, reference the formula that refers to the two input cells that we would like to sensitize. In cell D208, we have referenced our EPS for 2009.
Type one list of input values in the same column, below the formula. In the example, we have input a range of revenuegrowth assumptions.
Type the second list in the same row, to the right of the formula. In the example, we have input a range of EBIT margin assumptions.
Select the range of cells that contains the formula and both the row and column of values. In the example below, you would select the range D208:I214.
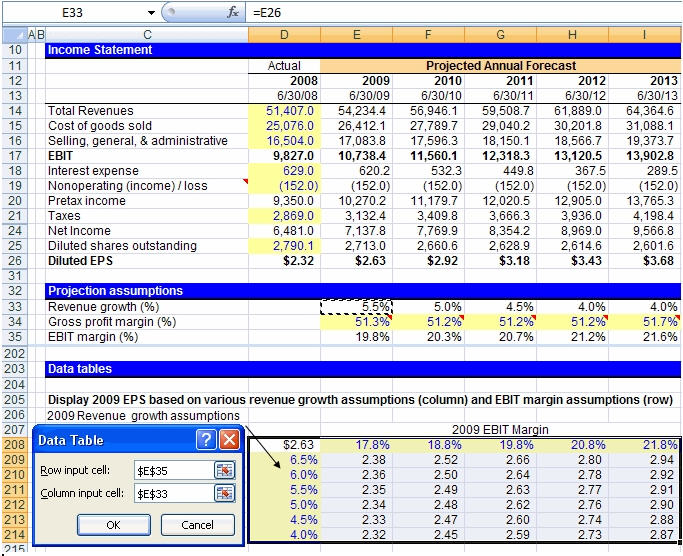
Hit the keys Alt-D-T on your keyboard. This will pull up the “Data Table” box as shown to the right of the data table, below. Note: This “shortcut” works in both Excel 2003 and 2007, although an alternative would be to hit Alt-A-W-T for the 2007 version, which will direct you to the data table box through the “What-If Analysis” menu.
In the Row input cell box, enter the reference to the input cell for the input values in the row. In the example below, you would type cell E35 in the Row input cell box.
In the Column input cell box, enter the reference to the input cell for the input values in the column. In the example below, you would type E33 in the Column input cell box.
Click OK!
Sensitivity Analysis: Functioning Data Table Results
We will finally get our various diluted EPS results as seen in cells E209 through I214 in the data table. The only thing left to do now is to sanity check the results. As revenue growth increases, we should see an increase in diluted EPS, and we do. We should also see diluted EPS increase as EBIT margin improves, and we do. It looks as though we have constructed a well-functioning data table!
Aside from our data table matrix, another method to perform a sanity check on a forecasted figure like revenue is the compound annual growth rate (CAGR). The annualized growth rate metric can be determined to confirm it is reasonable, which is based on the company's historical growth rate and the industry average among comparable companies.
One thing to know is that sometimes Excel is set to calculate automatically, except for data tables. If it looks as though your data table is not working, try hitting “F9” to recalculate the entire worksheet. You can also adjust how Excel is set up by hitting Alt-T-O and then going to the “Calculations” tab in Excel 2003 or the “Formulas” section in Excel 2007. You can also hit Alt-M-X in Excel 2007 to make your selection.
In conclusion, performing sensitivity analysis via a data table is an effective and easy way to present valuable financial information to a boss or client. It provides a range of possible outcomes for a particular piece of information and can highlight the margin of safety that might exist before something goes terribly wrong. For example, how low can revenue growth or EBIT margins get before EPS becomes negative? Once you have constructed several data tables, you'll realize that it takes no time at all and that there is no excuse for not incorporating them into your financial modeling arsenal.
Continue Reading Below
Step-by-Step Online Course
Everything You Need To Master Financial Modeling
Enroll in The Premium Package: Learn Financial Statement Modeling, DCF, M&A, LBO and Comps. The same training program used at top investment banks.
Performing sensitivity analysis (What-If analysis) is a powerful tool for stress-testing assumptions and assessing potential outcomes. However, as the number of variables and scenarios increases, traditional Excel methods can become inefficient and error-prone. Artificial intelligence streamlines this process by rapidly modeling multiple permutations and automatically surfacing key drivers. Professionals looking to enhance their scenario planning can explore the AI for Business & Finance Certificate Program, developed by Wall Street Prep and Columbia Business School Executive Education, which teaches AI-driven sensitivity analysis techniques designed for today’s high-stakes financial environments.
Can a sensitivity analysis data table handle more than two variables at once?
No, Excel's data table feature is limited to exactly two variables: one set of inputs across the row and one down the column. If you need to test the impact of a third variable, such as EBIT margin, revenue growth, and tax rate simultaneously, you'll need to either build multiple two-variable tables for different fixed values of the third variable, or move to a scenario manager or Monte Carlo simulation approach that isn't constrained to two dimensions.
Why does Excel say "input cell reference is not valid" when building a data table?
This error appears when the row or column input cells referenced in a data table are located on a different worksheet than the data table itself, which Excel doesn't allow. The output formula being sensitized can live on any tab in the workbook, but the actual input cells you're sensitizing must sit on the same sheet as the table. Moving the data table to the same sheet as its input cells resolves the error immediately.
Can you build a data table with only one variable instead of two?
Yes, one-way data tables let you sensitize a single variable, laid out either down a column or across a row, and are a common choice when you only want to see how one assumption, like revenue growth alone, affects an output. Two-way data tables are simply an extension of the same tool that let you test two variables together in a grid format.
Why does a data table in Excel show zeros or dashes instead of actual values?
This usually happens for one of three reasons: Excel's calculation settings are set to "Automatic Except for Data Tables," which requires manually pressing F9 to refresh the results, the output cell referenced in the top-left corner of the table isn't correctly linked to the model's actual output, or the row and column input cells weren't entered correctly when the data table box was set up. Checking the calculation mode and re-verifying the input cell references resolves the issue in most cases.
Why might every cell in a data table show the same value?
This typically means the row and column input cells aren't actually driving the output formula the way they're supposed to, so changing the sensitized inputs has no real effect on the result being calculated. It can also happen if the model has a broken link somewhere between the input cells and the output formula, so it's worth tracing the formula's dependencies to confirm the input cells are genuinely feeding into the calculation rather than sitting disconnected from it.
What's the difference between sensitivity analysis and scenario analysis?
Sensitivity analysis, typically built using a data table, isolates the impact of changing one or two specific variables while holding everything else constant, making it ideal for showing a range of outcomes across a grid of assumption combinations. Scenario analysis instead bundles multiple assumptions together into predefined cases, like a base, upside, and downside scenario, to model how an entire set of interconnected variables might move together. The two techniques are complementary and are often used side by side in the same financial model.
What's the difference between a data table and Excel's Goal Seek function?
A data table shows you a range of possible outputs across different combinations of input values, letting you see the full picture of how sensitive a result is to changing assumptions. Goal Seek works in reverse: you specify the output you want to achieve, and Excel works backward to tell you what a single input value needs to be to hit that target. Goal Seek is useful for answering a specific "what input gets me to this exact result" question, while a data table is better for exploring a broader range of outcomes.
Why does using data tables slow down large Excel models?
Data tables recalculate the entire model for every single combination of input values in the table, which means a table with even a modest number of rows and columns can trigger dozens or hundreds of full model recalculations every time Excel refreshes. In large, complex models with many formulas and dependencies, this can noticeably slow down performance, which is why many analysts switch calculation settings to manual or "automatic except for data tables" and refresh with F9 only when needed.
Why is the Data Table option grayed out in Excel's What-If Analysis menu?
The Data Table option typically grays out when the workbook is a shared workbook, since Excel doesn't support building or editing data tables in shared workbook mode. It can also appear unavailable if the active cell selection doesn't include a properly formatted range with both the output formula and the row and column input values already in place. Unsharing the workbook or double-checking that the correct range is selected before opening the What-If Analysis menu usually fixes it.
How do you convert a data table's results into static values before sharing a model?
Since data table cells contain array formulas tied to Excel's What-If Analysis engine, copying and pasting them as regular values requires selecting the full output range, copying it, and using Paste Special with the "Values" option to strip out the underlying formulas. This is useful when sharing a model externally or archiving a specific sensitivity run, since it locks in that exact set of results without carrying over the live formulas that would otherwise recalculate if the model's inputs change later.
Can the sensitivity analysis data table be on a different sheet from where the basic model is? When I try that, Excel gives me an error “Input cell reference is not valid.” However, the same data table works fine on the same sheet as the basic model.
Thank you for a well thought-out article on data tables and sensitivity analysis in financial modeling. I really appreciated the posting.
Haseeb Chowdhry
February 22, 2017 9:56 am
A.N.,
You’re correct in finding a limitation of the data table. The limitation is that the row input and column input cells have to be on the same tab as where you’re building the sensitivity analysis, but the output variable can be linked from any tab. You just have to ensure that your row input and column input cells directly drive the output variable. Hope this helps!
A.N. Rajan
February 22, 2017 10:56 am
Ah, I see. Thank you. I am not on MSDN or any Office groups, but I was wondering if this was on some list of wanted features for future versions? Not that I think that there is a big demand for this, but I think that it would be neat to have.
Thanks again.
Haseeb Chowdhry
February 22, 2017 11:15 am
I’m not aware of any list or group that Microsoft reaches out to for new capabilities on its tools, but it would be a great idea!
Lee
May 30, 2017 8:30 am
Hi,
I applied the above to one sensitivity exercise that i was working on, however, at times, the same values appear throughout the table. Why is that so? and how should i rectify that?
Haseeb Chowdhry
May 30, 2017 6:05 pm
Lee,
Are your calculations set to “Automatic Except for Data Tables?” If so, make sure you press F9 to update all the values in the table.
Lee
May 31, 2017 8:39 am
nope, i have already checked all that, and refreshed with F9. Nothing changes.
Do i have to fix the data to be sensitized in a fixed column?
Haseeb Chowdhry
May 31, 2017 5:54 pm
Lee,
I would ensure that the row/column inputs are directly driving the output variable to ensure this table works well. Let me know if you come across anything – thanks!
Themba Mkandla
September 19, 2017 2:51 am
Great tutorial you couldn’t have made it easier. Thank you:)
Haseeb Chowdhry
September 20, 2017 9:45 pm
Great to hear – thanks!
Akintayo Alo
June 11, 2018 6:44 am
Dears,
Thank you for the knowledge sharing.
Please how do I apply this technique on a financial statement that is built on monthly basis.
Warm regards.
Haseeb Chowdhry
August 13, 2018 3:10 pm
Akintayo,
You can follow the same concepts that we introduced here, but you would be able to sensitize a monthly metric as opposed to an annual metric – that’s the issue with applying sensitivity analysis to monthly numbers. Hope this helps!
– Haseeb
Minh Nguyen
July 13, 2018 6:16 am
So the analysis can be carried with maximum 2 variables? How can we test if we want to try 3 variables (EBIT margin, revenue growth plus another variable)?
Thank you
Haseeb Chowdhry
August 13, 2018 3:09 pm
Minh,
With data tables, you can only really do 2 variables at a time – that is the limitation – thanks!
Bella
August 7, 2018 4:46 pm
Hi, may I know where is the excel file for download? Can’t find the link, or can you send me?
Thanks!
Haseeb Chowdhry
October 15, 2018 1:44 pm
Bella,
We did not provide practice files for this specific post. We have proper practice files provided with our online paid course material – thanks!
Jess
February 11, 2023 4:35 pm
Hi there, thanks for the resource!
I’m having some trouble getting the results. I used Alt A W T and input the two cells, however, the results I got are all dash lines. Could you help with that please? Thanks so much
Brad Barlow
February 12, 2023 9:37 pm
Hi, Jess,
There are typically three reasons you might be getting dashed lines (zeros) in your table answer: 1) You need to hit F9 to calculate the table, even after you have entered the inputs. 2) You need to make sure that the output variable referenced in the upper left corner of the table is referenced from an active model, and that this output changes when you go into your model and change the key inputs. 3) You need to make sure that your input row and column do not contain any cells that are referenced from the model itself; they need to be hardcoded.
BB
Wayne Poh
June 26, 2023 8:46 am
Hi I am having an issue with my data tables, the value in the middle of the table, which is supposed to the same value as the one on the top left hand corner comes out different even if the one in the top left corner is calculated using the 2 variables. How do I fix that? Ie. the top left hand corner is implied share price (I am doing this for DCF) of $265 against WACC and perpertuity growth rate, but the value in the middle gives $295.
Brad Barlow
April 15, 2024 9:05 pm
Hi, Wayne,
The solution to this is first to check your input row and column and make sure they are independent of those cells in the model where they go, and make sure you know what they are precisely. Then go to the cells you are using in the data table for those inputs and input them exactly, and then check your output variable.
BB
William
November 16, 2023 2:24 pm
Can you do just one variable?
Brad Barlow
November 17, 2023 10:39 am
Hi, William,
Yes, one-way data tables can sensitize a single variable, horizontally or vertically.








Can the sensitivity analysis data table be on a different sheet from where the basic model is? When I try that, Excel gives me an error “Input cell reference is not valid.” However, the same data table works fine on the same sheet as the basic model.
Thank you for a well thought-out article on data tables and sensitivity analysis in financial modeling. I really appreciated the posting.
A.N.,
You’re correct in finding a limitation of the data table. The limitation is that the row input and column input cells have to be on the same tab as where you’re building the sensitivity analysis, but the output variable can be linked from any tab. You just have to ensure that your row input and column input cells directly drive the output variable. Hope this helps!
Ah, I see. Thank you. I am not on MSDN or any Office groups, but I was wondering if this was on some list of wanted features for future versions? Not that I think that there is a big demand for this, but I think that it would be neat to have.
Thanks again.
I’m not aware of any list or group that Microsoft reaches out to for new capabilities on its tools, but it would be a great idea!
Hi,
I applied the above to one sensitivity exercise that i was working on, however, at times, the same values appear throughout the table. Why is that so? and how should i rectify that?
Lee,
Are your calculations set to “Automatic Except for Data Tables?” If so, make sure you press F9 to update all the values in the table.
nope, i have already checked all that, and refreshed with F9. Nothing changes.
Do i have to fix the data to be sensitized in a fixed column?
Lee,
I would ensure that the row/column inputs are directly driving the output variable to ensure this table works well. Let me know if you come across anything – thanks!
Great tutorial you couldn’t have made it easier. Thank you:)
Great to hear – thanks!
Dears,
Thank you for the knowledge sharing.
Please how do I apply this technique on a financial statement that is built on monthly basis.
Warm regards.
Akintayo,
You can follow the same concepts that we introduced here, but you would be able to sensitize a monthly metric as opposed to an annual metric – that’s the issue with applying sensitivity analysis to monthly numbers. Hope this helps!
– Haseeb
So the analysis can be carried with maximum 2 variables? How can we test if we want to try 3 variables (EBIT margin, revenue growth plus another variable)?
Thank you
Minh,
With data tables, you can only really do 2 variables at a time – that is the limitation – thanks!
Hi, may I know where is the excel file for download? Can’t find the link, or can you send me?
Thanks!
Bella,
We did not provide practice files for this specific post. We have proper practice files provided with our online paid course material – thanks!
Hi there, thanks for the resource!
I’m having some trouble getting the results. I used Alt A W T and input the two cells, however, the results I got are all dash lines. Could you help with that please? Thanks so much
Hi, Jess,
There are typically three reasons you might be getting dashed lines (zeros) in your table answer: 1) You need to hit F9 to calculate the table, even after you have entered the inputs. 2) You need to make sure that the output variable referenced in the upper left corner of the table is referenced from an active model, and that this output changes when you go into your model and change the key inputs. 3) You need to make sure that your input row and column do not contain any cells that are referenced from the model itself; they need to be hardcoded.
BB
Hi I am having an issue with my data tables, the value in the middle of the table, which is supposed to the same value as the one on the top left hand corner comes out different even if the one in the top left corner is calculated using the 2 variables. How do I fix that? Ie. the top left hand corner is implied share price (I am doing this for DCF) of $265 against WACC and perpertuity growth rate, but the value in the middle gives $295.
Hi, Wayne,
The solution to this is first to check your input row and column and make sure they are independent of those cells in the model where they go, and make sure you know what they are precisely. Then go to the cells you are using in the data table for those inputs and input them exactly, and then check your output variable.
BB
Can you do just one variable?
Hi, William,
Yes, one-way data tables can sensitize a single variable, horizontally or vertically.
BB