A Profit Margin measures the percentage of a company’s revenue that remains once certain expenses have been deducted.
By comparing a profit metric to revenue, the profitability of a company after deducting certain types of expenses can be analyzed, which helps determine where a company’s spending is concentrated.
How to Calculate Profit Margin
A profit margin is a financial ratio that divides a profitability metric belonging to a company by its revenue in the corresponding period.
In practice, various types of profitability metrics are utilized to measure the operating performance of a company, rather than relying solely on one profit margin ratio.
Each type of profit margin serves a distinct purpose and when used in conjunction with the others, a far more comprehensive understanding of the underlying company can be obtained.
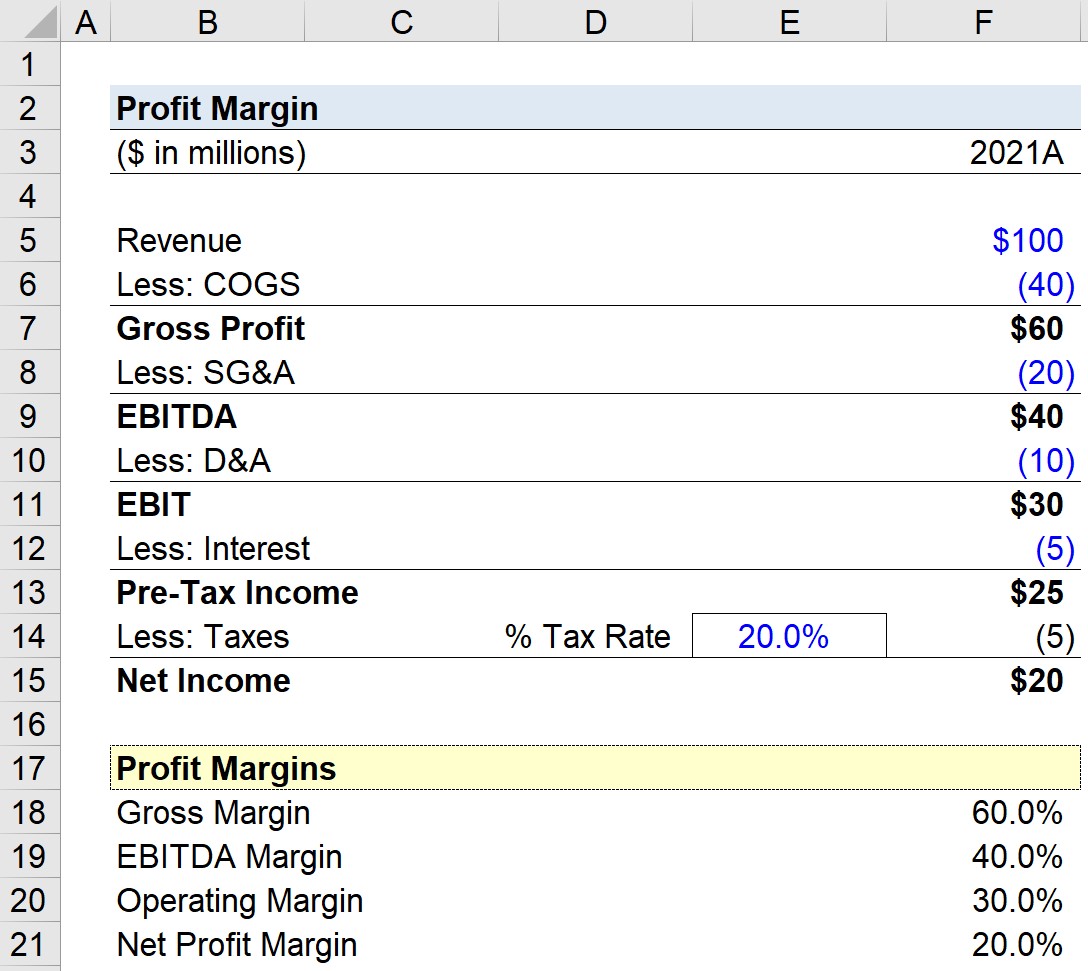
The chart below lists the most common profit margins used for assessing companies.
Profit Margin
Description
Formula
Gross Margin
The gross margin is the percentage of revenue remaining once COGS has been subtracted.
COGS are the direct costs associated with the revenue generation of a company (e.g. direct materials, direct labor).
The EBITDA margin is the percentage of revenue remaining after all operating direct and indirect costs have been deducted – but D&A is added back due to being a non-cash expense.
EBITDA Margin (%) = EBITDA ÷ Revenue
Profit Margin Formula
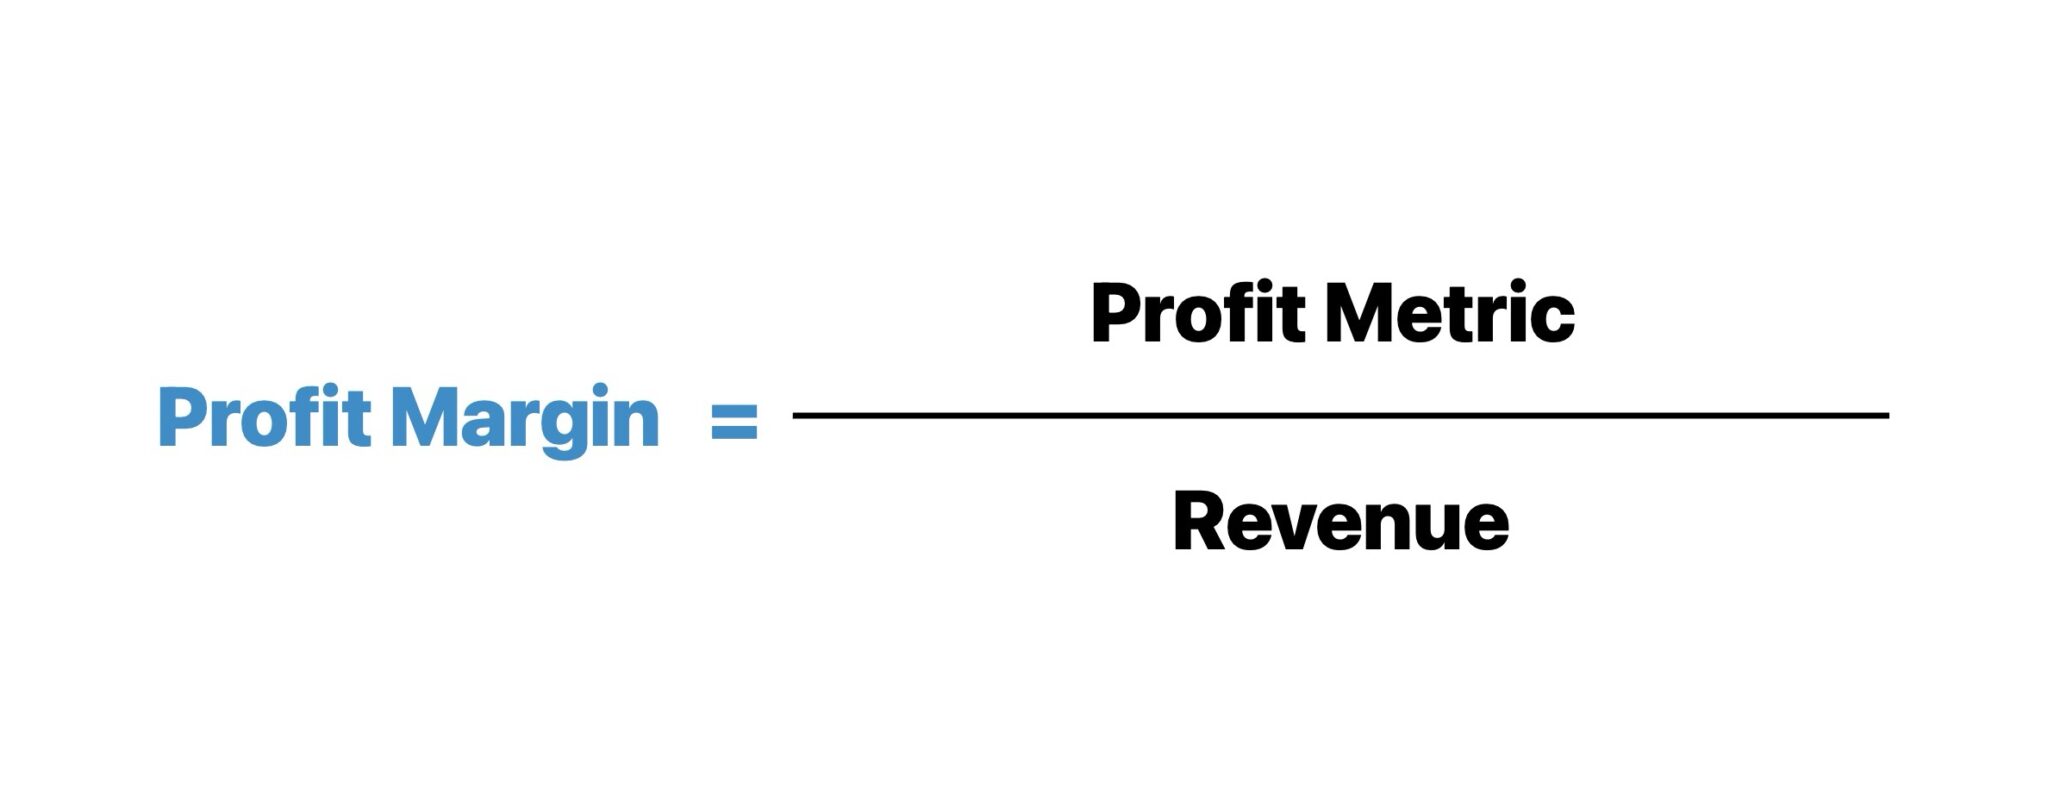
For practically all profit margins, the general “plug-in” formula is as follows.
Profit Margin (%) = Profit Metric ÷ Revenue
Since profit margins are expressed in percentage form, the resulting figure in decimal notation must be multiplied by 100.
How to Analyze Profit Margins
Operating income (or "EBIT") represents the line item on the income statement that splits core, ongoing business operations from non-operational line items.
Financing activities like interest on debt obligations is classified as a non-operating expense, because decisions on how to finance a company are discretionary to management (i.e. the decision to fund using debt or equity).
For comparative purposes, EBIT and EBITDA are used most frequently due to how the company’s operational performance is portrayed – while remaining independent of capital structure and taxes.
Profit margins that are independent of discretionary decisions, such as the capital structure and taxes (i.e. jurisdiction-dependent), are most useful for peer comparisons.
When it comes to company-to-company comparisons, isolating the core operations of each company is important – otherwise, the values would be skewed by non-core, discretionary items.
In contrast, profitability metrics below the operating income line (i.e. post-levered) have adjusted EBIT for non-operating income / (expenses), which are classified as discretionary and non-core to the company’s operations.
An example is the net profit margin, since non-operating income/(expenses), interest expense, and taxes are all factored into the metric.
Unlike operating margin and EBITDA margin, net profit margin is directly impacted by how the company is financed and the applicable tax rate.
Operating Margin vs. EBITDA Margin: What is the Difference?
For comparison among comparable companies, the two most commonly used profit margins are the operating margin and EBITDA margin.
The operating margin formula divides EBIT by revenue.
Operating Margin (%) = EBIT ÷ Revenue
On the other hand, the EBITDA margin divides EBITDA by revenue.
EBITDA Margin (%) = EBITDA ÷ Revenue
The notable difference between the two profit metrics is that EBITDA is a non-GAAP measure that adds back non-cash expenses, namely depreciation and amortization (D&A).
In particular, depreciation and amortization represent non-cash accounting conventions used to match capex spend with the corresponding revenue generated under the matching principle.
Non-Cash Items ➝ Besides D&A, EBITDA can also be adjusted for stock-based compensation and other non-cash charges.
Non-Recurring Items ➝ Adjustments are also made to remove the effects of non-recurring, extraordinary items that are not part of the core operations of the business.
What is a Good Profit Margin?
Determining whether a company’s profit margin is "good" depends on the industry in question, among other factors.
Hence, comparisons between companies operating in different industries are not recommended and are likely to lead to misleading conclusions.
To provide some brief examples, software companies are well-known for exhibiting high gross margins, yet sales & marketing expenses often cut into their profitability significantly.
On the other hand, retail and wholesale stores have low gross margins due to most of their expenses being related to:
Direct Labor
Direct Material (i.e. Inventory)
For those looking for a more detailed breakdown of the gross margin, operating margin, EBITDA margin, and net margin metrics for different industries, NYU Professor Damodaran has a useful resource that tracks the various average profit margins by sector.
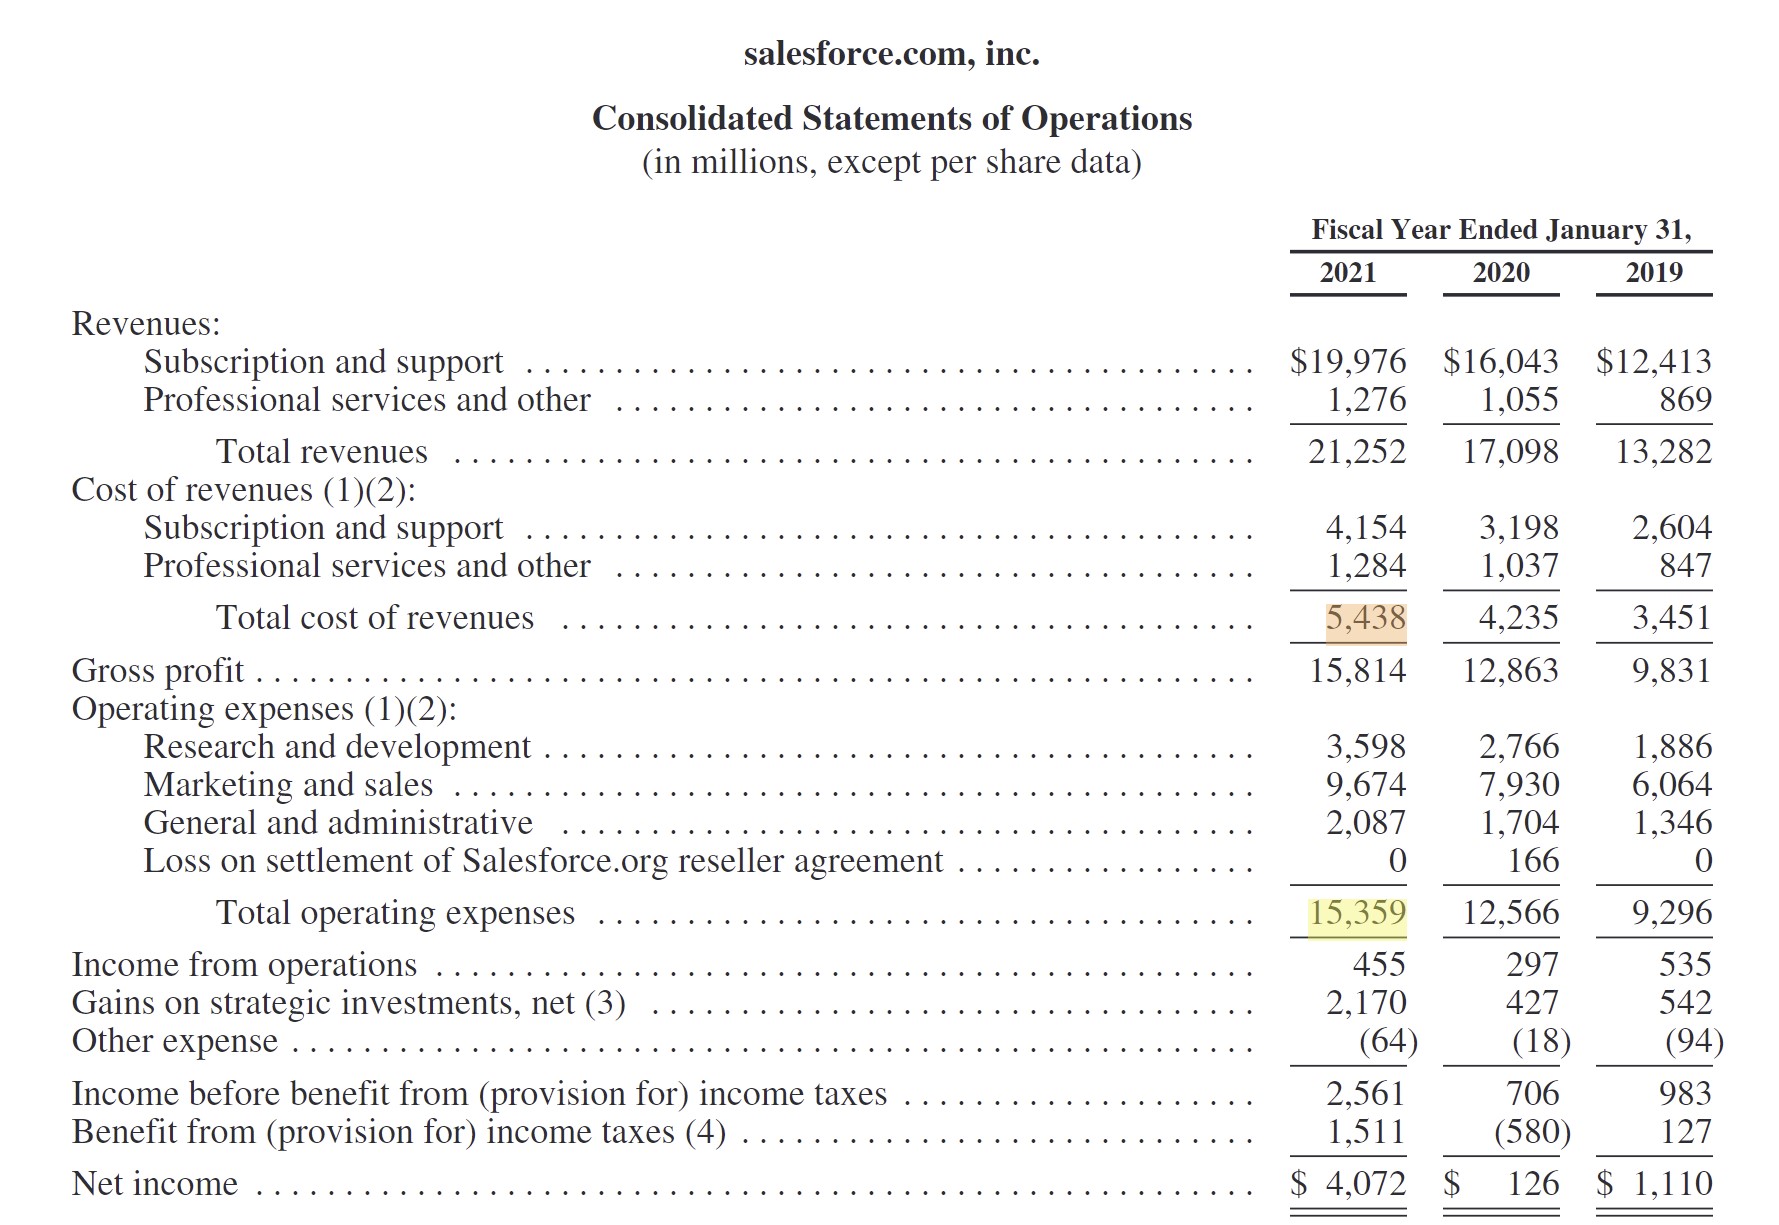
As a real-life example, we’ll look at the margin profile of Salesforce (NYSE: CRM), a cloud-based platform oriented around customer relationship management (CRM) and related applications.
In fiscal year 2021, Salesforce reported the following financials:
Given those data points, Salesforce’s gross profit is $15.8 billion, whereas its operating income (EBIT) is $455 million.
Of the core operating costs – i.e. COGS + Opex – the corresponding % of revenue amounts were:
COGS % Revenue: 25.6%
Opex % Revenue: 72.3%
Furthermore, the gross and operating margins of Salesforce in 2021 were:
Gross Margin: 74.4%
Operating Margin: 2.1%
As mentioned earlier, Salesforce is an example of a software company with high gross margins but with substantial operating costs, especially for sales & marketing.
Salesforce Cost of Revenue and Operating Expenses (Source: 2021 10-K)
Consumer Retail Profit Margin Analysis Example
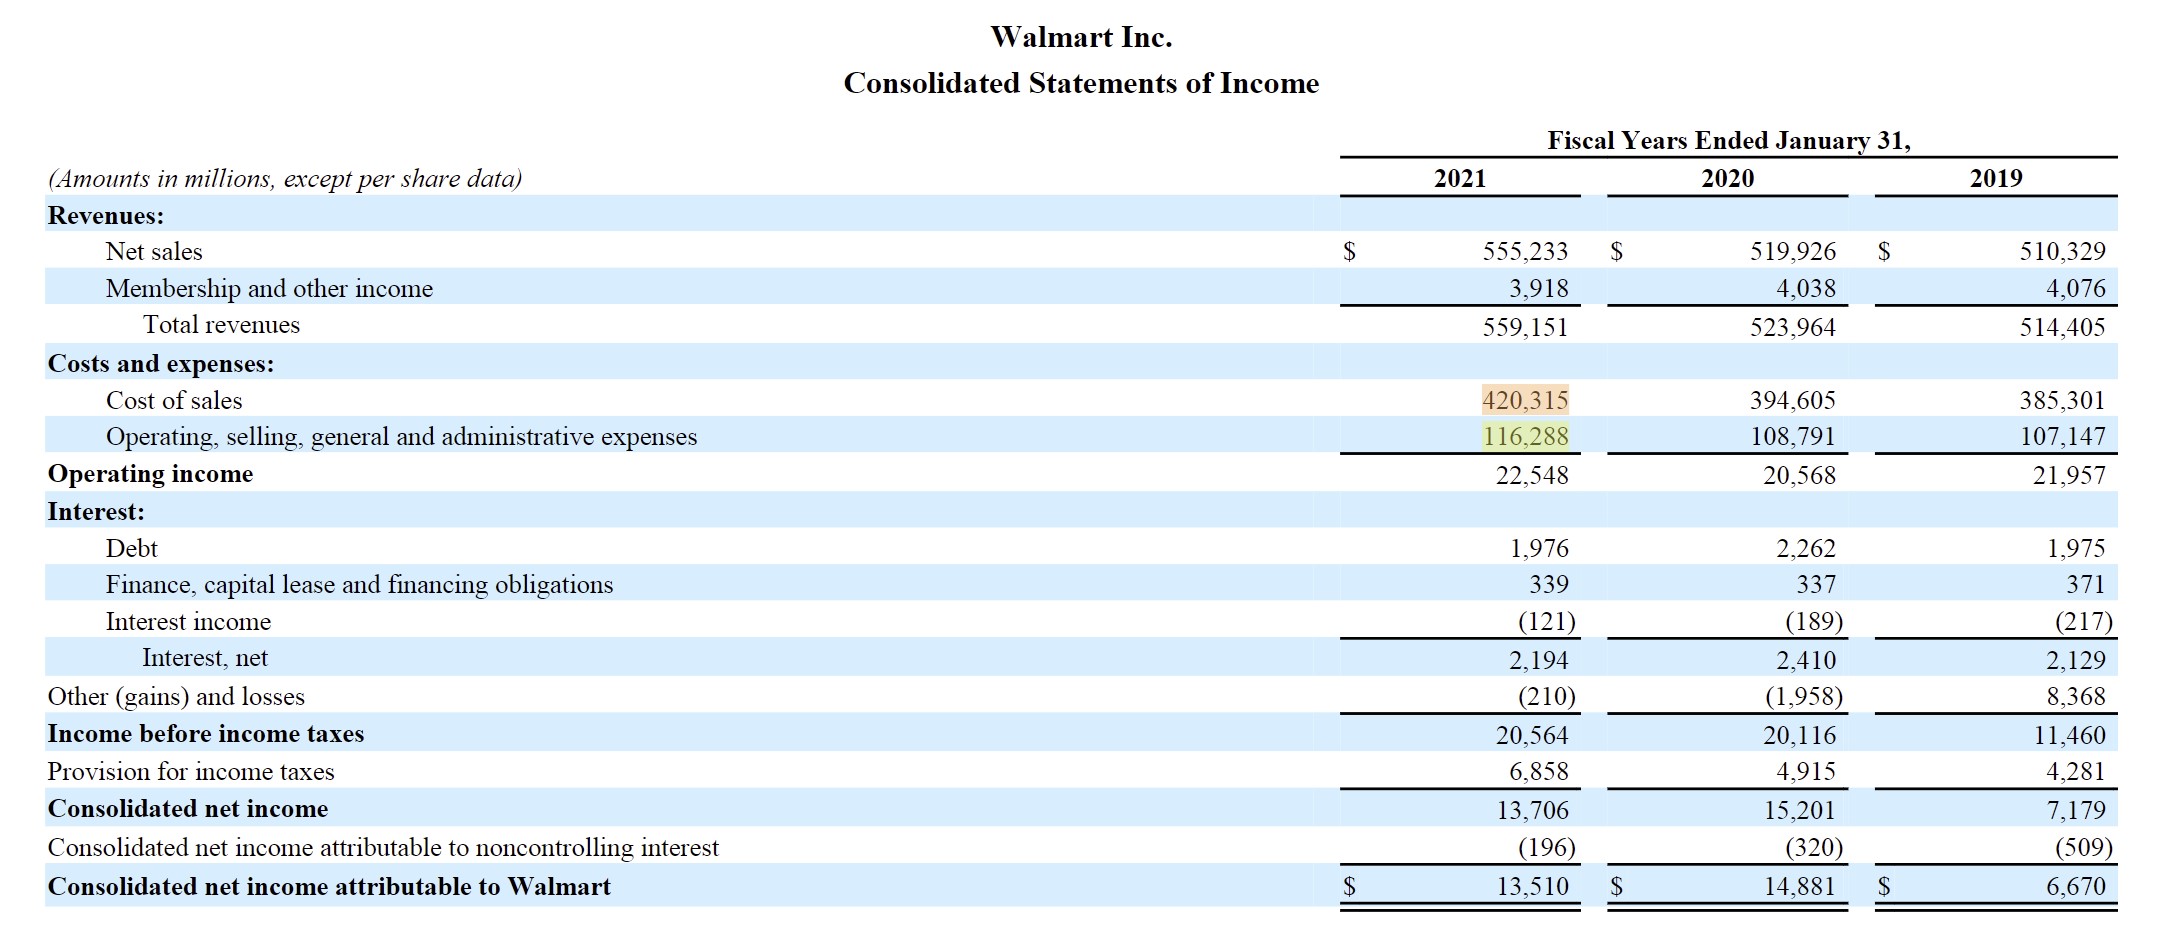
Next, we’ll look at Walmart (NYSE: WMT) as a retail industry example, which we'll contrast against our prior software industry example.
For fiscal year 2021, Walmart reported the following financial data:
Revenue: $559.2 billion
COGS: $420.3 billion
Opex: $116.3 billion
Therefore, Walmart’s gross profit is $138.8 billion, while its operating income (EBIT) is $22.5 billion.
Just like we did for Salesforce, the operating cost breakdown (i.e. % of revenue) is as follows:
COGS % Revenue: 75.2%
Opex % Revenue: 27.7%
Furthermore, the margins of Walmart were:
Gross Margin: 24.8%
Operating Margin: 4.0%
From our retail example, we can see how inventory and direct labor comprised the majority of Walmart’s total core expenses.






very excellent
Thank you, Mosta, glad it was helpful!