What is Earnings Yield?
The Earnings Yield is calculated by dividing the earnings per share (EPS) in the trailing twelve months by the latest closing market share price.

The Earnings Yield is calculated by dividing the earnings per share (EPS) in the trailing twelve months by the latest closing market share price.
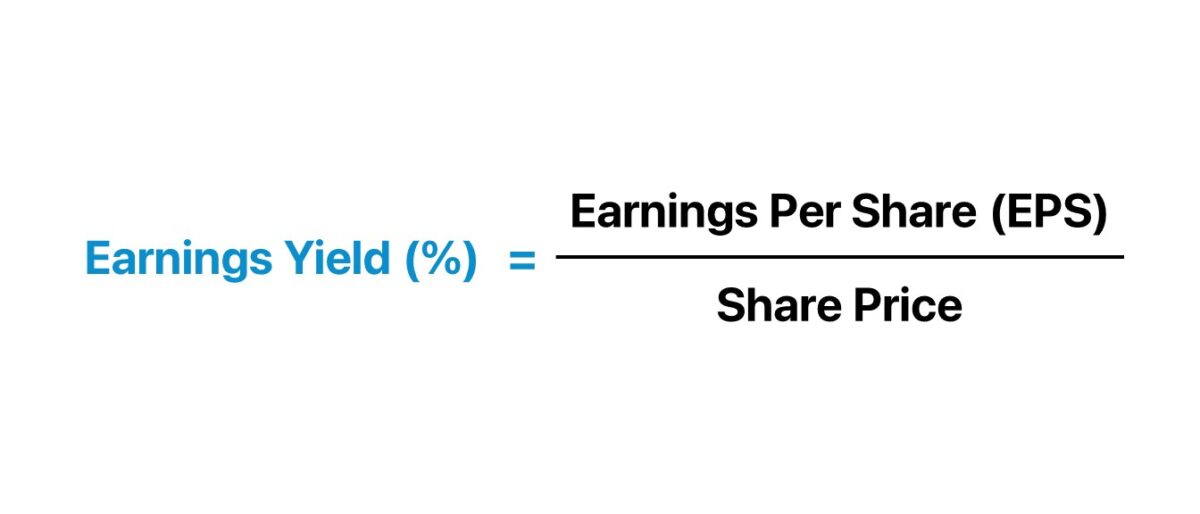
The earnings yield metric is the inverse of the price-to-earnings ratio (P/E ratio) and measures the earnings per share (EPS) that a company generates for each dollar invested into its shares.
There are two inputs required to calculate the earnings yield metric.
The formula used to calculate the earnings yield is the reciprocal of the price-to-earnings ratio (P/E) – the earnings per share (EPS) is divided by the latest closing share price.
For investors, the metric can be informative in terms of helping you understand how much of the Company's earnings you will be receiving for each dollar invested in the underlying company’s issued shares.
Therefore, the earnings yield metric facilitates more practical comparisons among two or more public companies.
The formula used to calculate the earnings yield is as follows.
Where:
Alternatively, the earnings yield can be calculated by dividing one by the P/E ratio of the company.
For instance, suppose a company’s shares are currently trading at $10.00 in the open market, and its diluted EPS for the latest fiscal year was $1.00.
The following formulas can be used to calculate the earnings yield and P/E ratio:
Therefore, given the yield of 10.0%, the takeaway is that for each dollar invested into the company’s shares, the investment would generate $0.10 of EPS.
Learn how institutional investors identify high-potential undervalued stocks. Enrollment is open for the upcoming cohort.
Often the earnings yield is often used as a tool to determine whether a company’s shares are undervalued or overvalued by the market.
The historical growth trajectory, as well as a company’s future growth prospects, each represent critical factors that can impact the metric.
Furthermore, companies with promising growth potential in the coming years are far more likely to be valued at higher valuations – which, in turn, results in a lower yield as their share price increases (i.e. the market is pricing in the improved monetization of existing and new customers).
When determining the right parameters (i.e. undervalued, overvalued, or priced accurately by the market), it is best to start by performing background research on the company to understand the actual underlying drivers.
From doing so, you’ll obtain a much better understanding of the company's fundamentals and that of its industry peers, which helps establish the right baseline to use as a point of reference.
Similar to the P/E ratio, the yield metric tends to be the most informative when it comes to mature companies in the later stages of their growth cycle and those with many close competitors.
While a sizable portion of investors make investment decisions using the amount and growth of dividends paid as a proxy for value, earnings are the real long-term driver of dividend payments (and the firm's valuation – i.e. share price).
At the end of the day, dividends come out of the retained earnings of a company.
Therefore, it can be argued that earnings yield is a more practical metric for evaluating potential investments, which is attributable to the fact that not all companies issue dividends.
Additionally, many underperforming companies can be hesitant to cut dividends and choose to sustain a high payout for the sake of maintaining their current share price. In such scenarios, the irrational behavior of management teams could paint a false picture of the financial health of the company.
Similar to the yield on bonds and other fixed-income instruments, the earnings yield is expressed in the form of a percentage.
The earnings yield is often touted as being most useful for comparability between equity instruments and bonds and other fixed-income instruments – for example, imagine comparing a company’s P/E ratio to the yield on 10-year treasury notes (i.e. the risk-free asset).
We’ll now move on to a modeling exercise, which you can access by filling out the form below.


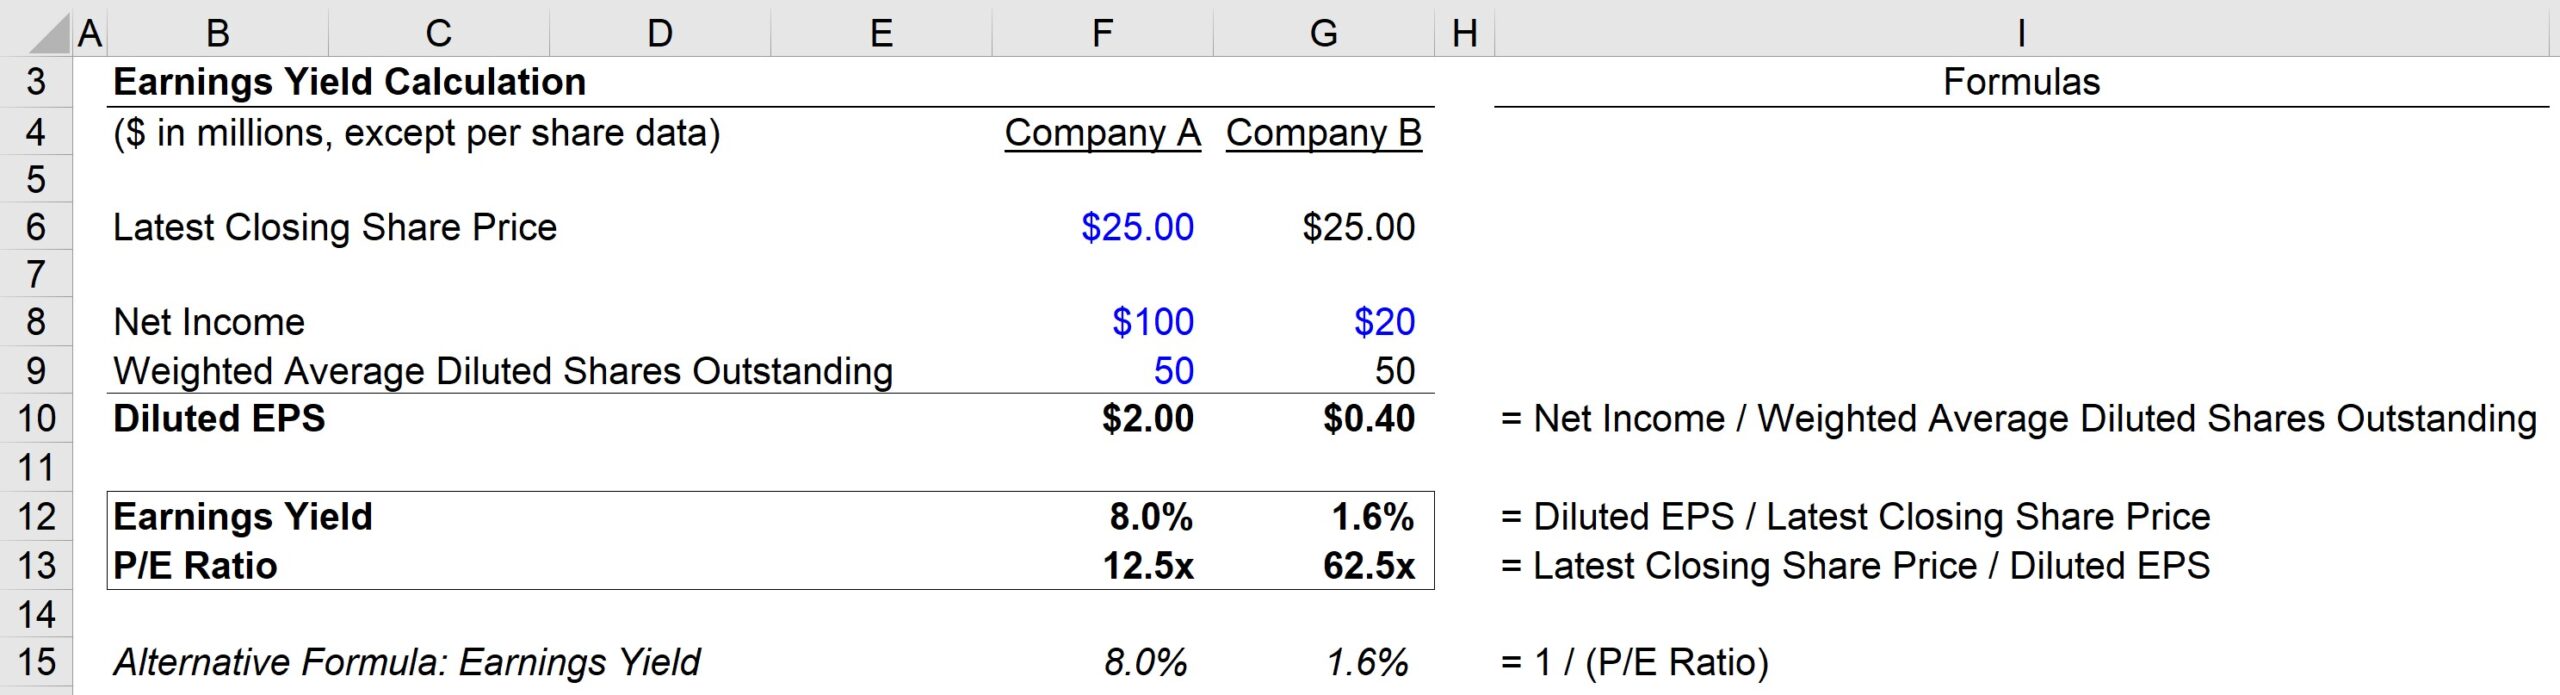
To start, we’ll list out the assumptions that we’ll be using in our example calculation.
First off, we’ll have two companies, Company A and Company B, both sharing the following assumptions:
Now, for the one major difference between the two companies:
With that said, for both companies, we can calculate their diluted EPS:
So far, we have been given the latest share price for each company, and we just calculated the diluted EPS using the provided net income and diluted share count assumptions.
We now have all the necessary inputs for calculating our two metrics – for example:
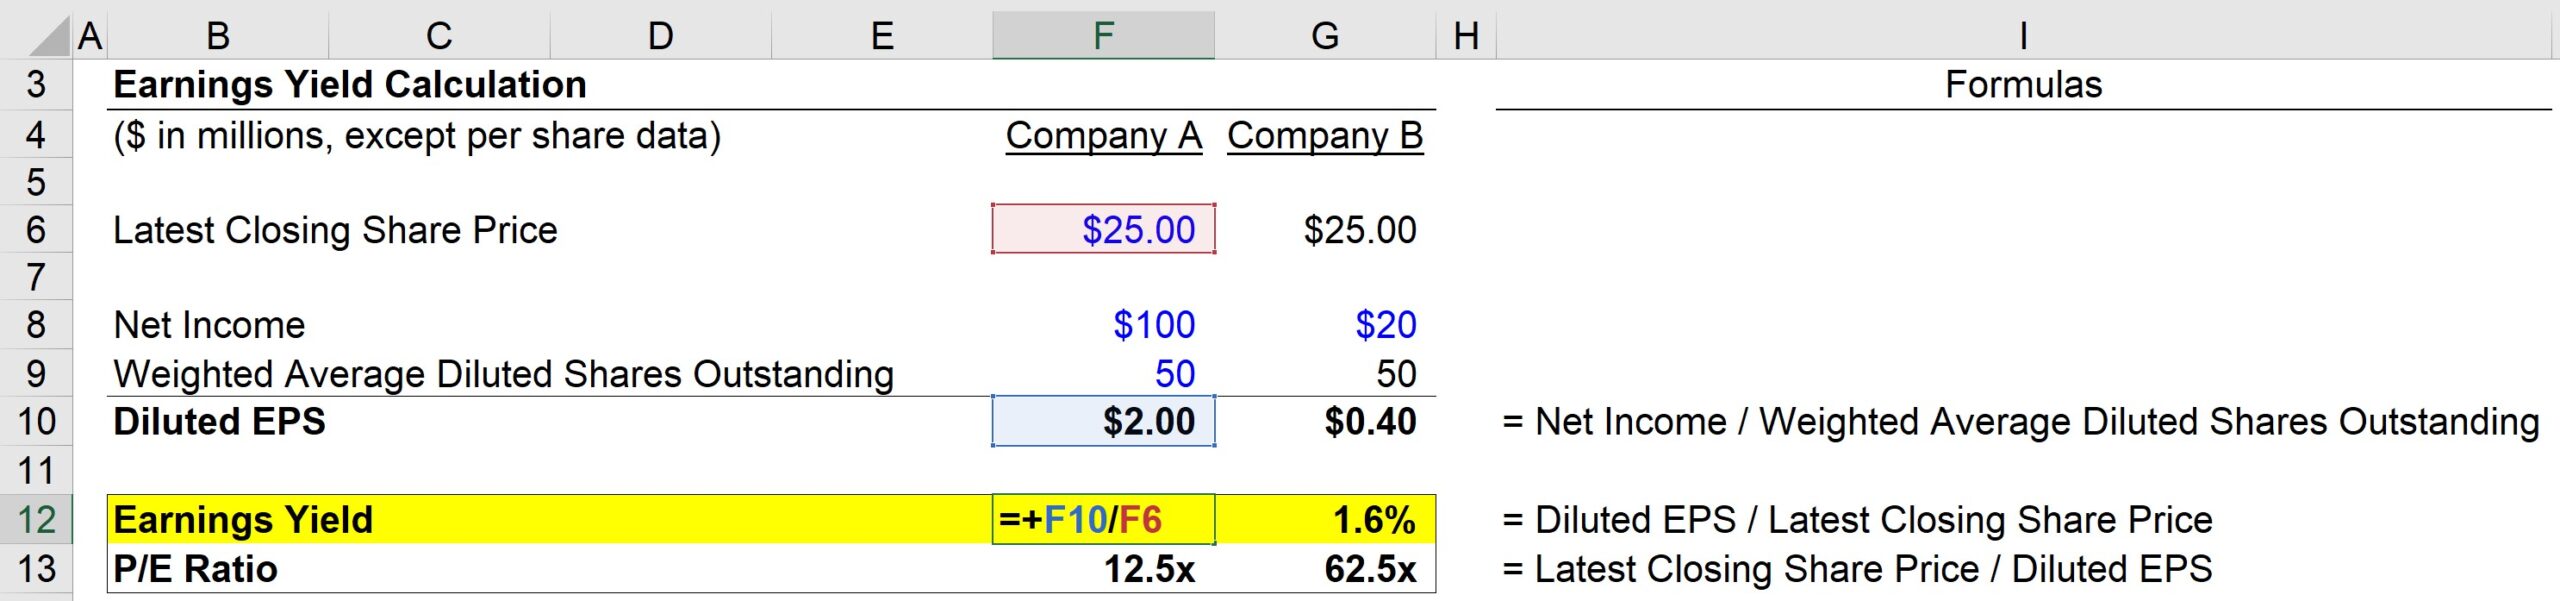
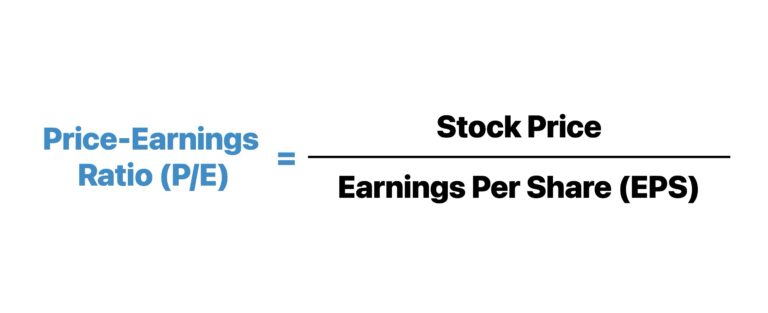
And then, the P/E ratio of Company A can be calculated using the formula below:
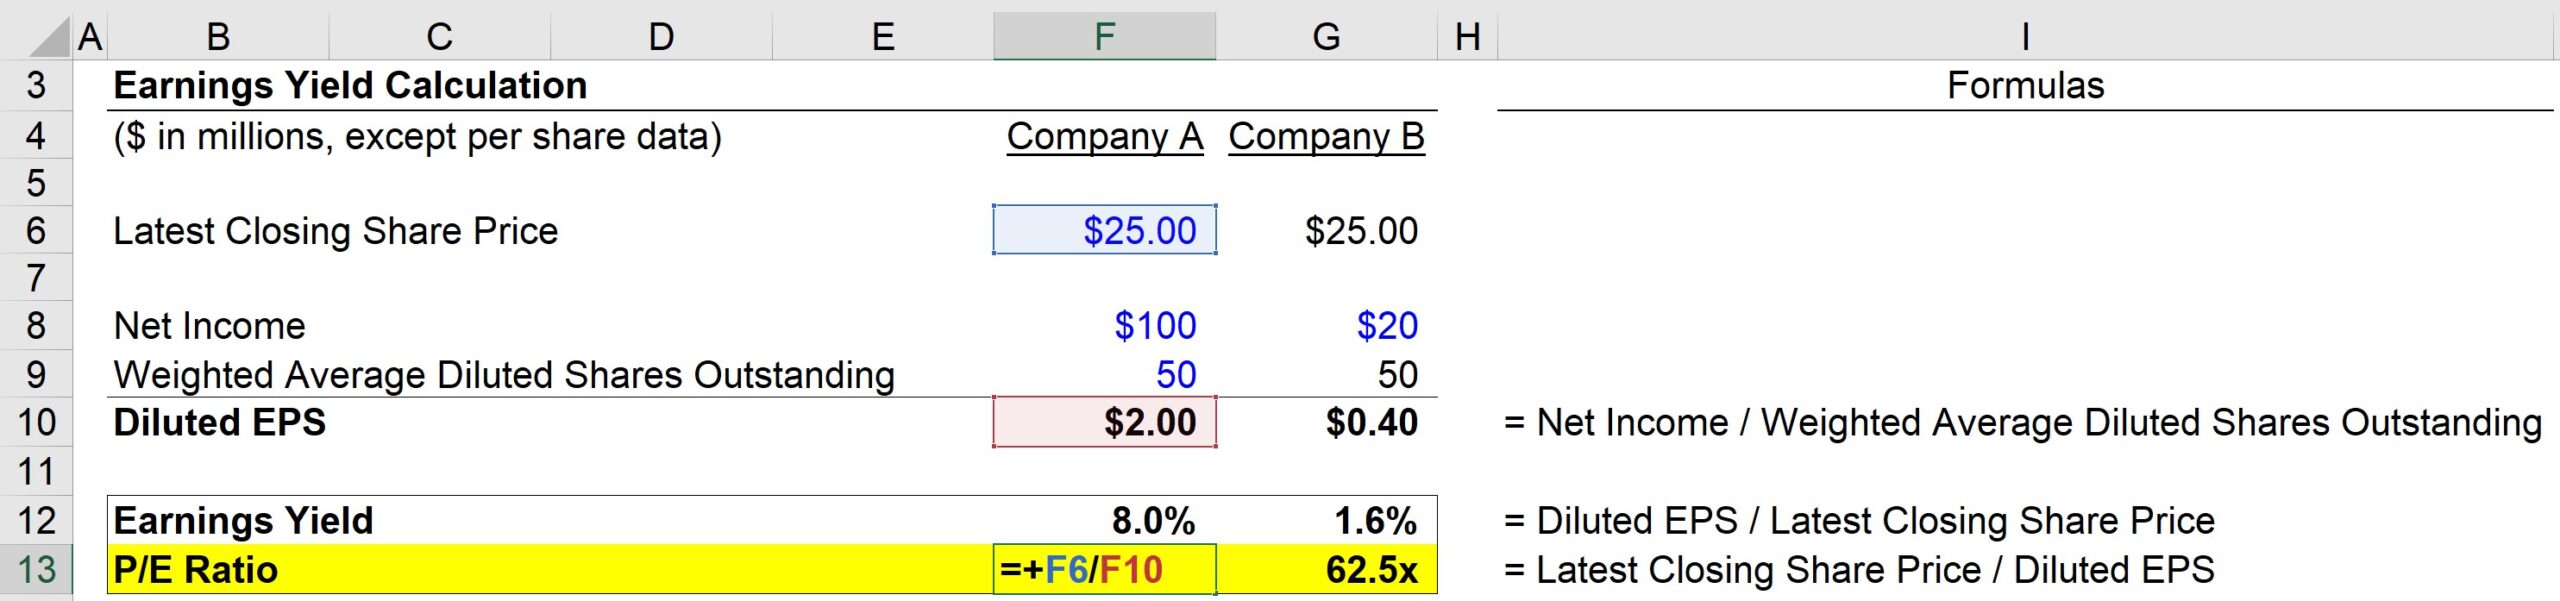
Alternatively, the yield can also be calculated by:
Just like the first method, we once again get 8.0%.
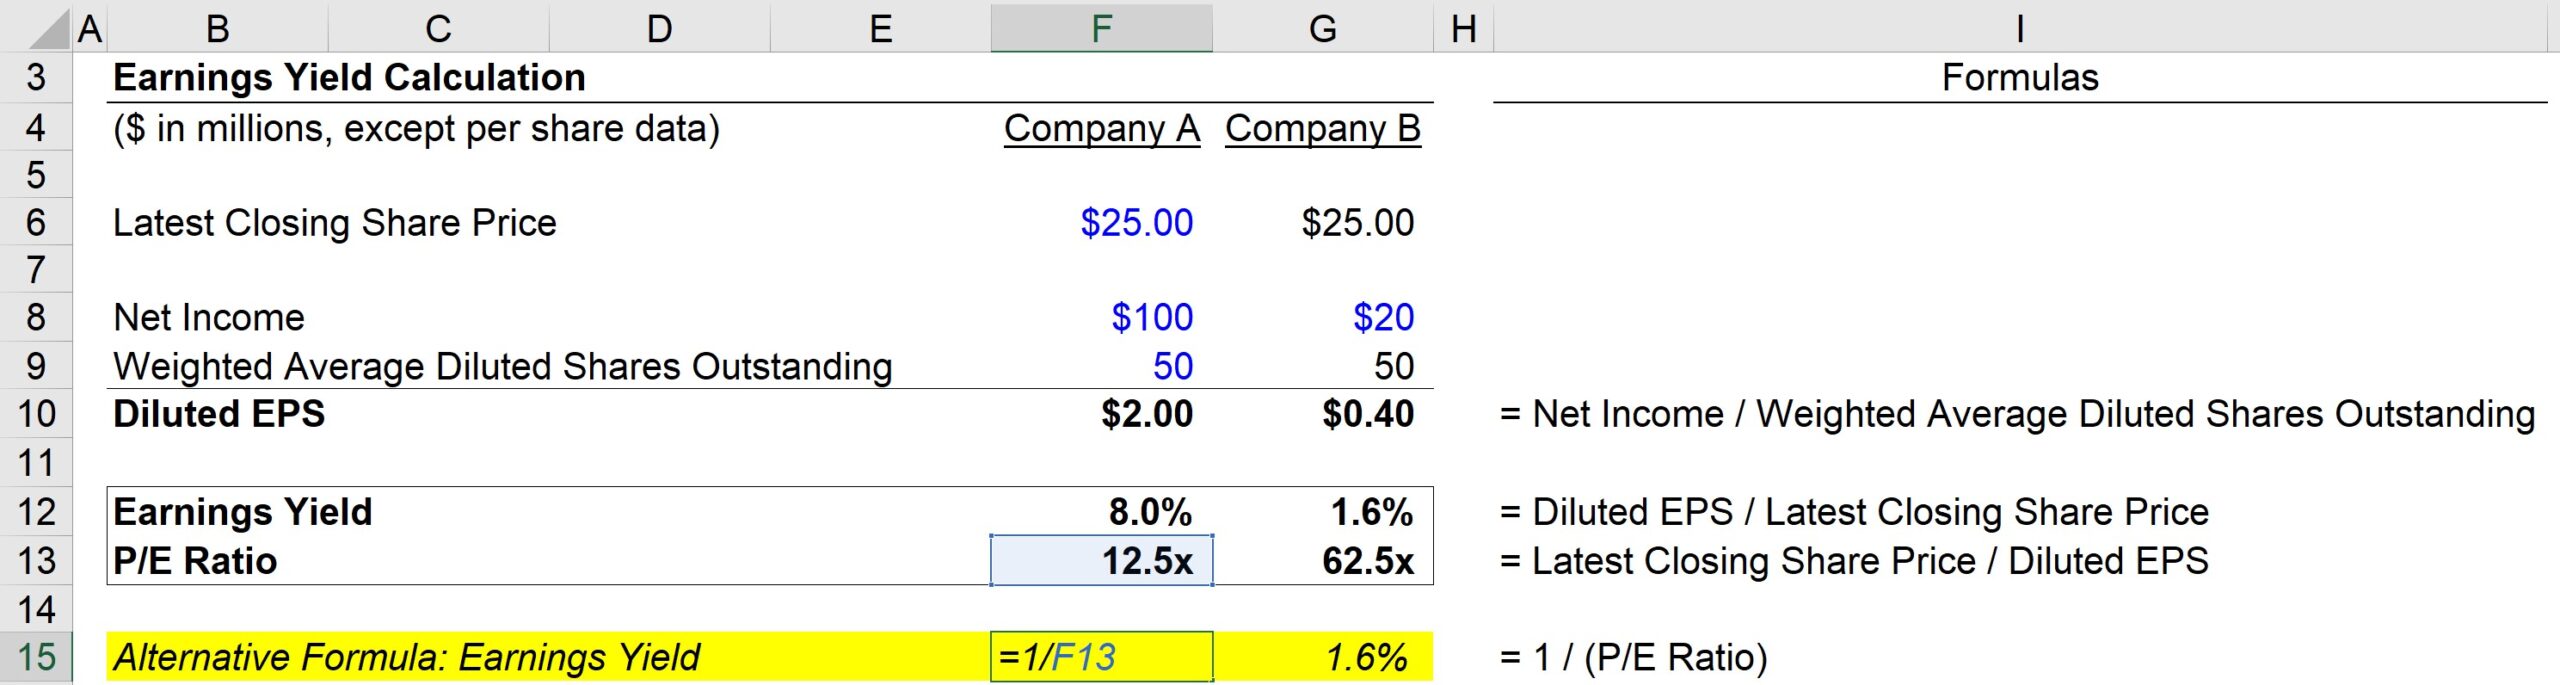
So, based on our calculations, Company A has the following metrics:
On the other hand, Company B has the following metrics:
In closing, the key takeaway from our training exercise is the inverse relationship between the earnings yield metric and the P/E ratio.
The higher the P/E ratio, the lower the earnings yield – but it is important to understand that this does not necessarily imply that the company is overvalued.
The low earnings yield and high P/E ratio can signal that investors expect significant profit margin improvements and are thereby pricing those positive expectations into the market price.
Gradually, as companies mature in their respective markets and establish their competitive positioning over time, the yield tends to increase, whereas their P/E ratios gradually normalize to sustainable levels.


No comments yet.