What is Horizontal Analysis?
Horizontal Analysis measures a company’s operating performance by comparing its reported financial statements, i.e. the income statement and balance sheet, to the financial results filed in a base period.

Horizontal Analysis measures a company’s operating performance by comparing its reported financial statements, i.e. the income statement and balance sheet, to the financial results filed in a base period.
Horizontal analysis, or “time series analysis”, is oriented around identifying trends and patterns in the revenue growth profile, profit margins, and/or cyclicality (or seasonality) over a predetermined period.
The accounting period covered could be one-month, a quarter, or a full fiscal year.
Conceptually, the premise of horizontal analysis is that tracking a company’s financial performance in real time and comparing those figures to its past performance (and that of its industry peers) can be very practical.
Performing horizontal analysis can help determine the prevailing industry tailwinds (or headwinds), the forward-looking growth outlook in the market (e.g. the industry’s projected CAGR), and the target customer’s spending patterns, and a more in-depth understanding of the company’s core performance drivers can thus be identified.
The findings of common size analysis as compiled in the preliminary stages of due diligence are critical.
In particular, the specific metrics and any notable patterns or trends that were identified can be compared across different companies — ideally to close competitors operating in the same industry — in order to evaluate each finding in more detail.
Per usual, the importance of completing sufficient industry research cannot be overstated here. In each industry, market participants attempt to solve different problems and encounter various obstacles, resulting in financial performance that reflects a given industry’s state.
While peer-to-peer comparisons are performed as part of the horizontal analysis process, it is important to consider the external variables that impact operating performance, especially any industry-specific considerations and market conditions.
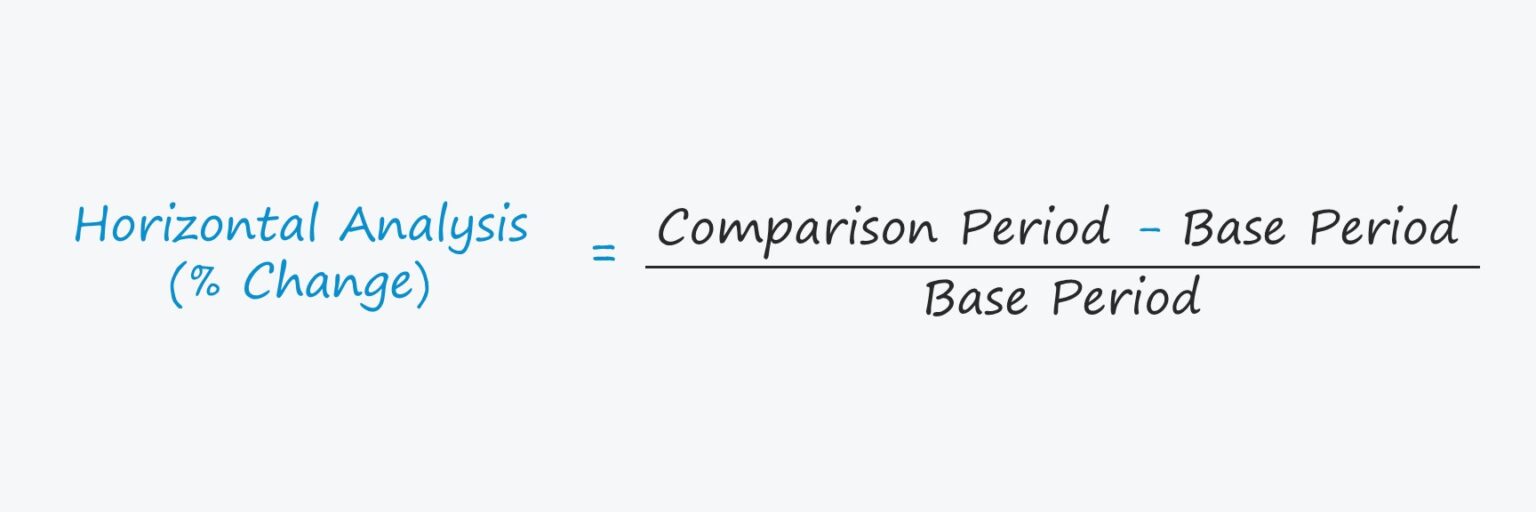
The formula for conducting horizontal analysis is as follows.
To standardize the output for the sake of comparability, the next step is to divide by the base period.
In order to express the decimal amount in percentage form, the final step is to multiply the result by 100.
Learn how institutional investors identify high-potential undervalued stocks. Enrollment is open for the upcoming cohort.
For example, if a company’s current year (2022) revenue is $50 million in 2022 and its revenue in the base period, 2021, was $40 million, the net difference between the two periods is $10 million.
By dividing the net difference by the base figure, the percentage change comes out to 25%.
The base figure is most often pulled from one of the following sources:
The latter two tend to go hand-in-hand because the most useful benchmark against which to compare recent performance is most often the preceding period.
In contrast, picking the earliest period for the comparison can show the most positive improvement over time, but the usefulness is somewhat limited considering the extent to how much the company has likely grown and changed given the time elapsed (and selecting a comparison period of underperformance can be misleading in portraying recent performance as better than in actuality).
The priority here should be to identify the company’s areas of strengths and weaknesses to create an actionable plan to drive value creation and implement operating improvements.
A fundamental part of financial statement analysis is comparing a company’s results to its performance in the past and to the average industry benchmark set by comparable peers in the same (or adjacent) industry.
In particular, there are two forms of financial analysis where a company’s income statement and its balance sheet line items are adjusted to be “common size”, i.e. the financial data is expressed as percentages of a base figure, which enables comparisons to be closer to “apples to apples”.
Vertical analysis expresses each line item on a company’s financial statements as a percentage of a base figure, whereas horizontal analysis is more about measuring the percentage change over a specified period.
In other words, vertical analysis can technically be completed with one column of data, but performing horizontal analysis is not practical unless there is enough historical data to have a useful point of reference.
In fact, there must be a bare minimum of at least data from two accounting periods for horizontal analysis to even be plausible.
Still, horizontal and vertical analyses are meant to be complementary and used in conjunction with the other, so the user can obtain the most comprehensive understanding of a company’s historical performance and financial state as of the present date.
We’ll now move on to a modeling exercise, which you can access by filling out the form below.


Suppose we’re tasked with performing a horizontal analysis on a company's financial performance from fiscal years ending in 2020 to 2021.
We’ll start by inputting our historical income statement and balance sheet into an Excel spreadsheet.
The two tables below display the financial assumptions we’ll be using here.
Income Statement Data
| Historical Income Statement | 2020A | 2021A |
|---|---|---|
| ($ in millions) | ||
| Revenue | $100 | $145 |
| Less: COGS | (40) | (60) |
| Gross Profit | $60 | $85 |
| Less: SG&A | (25) | (40) |
| Less: R&D | (10) | (15) |
| EBIT | $25 | $30 |
| Less: Interest Expense | (5) | (5) |
| EBT | $20 | $25 |
| Less: Taxes (30%) | (6) | (8) |
| Net Income | $14 | $18 |
Balance Sheet Financial Data
| Historical Balance Sheet | 2020A | 2021A |
|---|---|---|
| ($ in millions) | ||
| Cash and Equivalents | $80 | $100 |
| Accounts Receivable | 50 | 65 |
| Inventory | 40 | 45 |
| Prepaid Expenses | 10 | 10 |
| Total Current Assets | $180 | $220 |
| PP&E, net | 200 | 220 |
| Total Assets | $380 | $440 |
| Accounts Payable | $60 | $75 |
| Accrued Expenses | 35 | 40 |
| Total Current Liabilities | $95 | $115 |
| Long-Term Debt | 85 | 100 |
| Total Liabilities | $180 | $215 |
| Total Equity | $200 | $225 |
Our first task is to evaluate our hypothetical company’s income statement.
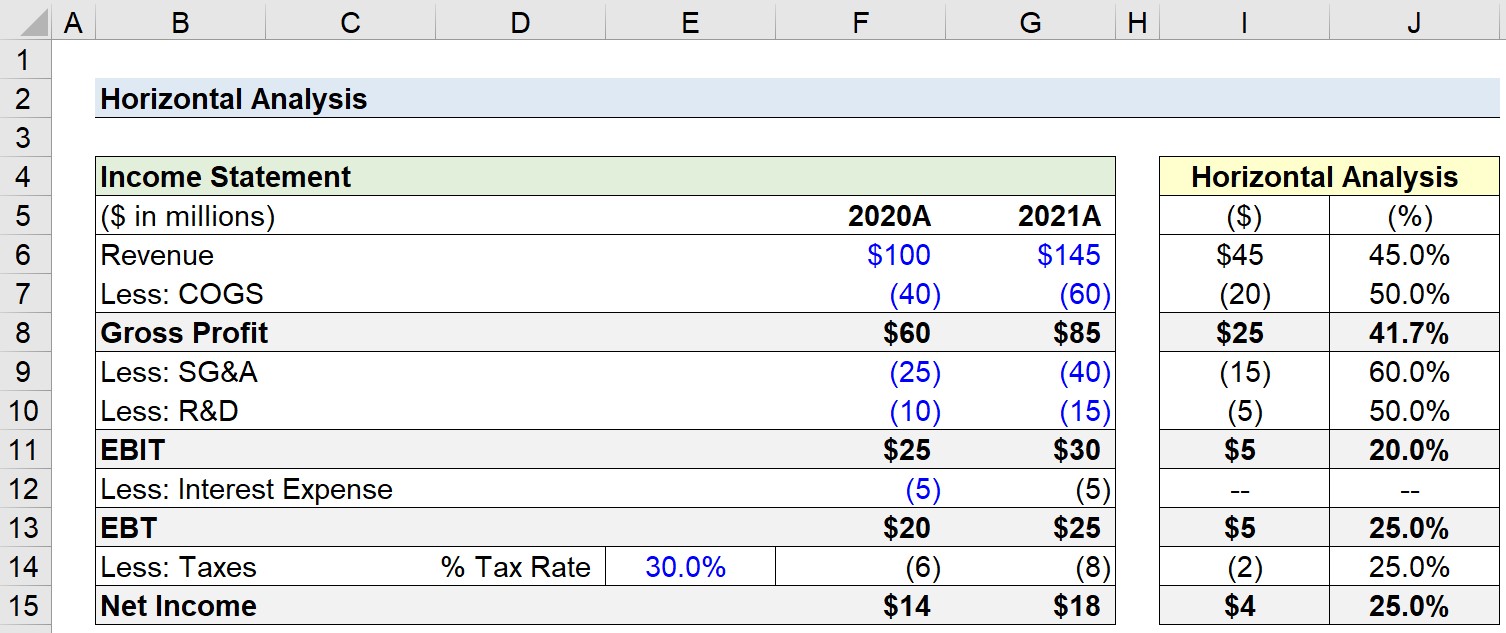
The first step to performing a horizontal analysis is to calculate the net difference — in dollar terms ($) — between the comparable periods.
From 2021 to 2020, we’ll take the comparison year (2021) and subtract the corresponding amount recorded in the base year (2020).
Once repeated for each line item, we are left with the following in the right column:
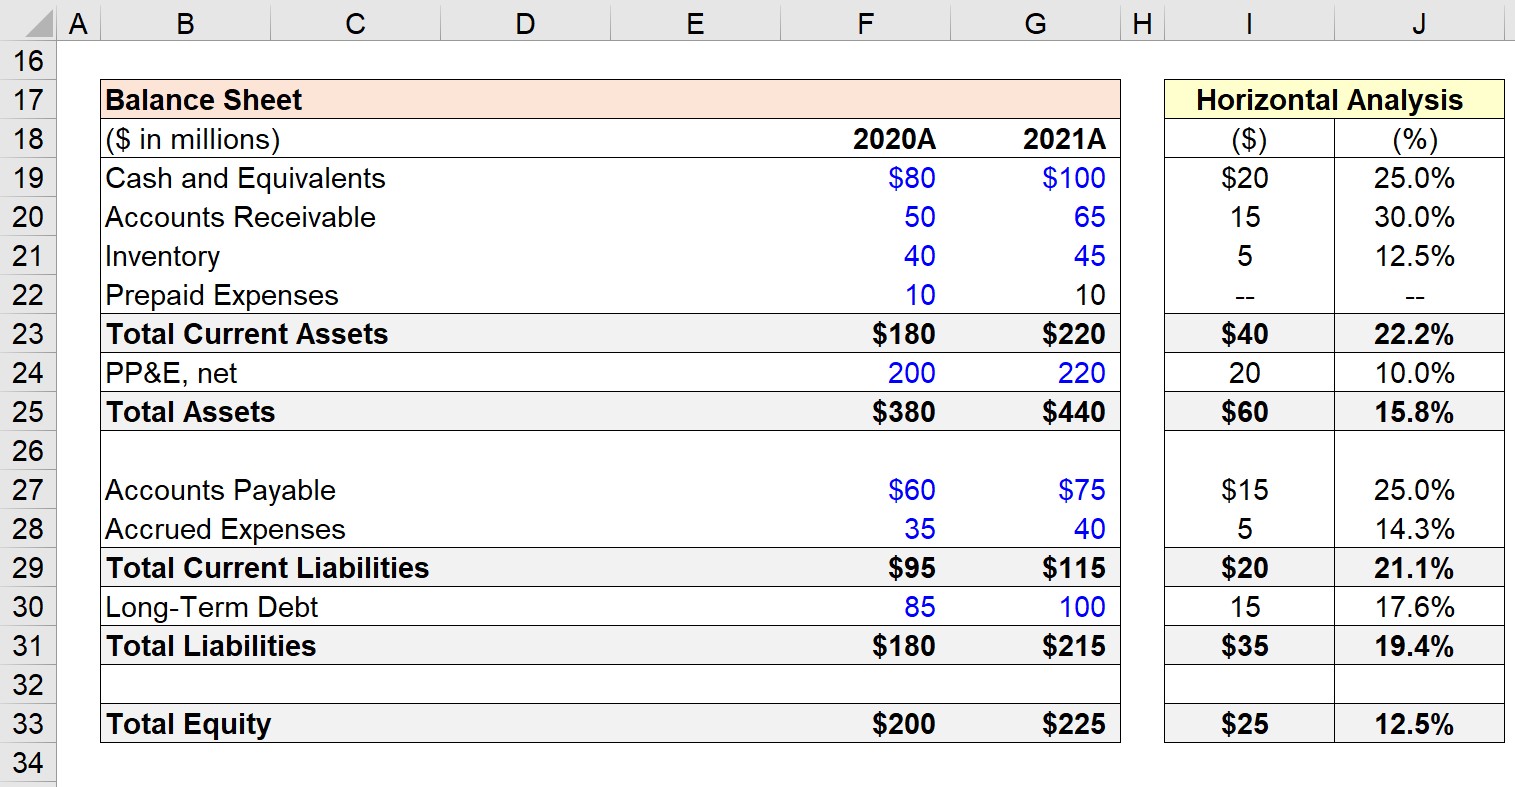
In the final section, we’ll perform a horizontal analysis on our company’s historical balance sheet.
As in the prior step, we must calculate the dollar value of the year-over-year (YoY) variance and then divide the difference by the base year metric.
In conclusion, we’re able to compare the year-over-year (YoY) performance of our company from 2020 to 2021.
While the net differential on its own does not provide many practical insights, the fact that the difference is expressed in percentage form facilitates comparisons to the company’s base period and to the performance of that of its comparable peers.


What if I have one year?