The Percent Change is the relative difference between the ending and beginning value of a metric, expressed as a percentage.
The following Excel tutorial will illustrate the step-by-step process to calculate the percentage change, including the formula, keyboard shortcut method, and formatting guidelines.
How to Calculate Percent Change in Excel?
The percent change measures the increase or decrease in the value of a specific metric, expressed in percentage form.
In practice, the percentage change is often used to compare the values of two figures, such as the growth rate in a company's revenue across a two-year period, or the change in the pricing of a product.
Percentage Increase → If the percent change is positive, then the ending value grew relative to the beginning value (i.e. “upward trajectory”).
Percentage Decrease → If the percent change is negative, then the ending value declined relative to the beginning value (i.e. “downward trajectory”).
The percent change can be calculated using the following steps:
Calculate the Difference Between the Ending and Beginning Value
Divide the Difference by the Beginning Value
Multiply by 100 to Convert the Decimal into Percentage Form
Conversely, a marginally easier method to calculate the percentage change consists of the following steps:
Divide the Ending Value by the Beginning Value
Subtract 1 from the Quotient
Multiply by 100 to Convert the Decimal into Percentage Form
Percent Change Formula
The percent change formula is as follows.
Percent Change (%) = (Ending Value – Beginning Value) ÷ Beginning Value
The difference between the ending value (i.e. current) and beginning value (i.e. original) can either be a positive or negative integer.
Increase / (Decrease) = Ending Value – Beginning Value
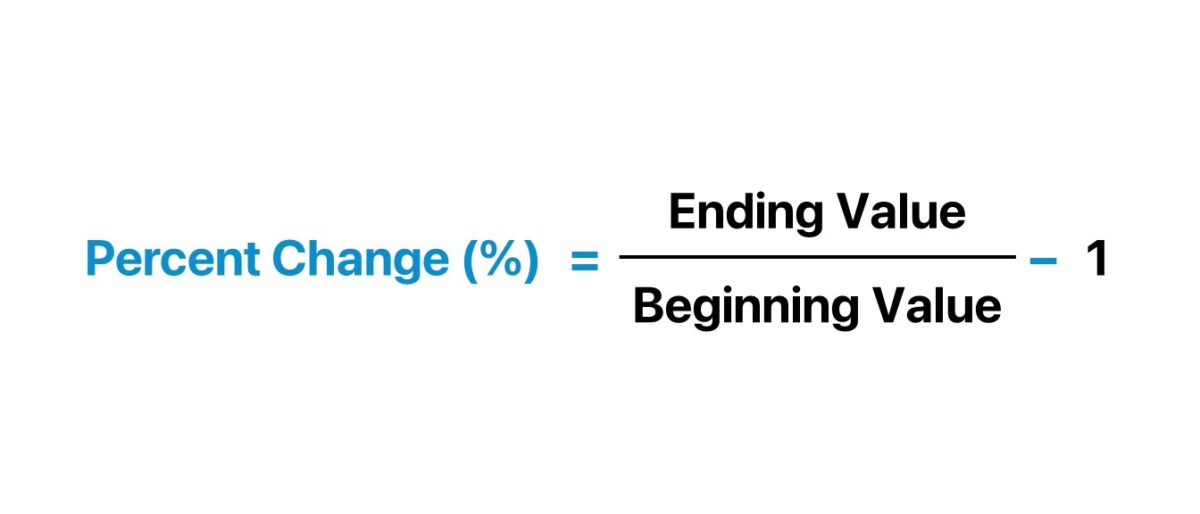
Percentage Change Equation
The other method to compute the percentage change uses the following formula instead.
If calculating the percentage change manually by hand, the resulting figure under either method must be multiplied by 100 to convert the rate into a percentage.
In effect, comparisons between industry peers or historical figures becomes much easier.
Simplifying Percent Change Analysis with AI
Calculating percent changes in Excel is a fundamental task for finance professionals, but it can become overwhelming when dealing with complex datasets or frequent updates. Artificial intelligence simplifies this process by automatically identifying key changes, trends, and anomalies. With AI-powered analytics, professionals can shift from tedious calculations to strategic interpretation. Wall Street Prep and Columbia Business School Executive Education addressed this evolving need with the AI for Business & Finance Certificate Program, which teaches participants how to transform basic spreadsheet work into smarter business decisions using AI tools.
What is the Percent Change Keyboard Shortcut in Excel?
By default, Excel returns the computed fraction – i.e. the partial number – in decimal notation.
To convert the output in decimal notation into a percentage in Excel, there are four options:
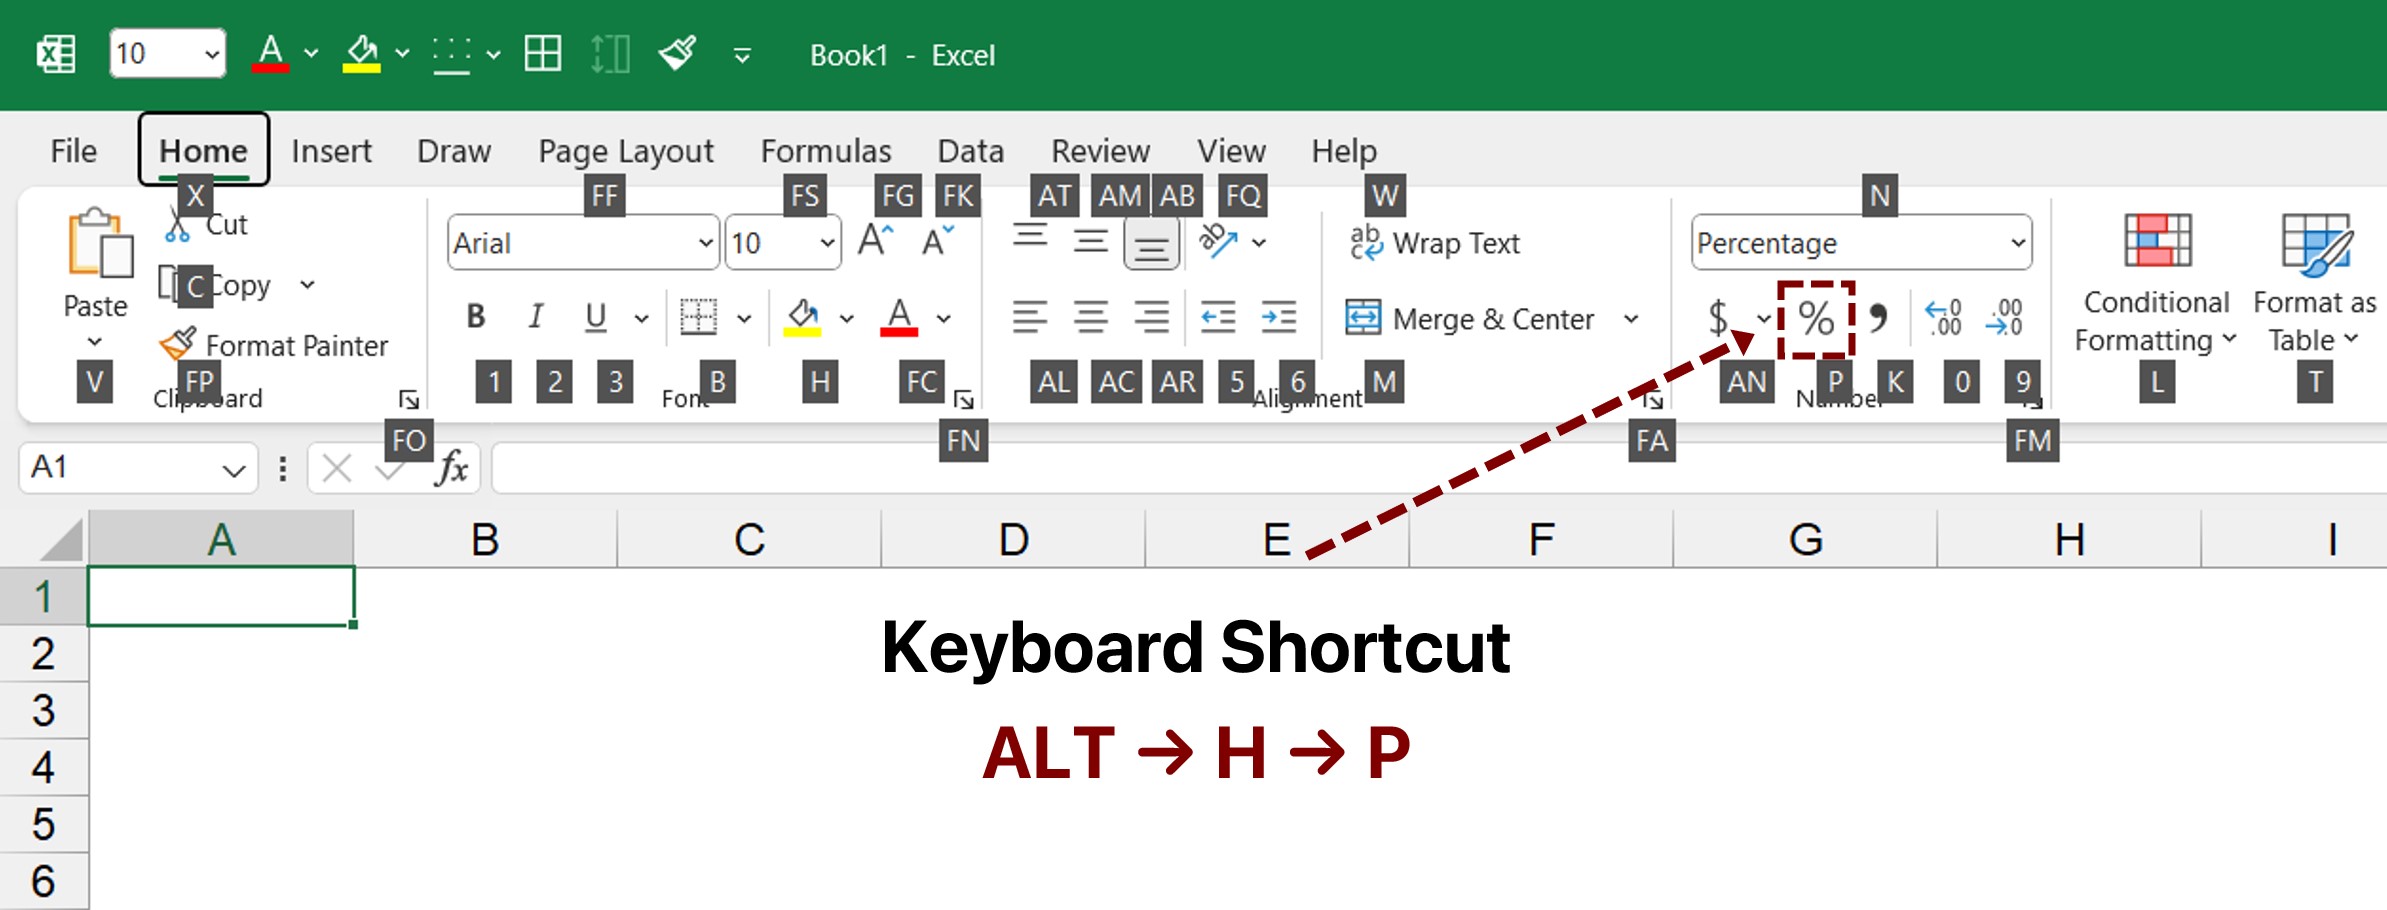
Click the “%” Symbol in the “Numbers” Group on the “Home” Tab
Select “Percentage” in the Drop-Down List in the “Numbers” Group
Press “Ctrl” + “Shift” + “5”
Press “Alt” + “H” + “P”
Of the four approaches, the latter two do not require any usage of the mouse (and are thus more efficient).
While the difference might initially seem negligible, relying on keyboard shortcuts is far more convenient and results in time savings in the long run.
How to Format as Percentage in Excel?
There are built-in formatting features in Excel to automatically format a cell value as a percentage.
The final step in which the output is multiplied by 100 is unnecessary if using Excel, assuming the percentage formatting is properly applied to the cell.
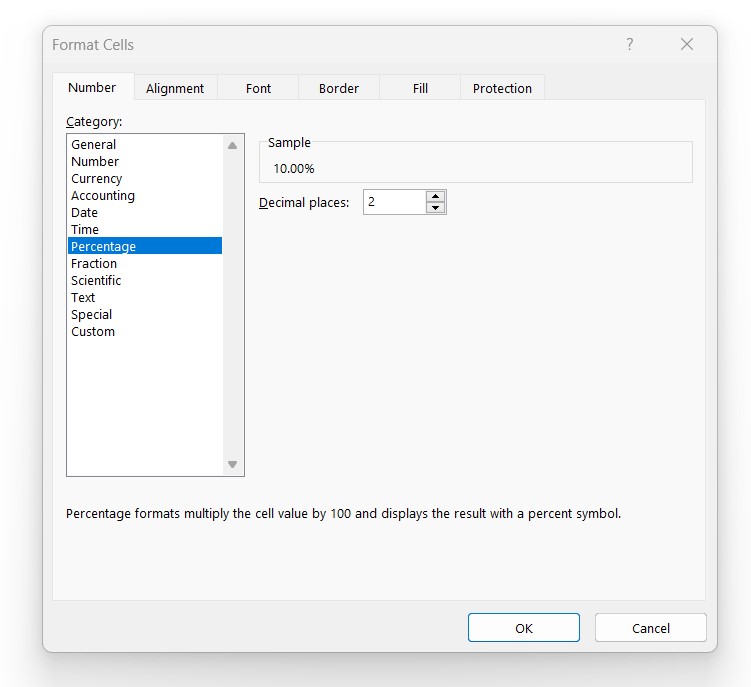
By adjusting the settings in Excel, the formatting of cells can be changed into a percentage using the following steps.
Press “Ctrl” + “1” to Open the “Format Cells” Dialog Box
Click “Percentage” in the “Number” Category
Enter the Number of Decimal Places to Display
Press “Enter” or Click “OK” to Format the Selected Cell(s)
Note that the “Percentage” option is among the default selections in Excel, i.e. is part of the generic set of format styles.
Since practically all firms use custom formatting, we recommend becoming familiar with the guidelines around custom formats in Excel, such as displaying negative percentages in parentheses and spacing.
How to Change the Number of Decimal Places?
The number of decimal positions shown can be adjusted using keyboard shortcuts.
The option to decrease or increase the number of decimal places can be found in the “Number” group, however, usage of the mouse should be minimized.
To increase the number of decimal places shown, press the following keys.
Increase Number of Decimal Places → Alt + H + 0
On the other hand, to decrease the number of decimal places shown, press the following keys.
Decrease Number of Decimal Places → Alt + H + 9
Note: For the keyboard shortcuts that start with “Alt”, each individual key must be pressed one by one in the stated order, rather than all at once.
Percent Change Calculator
We’ll now move to a modeling exercise, which you can access by filling out the form below.
Excel Template | File Download Form
You’re logged in! Form submission not required. Access your file below.
Suppose we're tasked with calculating the percent change in the gross domestic product (GDP) of the U.S. from 2019 to 2022.
The quarterly economic data retrieved by FRED on the historical GDP of the U.S. over the four-year time frame – reported on a seasonally adjusted annual rate basis – is as follows.
Starting off, we'll determine the percentage change in the U.S. GDP on a quarterly basis.
The formula to calculate the quarterly percent change is the differential between the current quarter's GDP and the prior quarter's GDP, which is then divided by the prior quarter's GDP.
For example, the quarterly percentage change in Q1-2023 was an increase of 1.5%.
Once complete, we'll repeat the same process for each quarter in our Excel spreadsheet.
3. Annual Percent Change Calculation Example
In the final section, we'll measure the percentage change in the U.S. GDP on an annual basis.
The only adjustment to the formula to compute the percentage change is the preceding period input, i.e. the time in between the periods under comparison is now twelve months (or one year).
The matching period that coincides with Q1-2023 in measuring the annual percent change is Q1-2022, as opposed to Q4-2022, for instance.
The annual percent change in Q1-2023 comes out to 7.23%, which we determined using the alternative formula, i.e. “Percent Change (%) = (Ending Value ÷ Beginning Value) – 1"







No comments yet.