What is the Excel CHOOSE Function?
The CHOOSE Function in Excel returns the value of a cell based on a specified position and range.

The CHOOSE Function in Excel returns the value of a cell based on a specified position and range.
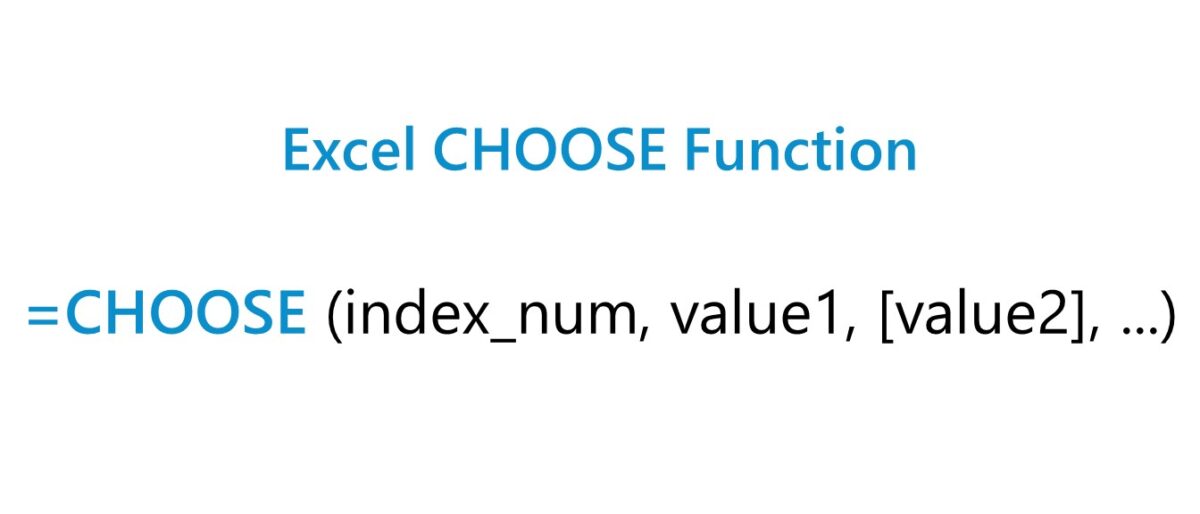
The Excel “CHOOSE” function is a built-in feature used to pick a certain value from a selected range.
Given a range and a specified position, the function will return the cell value that corresponds to the number input.
In practice, the CHOOSE function is one method to integrate scenario analysis into a financial model.
For instance, most financial models contain various cases to evaluate a company under different sets of assumptions.
At a bare minimum, most models contain three different types of cases.
The option to select different cases creates a more practical financial model given the uncertainty involved in forecasting.
Aside from the CHOOSE function, two other Excel functions often used as part of scenario analysis are the following:
The formula for using the CHOOSE function in Excel is as follows.
We’ll now move on to a modeling exercise, which you can access by filling out the form below.


Suppose we’re tasked with integrating three different operating scenarios into a financial model.
The three different operation scenarios will be those mentioned earlier, i.e. the “Base Case”, “Upside Case” and “Downside Case”.
Our first step is to create a cell that will function as the “toggle” to switch between the different cases.
Once chosen, we’ll also name the cell “Case” by selecting the cell and typing in “Case” into the active cell box on the top far left corner.
While not applicable to our model, naming cells can make entering formulas into more complex financial models more efficient, although it should not be overdone.
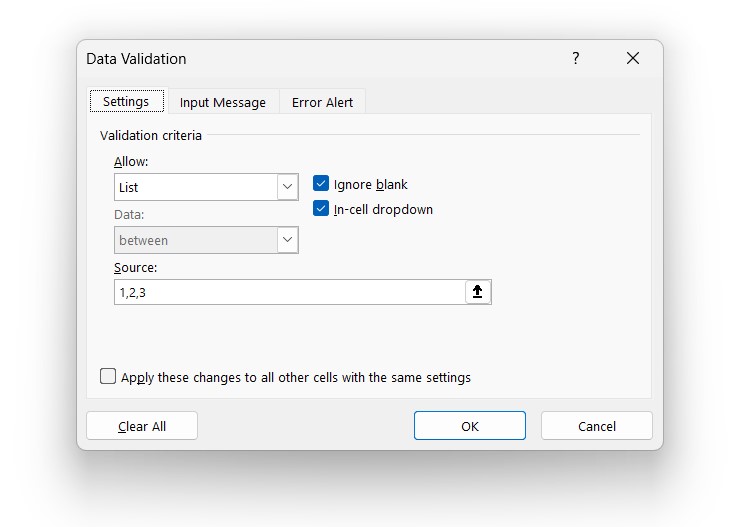
Next, to ensure that anyone that views the model can easily tell which operating scenario is currently active, we’ll create a drop-down list to select the case.
In the cell below – while an optional step – we’ll enter an “IF” function to show the specific operating case running.
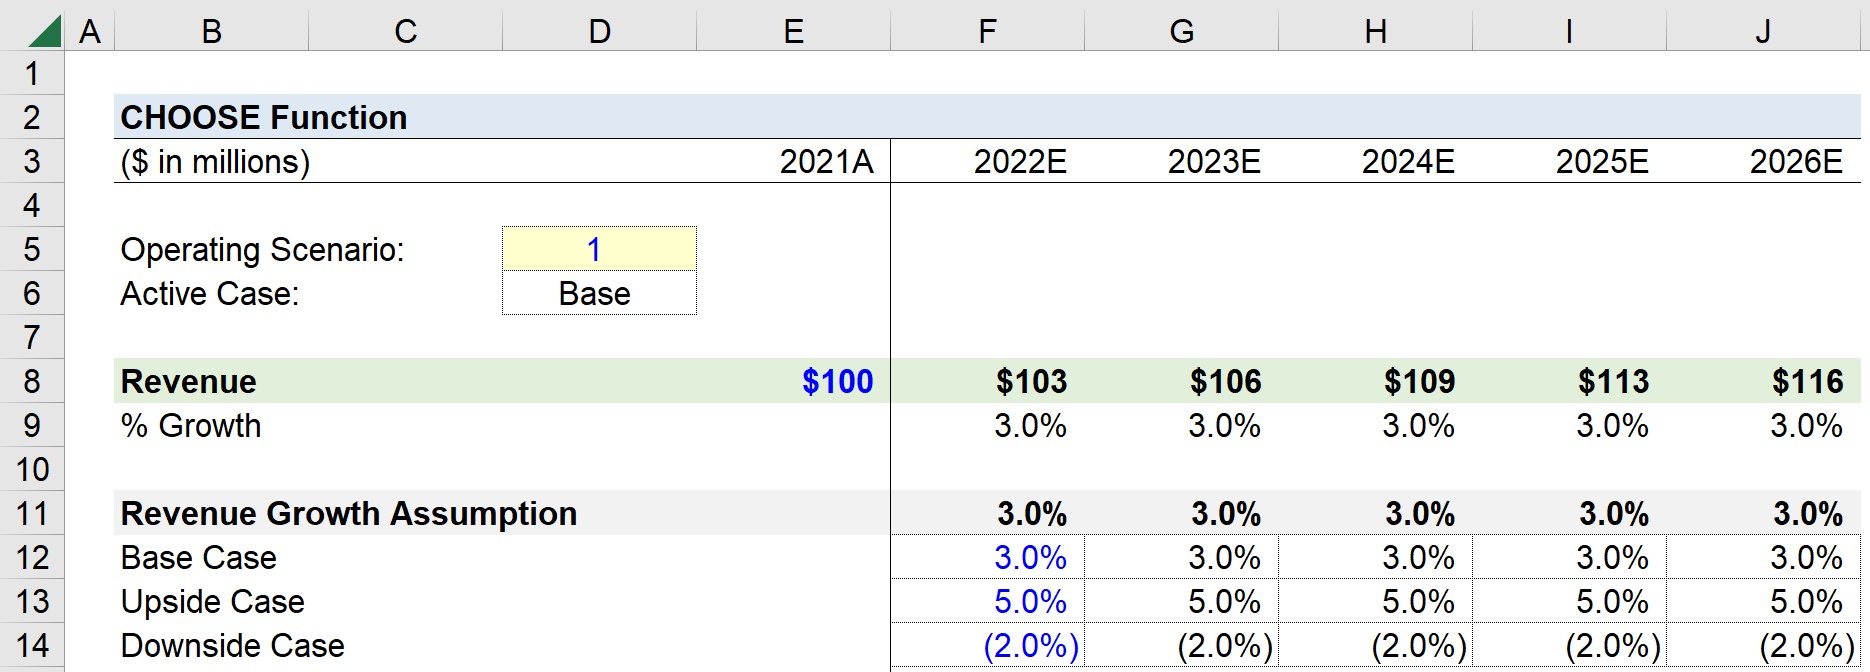
Thus far, we've created a row that contains our hypothetical company’s historical (and projected) revenue figures, along with a section at the bottom that lists the assumptions from which to pick.
We’ll forecast revenue for the next five periods, using the following set of revenue growth assumptions.
For the sake of simplicity, the assumptions for the periods that come after Year 1 of the forecast will be linked to the initial assumption (i.e. straight-lined and maintained across the projection period).
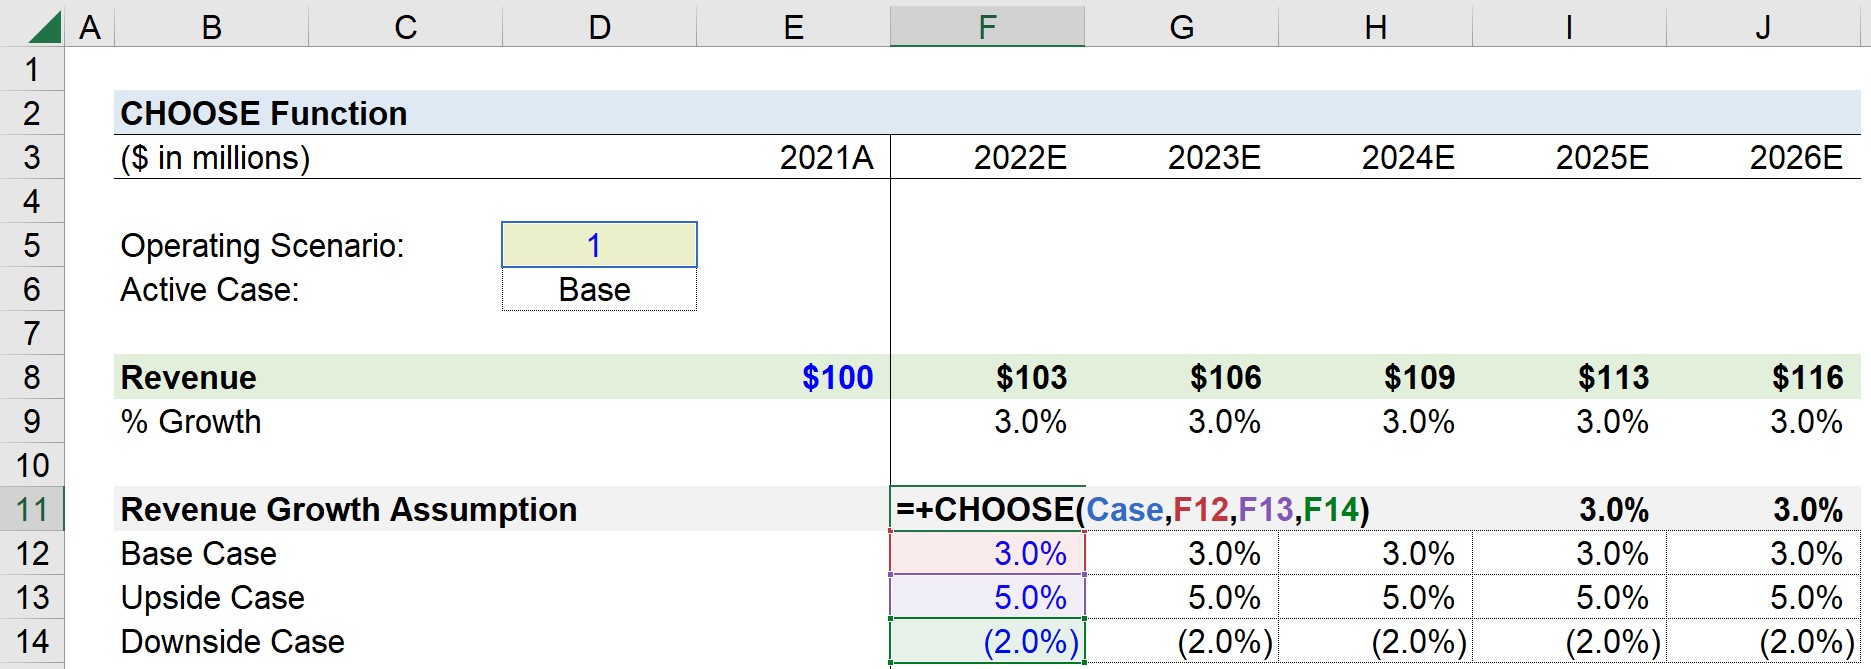
On top of our assumptions table, we'll enter the following "CHOOSE" formula to select the correct revenue growth assumption.
After doing so, we’ll enter the following formula into our Year 1 (2022E) revenue cell.
Since our operating case switch is currently set at “1”, our starting revenue of $100 million increases by 3.0% from the prior period.
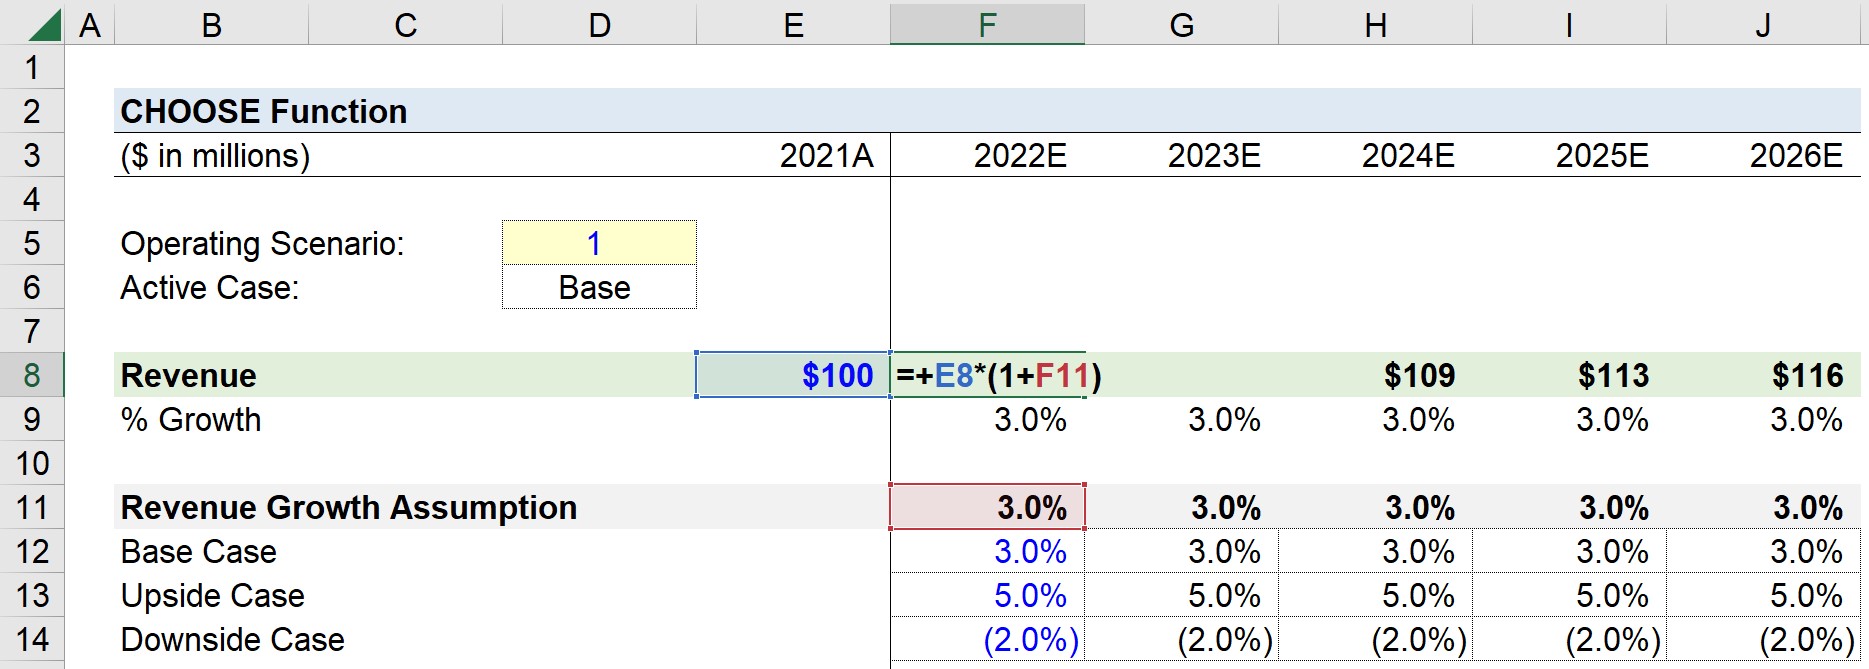
If set to “2”, the revenue would grow by 5.0% YoY under our upside case assumption or decline by 2.0% if set to “3” under our downside case assumption.
In closing, our model has now integrated three different scenarios using the CHOOSE function in Excel.



No comments yet.