What is the Excel RRI Function?
The RRI Function in Excel returns the equivalent interest rate on an investment, i.e. the annualized rate of return, over a specified time frame.

The RRI Function in Excel returns the equivalent interest rate on an investment, i.e. the annualized rate of return, over a specified time frame.
The RRI function is a built-in feature of Excel used to calculate the rate of return, or the equivalent interest rate, on an investment across a stated time period.
The equivalent interest rate is defined as the rate of return earned on an investment, factoring in the effects of compounding.
For instance, if a corporate bond pays interest on a semi-annual basis, the annual equivalent rate (AER) converts the semi-annual rate of return into an annualized growth rate.
Since different investments compound at varying frequencies, an annualized rate of return can be useful for purposes of capital allocation since the investments can be compared on an apples-to-apples basis to determine which option yields the highest returns.
The Excel RRI function is frequently used to calculate an investment’s compound annual growth rate (CAGR), which measures the growth of an investment as if its value had steadily grown at a consistent rate on an annualized basis, including the effects of compounding.
The CAGR calculation is among one of the most practical tools for determining the return on an investment that rises and declines in value over time because the returned rate of return is “smoothed out” across the holding period.
There are other methods to calculate the CAGR of an investment aside from the RRI function such as the RATE function or using the manual formula, which is described below.
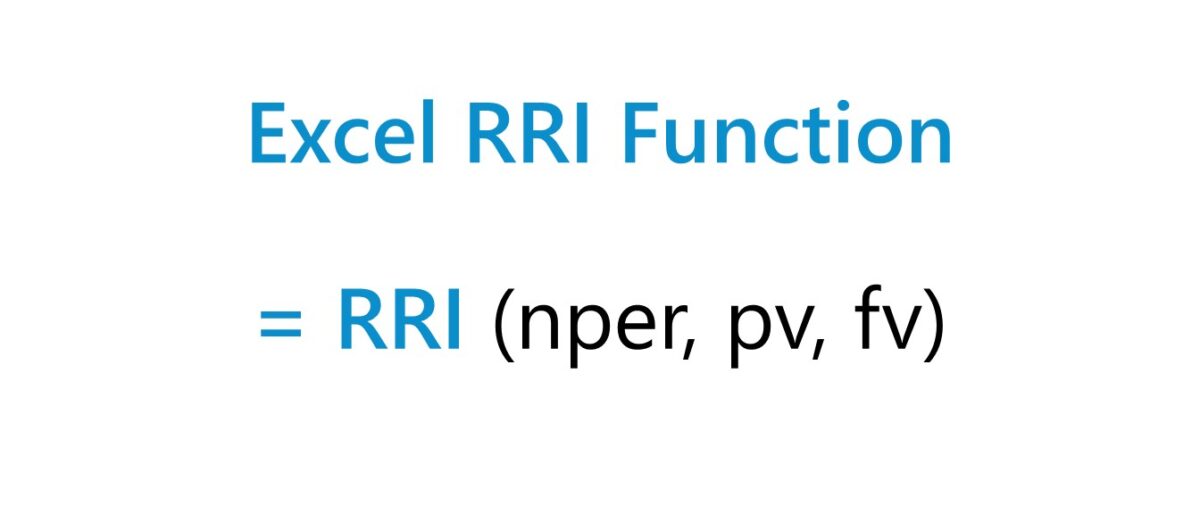
The formula for using the RRI function in Excel is as follows.
There are only three inputs required in the calculation, but the “nper” input must be adjusted accordingly.
| Periodicity | Adjustment Formula |
|---|---|
| Months |
|
| Quarterly |
|
| Semi-Annual |
|
| Annual |
|
We’ll now move on to a modeling exercise, which you can access by filling out the form below.


Suppose we’re tasked with calculating the compound annual growth rate (CAGR) on an investment using the RRI function in Excel.
The fair market value (FMV) of the asset on the present date, i.e. the date on which the asset was purchased, was $100,000.
The holding period of the investment was 10 years in length, with quarterly compounding.
If the asset is sold at the end of the ten year holding period for $220,000 in proceeds, what is the implied CAGR on the investment?
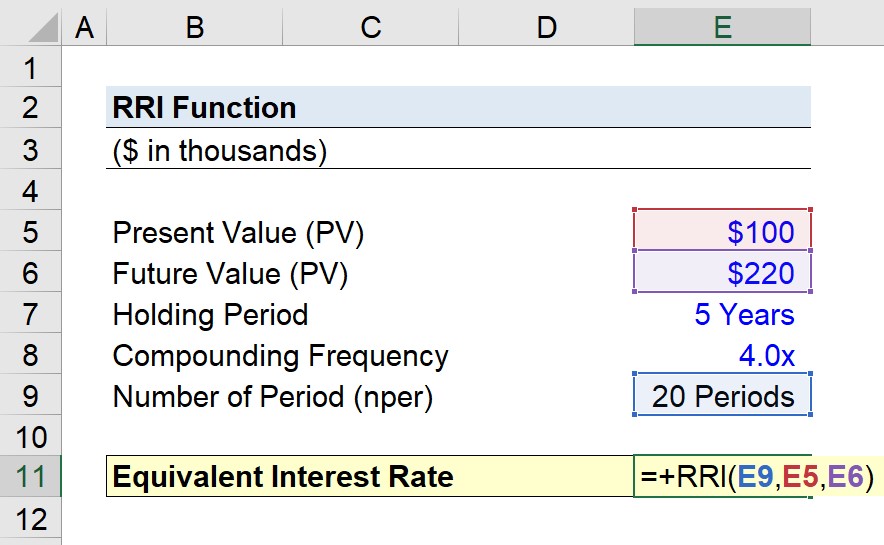
The first step to calculate the CAGR on the investment is to adjust the five year holding period to match the periodicity at which interest is compounded.
By multiplying five by four (i.e. the number of years by the quarterly adjustment factor), the total number of compounding periods comes out to 20 periods.
Since the values of all three inputs—the present value, the future value and the number of compounding periods—are now all known, we can enter them into RRI function formula in Excel.
The equivalent interest rate, i.e. the CAGR, on the investment comes out to 4.0%.



No comments yet.