What is MIRR?
The MIRR Function in Excel calculates the modified internal rate of return, which factors in the cost of capital and reinvestment rate of the cash flows of a project or company.

The MIRR Function in Excel calculates the modified internal rate of return, which factors in the cost of capital and reinvestment rate of the cash flows of a project or company.
MIRR stands for the “Modified Internal Rate of Return” and measures the potential profitability (and returns) from undertaking a project or investment.
The MIRR function in Excel, as implied by the name, is different from the traditional IRR function in that:
For purposes of capital budgeting, the following rules are generally followed:
When comparing numerous projects, the one with the highest MIRR is likely the one to pick, especially if other metrics also lead to the same conclusion.
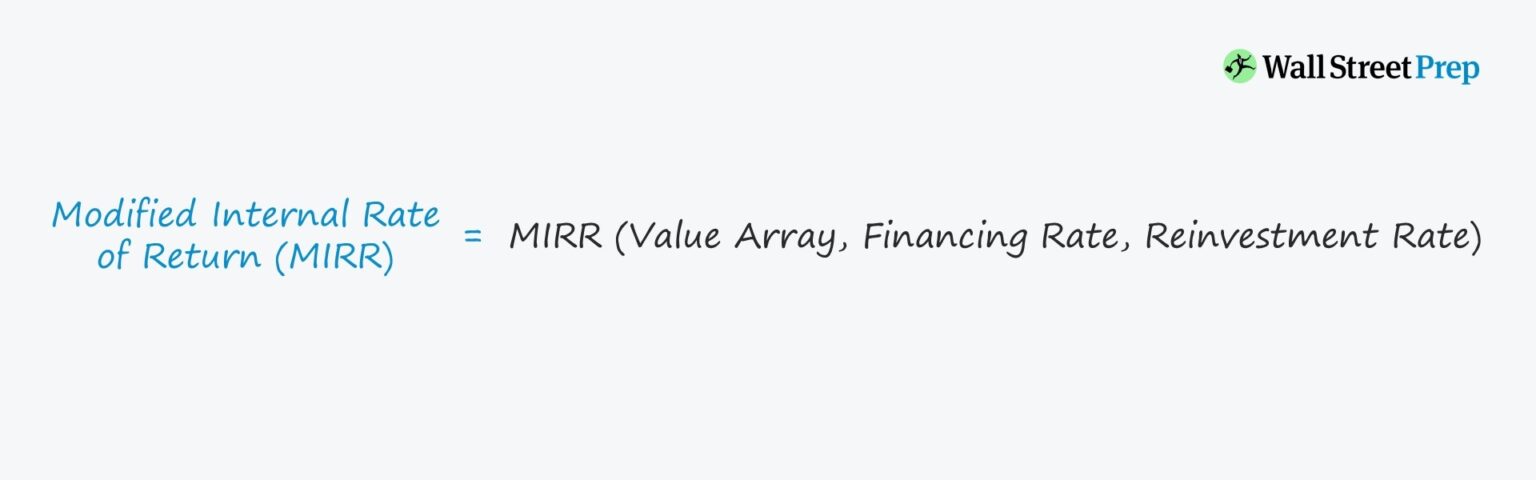
The modified internal rate of return (MIRR) formula in Excel is as follows.
The inputs in the MIRR formula are as follows:
The initial outlay must be entered as a negative number in Excel for the formula to work properly.
The issue with the IRR Excel function is the implicit assumption that future positive cash flows are reinvested at the project or company's cost of capital (i.e. required rate of return).
Critics of the IRR function argue that the assumption that the reinvestment rate is equal to the cost of capital overstates the return on the project or investment.
The reinvestment rate and cost of capital are often different in reality, so MIRR provides the option to specify a different reinvestment rate for future cash flows.
In effect, the MIRR Excel function is considered a more conservative measure compared to the IRR function (and usually results in a lower return).
One limitation to the MIRR Excel function is that it assumes 100% of cash flows are reinvested into the project/company, which is not always the case.
Hypothetically, one could adjust the reinvestment rate and financing rate for each progressive stage, but doing so brings up the issue of uncertainty around the timing of specific actions.
In other words, attempting to precisely model out the reinvestment rate, financing rate, and cost of capital for each period does not necessarily add more accuracy to the analysis due to future uncertainty.
The IRR Excel function remains frequently used due to its simplicity, however.
We’ll now move to a modeling exercise, which you can access by filling out the form below.


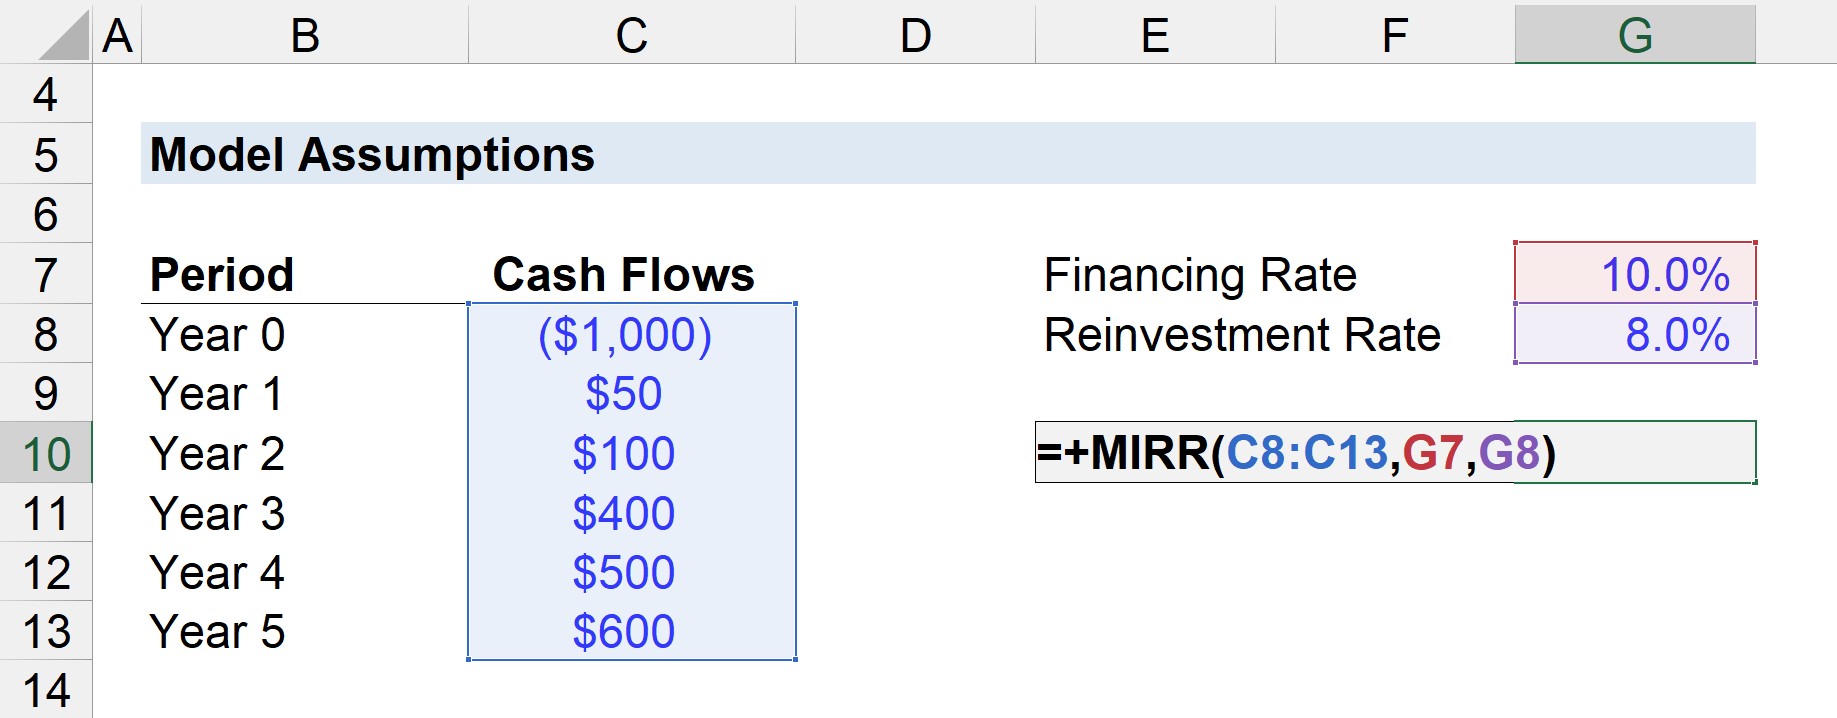
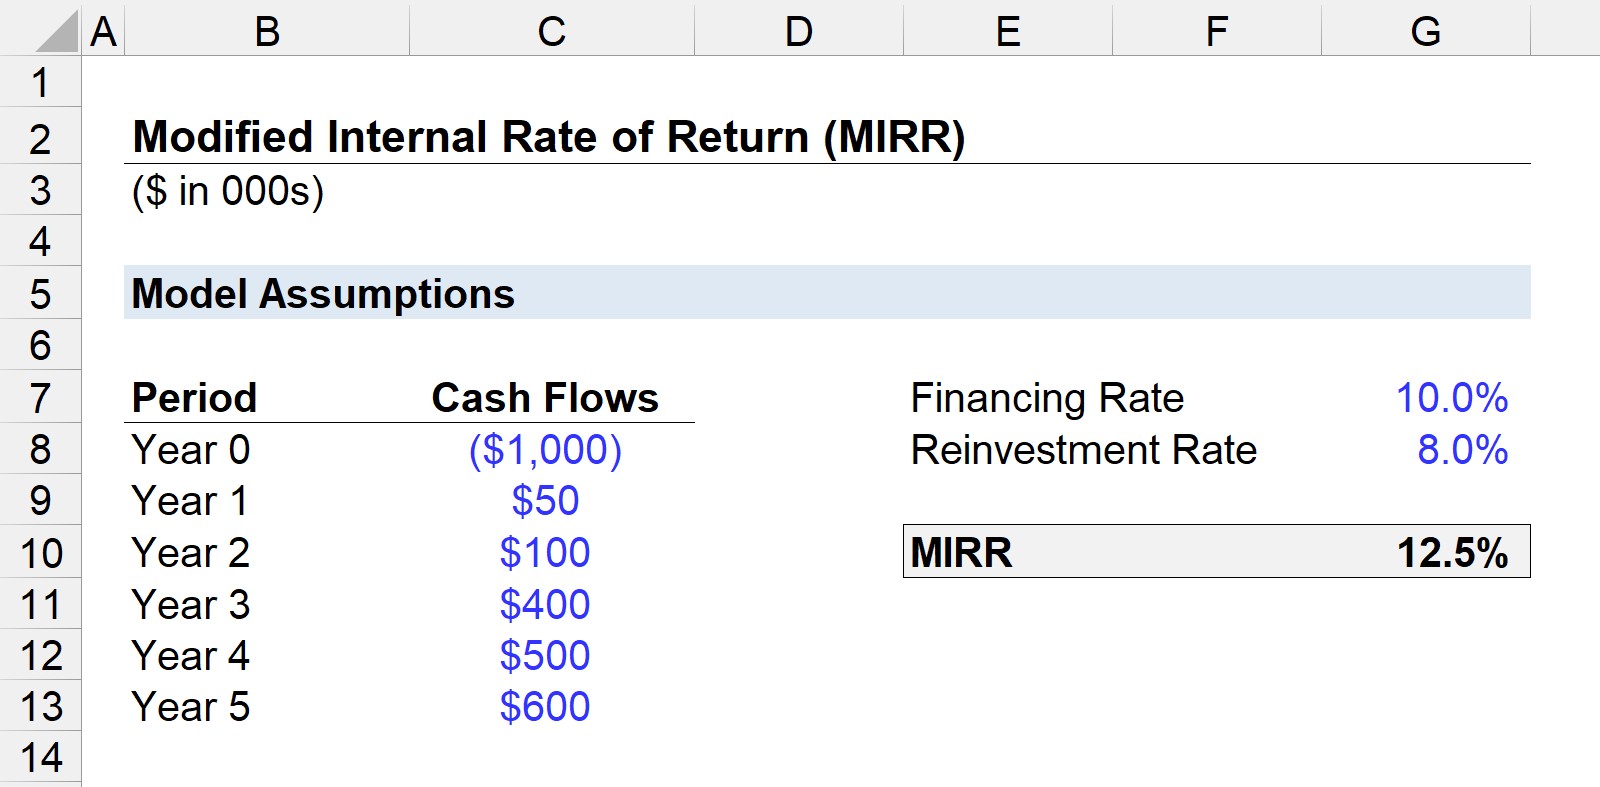
In our example scenario, we will be assuming a project has an initial cost of $1 million.
After the initial cash outlay during the initial period (Year 0), the project is projected to produce the following cash flow amounts each year:
As for the financing rate and reinvestment rate, we'll assume the following:
The greater the difference between the financing rate and reinvesting rate, the more that the IRR and MIRR will diverge from each other.
If we enter the provided assumptions into the Excel formula, we get 12.5% as the MIRR.
The MIRR formula entered for our model is shown below:
Conversely, if we had used the IRR function, the resulting IRR is 14%, which demonstrates how MIRR is viewed as a more conservative measure.
But again, whether MIRR is more "accurate" or not is dependent on the amount of information on hand and the rationale behind the associated assumptions.




No comments yet.