What is the Cash Flow Per Share?
The Cash Flow Per Share measures the operating cash flow (OCF) generated by a company that is attributable to each outstanding common share.

The Cash Flow Per Share measures the operating cash flow (OCF) generated by a company that is attributable to each outstanding common share.

In order to calculate a company’s cash flow per share, its operating cash flow (OCF) is first adjusted by any preferred dividend issuances and then divided by its total common shares outstanding.
The formula for calculating the cash flow per share metric is as follows.
However, there are numerous variations of the metric wherein free cash flow (FCF) metrics such as free cash flow to equity (FCFE) are used instead of operating cash flow (OCF).
Companies with more operating cash flows are better positioned to reinvest back into their operations, which indirectly benefits shareholders via share price appreciation, if publicly traded. The company could also repurchase shares or issue dividends to common shareholders, which is a form of direct compensation by either reducing dilution or via cash payments.
The earnings per share (EPS) formula divides net income by the total number of common shares outstanding, most often on a diluted basis.
Earnings Per Share (EPS) = Net Income ÷ Total Number of Diluted Common Shares Outstanding
One notable use-case of the cash flow per share metric is that it can be used to support a company’s earnings per share (EPS) growth, i.e. to confirm that EPS increased year-over-year (YoY) due to greater profitability and cash flows rather than accounting tricks (or even fraud).
The distinction between the two metrics is tied to the company’s investing and financing activities.
We’ll now move on to a modeling exercise, which you can access by filling out the form below.


Suppose a company had the following historical financial data from the past two fiscal years.
| Model Assumptions | ||
|---|---|---|
| ($ in millions) | 2020A | 2021A |
| Net Income | $180 million | $200 million |
| Plus: Depreciation and Amortization (D&A) | $50 million | $25 million |
| Less: Increase in Net Working Capital (NWC) | $10 million | ($10 million) |
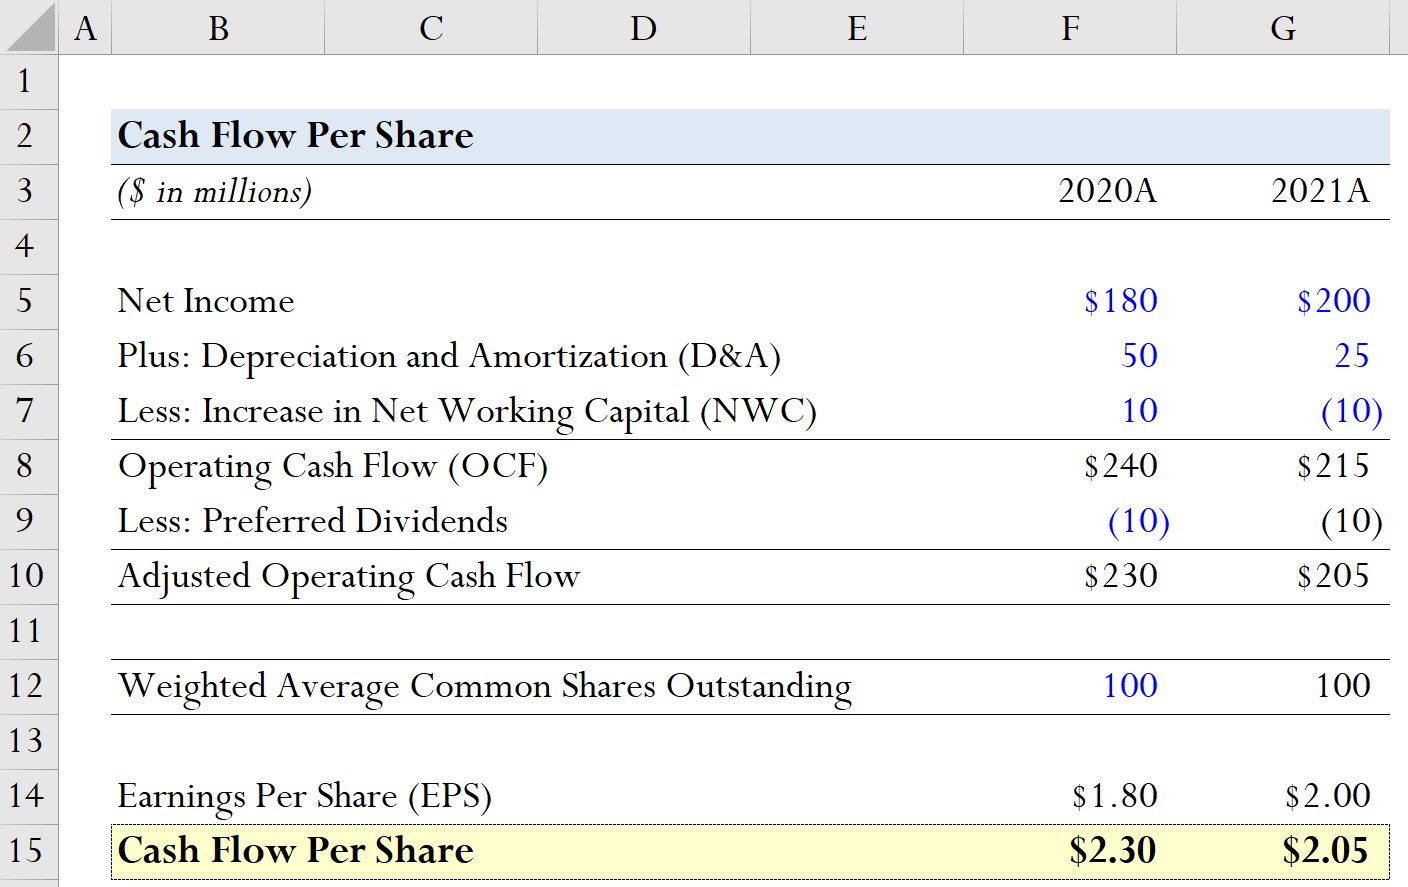
Using these model assumptions, we can add D&A and subtract the increase in NWC to calculate the operating cash flow for each period.
From the OCF calculations, we can see that the company’s OCF has declined by $15 million year-over-year, so it would be reasonable to assume that cash flow per share will also be lower in 2021.
In the next step, we’ll assume that our company's preferred dividend issuance amounted to $10 million in both periods.
As for our hypothetical company’s share count, we’ll assume the weighted average common shares outstanding stays constant at 100 million in both years.
In order to see where the cash flow per share metric can be most useful, we’ll also calculate the earnings per share (EPS) of our company.
2020A
2021A
From 2020 to 2021, our company’s EPS grew from $1.80 to $2.00, an increase of $0.20.
In the final part of our modeling exercise, we’ll calculate the cash flow per share for each period.
2020A
2021A
Therefore, by calculating cash flow per share, we've identified that the company’s positive EPS growth is questionable and must further investigate to determine the real driver behind the growth.

Enroll in The Premium Package: Learn Financial Statement Modeling, DCF, M&A, LBO and Comps. The same training program used at top investment banks.


No comments yet.