What is Inventory Turnover Ratio?
The Inventory Turnover Ratio measures the number of times that a company replaced its inventory balance across a specific time period.

The Inventory Turnover Ratio measures the number of times that a company replaced its inventory balance across a specific time period.
The inventory turnover ratio is a financial metric that portrays the efficiency at which the inventory of a company is converted into finished goods and sold to customers.
Simply put, the inventory turnover ratio measures the efficiency at which a company can convert its inventory purchases into revenue.
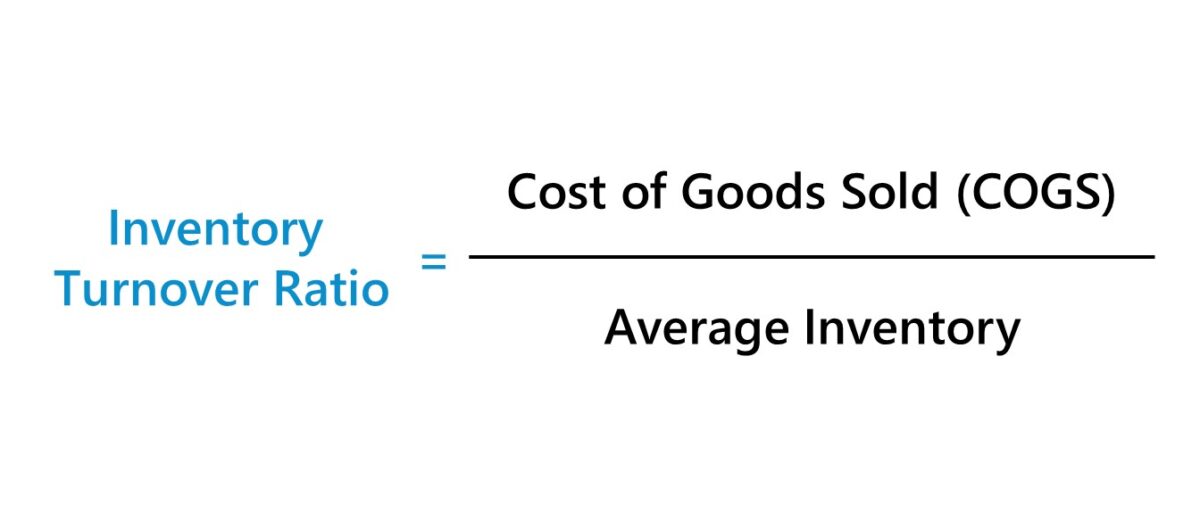
The inventory turnover ratio is calculated by dividing the cost of goods sold (COGS) by the average inventory balance for the matching period.
Thus, the inventory turnover rate determines how long it takes for a company to sell its entire inventory, creating the need to place more orders.
The steps for calculating the inventory turnover ratio are the following:
The formula used to calculate a company's inventory turnover ratio is as follows.
While COGS is pulled from the income statement, the inventory balance comes from the balance sheet.
In effect, a mismatch is created between the numerator and denominator in terms of the time covered.
The inventory turnover ratio is closely tied to the days inventory outstanding (DIO) metric, which measures the number of days needed by a company to sell off its inventory in its entirety.
The relationship between the two working capital metrics – the inventory turnover rate and days inventory outstanding (DIO) – is as follows:
Unique to days inventory outstanding (DIO), most companies strive to minimize the DIO, as that means inventory sits in their possession for a shorter period.
Since the inventory turnover ratio represents the number of times that a company clears out its entire inventory balance across a defined period, higher turnover ratios are preferred.
We’ll now move on to a modeling exercise, which you can access by filling out the form below.


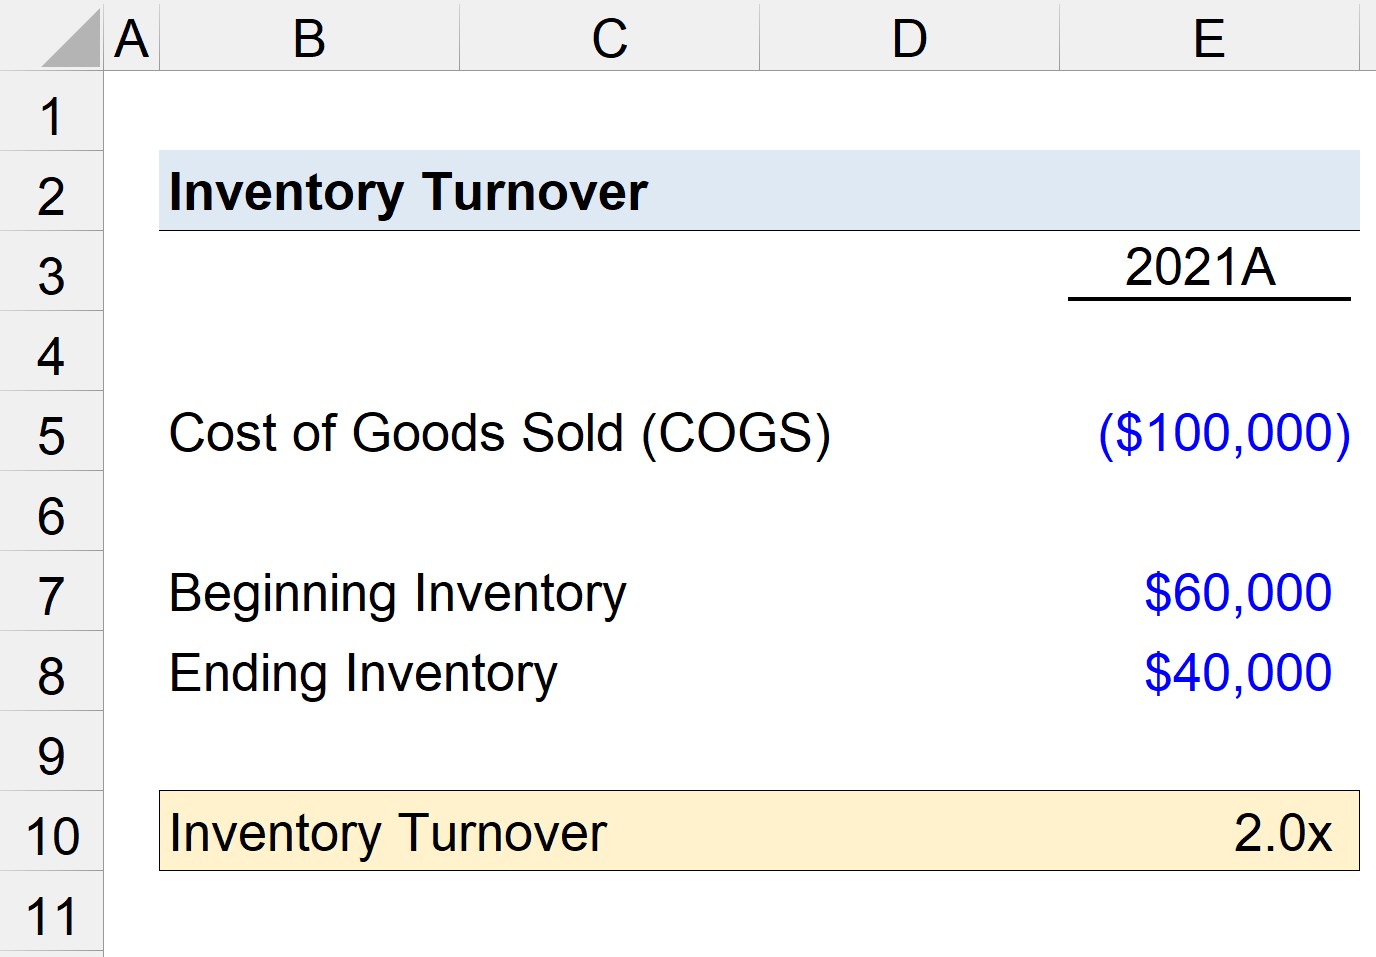
Suppose a retail company has the following income statement and balance sheet data.
For 2021, the company's inventory turnover ratio comes out to 2.0x, which indicates that the company has sold off its entire average inventory approximately 2.0 times across the period.
The analysis of a company's inventory turnover ratio to its industry benchmark, derived from its peer group of comparable companies can provide insights into its efficiency at inventory management.
For companies with low inventory turnover ratios, the duration between when the inventory is purchased, produced/manufactured into a finished good, and then sold is more prolonged (i.e. requires more time).
That said, low turnover ratios suggest lackluster demand from customers and the build-up of excess inventory.
For example, retailers are typically known for exhibiting high turnover ratios – in particular, “fast-fashion” retailers like Zara are highly regarded for their ability to research trends and clear out their inventory quickly.
However, if a company exhibits an abnormally high inventory turnover ratio, it could also be a sign that management is ordering inadequate inventory, rather than managing inventory effectively.
In such cases, the amount of pent-up demand (i.e. back orders, delayed deliveries, and speed) must be evaluated to understand the reality of the circumstances, as well as to see if there is an adverse impact on revenue.
Rather than being a positive sign, high turnover could mean that the company is missing potential sales due to insufficient inventory.
Some examples of practical diligence questions to ask (or answer) when assessing a company's inventory management are the following:

Enroll in The Premium Package: Learn Financial Statement Modeling, DCF, M&A, LBO and Comps. The same training program used at top investment banks.


Income ratio is a metric used to measure the ability of a technology to recover the investment costs through savings achieved from customer utility bill cost reduction. The ratio divides the “savings” by the “investment”; an SIR score above 1 indicates that a household can recover the investment.
Thank you for sharing this. Can you clarify how it is related to the topics covered in the article?