What is Fixed Asset Turnover?
The Fixed Asset Turnover Ratio measures the efficiency at which a company can use its long-term fixed assets (PP&E) to generate revenue.

The Fixed Asset Turnover Ratio measures the efficiency at which a company can use its long-term fixed assets (PP&E) to generate revenue.
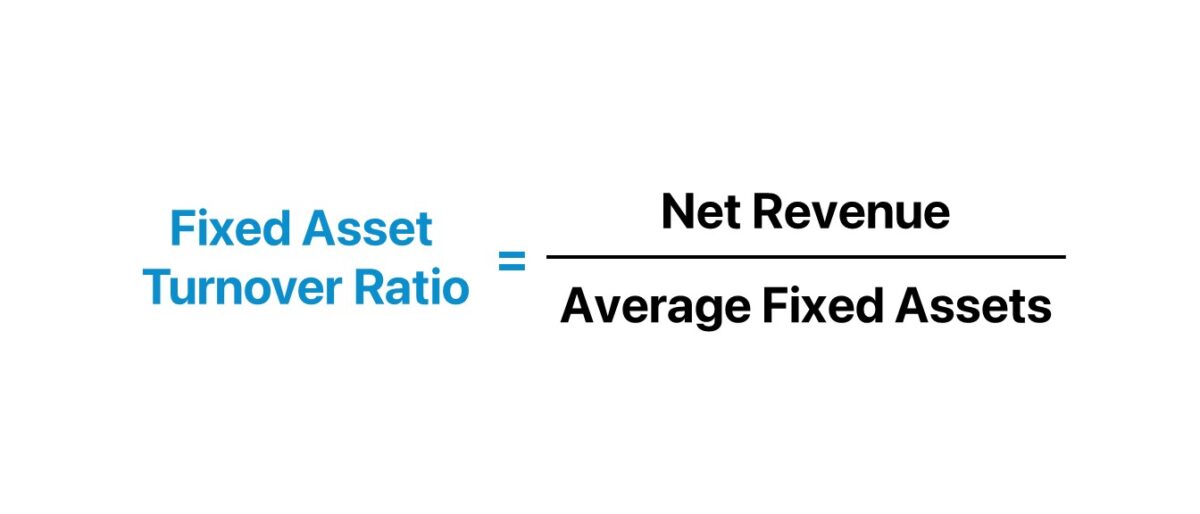
The fixed asset turnover ratio tracks how efficiently a company’s assets are being used (and producing sales), similar to the total asset turnover ratio.
However, the distinction is that the fixed asset turnover ratio formula includes solely long-term fixed assets, i.e. property, plant & equipment (PP&E), rather than all current and non-current assets.
Common examples of fixed assets that provide long-term economic benefits (>1 year) include the following:
Therefore, the fixed asset turnover ratio determines if a company’s purchases of fixed assets – i.e. capital expenditures (Capex) – are being spent effectively or not.
The formula to calculate the fixed asset turnover ratio compares a company's net revenue to the average balance of fixed assets.
Where:
The fixed asset turnover ratio answers, "How much revenue is generated per dollar of fixed asset owned?"
If a company's fixed asset turnover is 2.0x, it is implied that each dollar of fixed assets owned results in $2.00 of revenue.
In general, the higher the fixed asset turnover ratio, the better, as the company is implied to be generating more revenue per dollar of long-term assets owned.
Given how costly fixed asset purchases can be – on the initial date of purchase, as well as the associated maintenance (or replacement) expenses – Capex decisions must be carefully made.
Otherwise, operating inefficiencies can be created that have significant implications (i.e. long-lasting consequences) and have the potential to erode a company’s profit margins.
After calculating the fixed asset turnover ratio, the efficiency metric can be compared across historical periods to assess trends.
Comparisons to the ratios of industry peers can gauge how a company fares against its competitors regarding its spending on long-term assets (i.e. whether it is more efficient or lagging behind peers).
But to be useful, the ratio must be compared to industry comparables, or companies with similar characteristics as the target company, such as similar business models, target end markets, and risks.
The average ratio varies substantially across different industries. For instance, comparisons between capital-intensive (“asset-heavy”) industries cannot be made with “asset-lite” industries, since their business models and reliance on long-term assets are too different.
In particular, Capex spending patterns in recent periods must also be understood when making comparisons, as one-time periodic purchases could be misleading and skew the ratio.
We’ll now move to a modeling exercise, which you can access by filling out the form below.


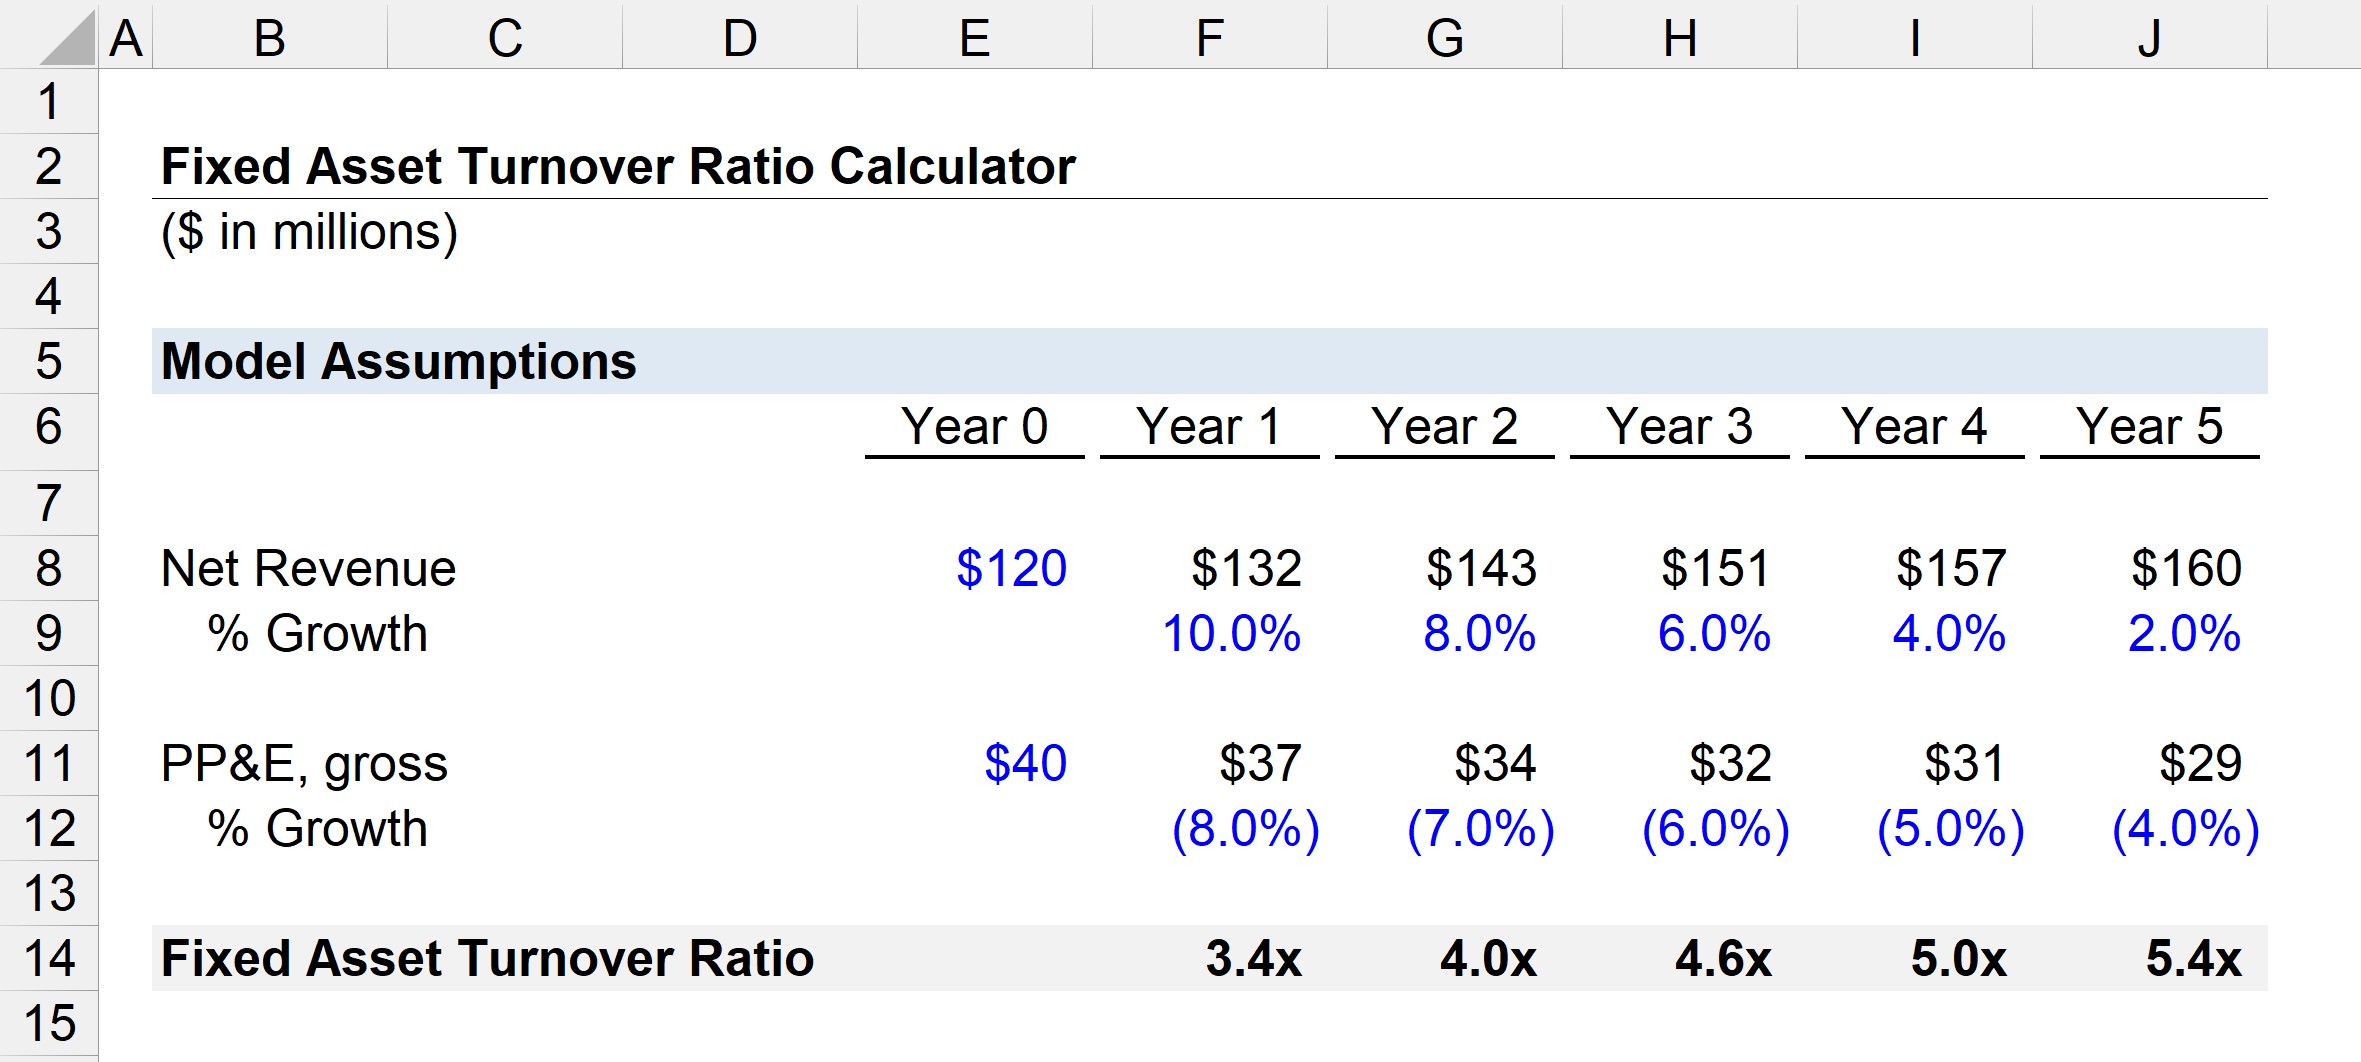
Suppose an industrials company generated $120 million in net revenue in the past year, with $40 million in PP&E.
After that year, the company’s revenue grows by 10%, with the growth rate then stepping down by 2% per year.
The company’s PP&E, the only fixed asset on its balance sheet, falls by 8% after Year 0 – with the growth rate then stepping up by 1% each year in each subsequent period (i.e. to negative 4% by the end of the projection period).
From Year 0 to the end of Year 5, the company's net revenue expanded from $120 million to $160 million, while its PP&E declined from $40 million to $29 million.
In our hypothetical scenario, we can assume that the company’s revenue model is shifting from being predominantly comprised of one-time expensive purchases to recurring component purchases and services related to maintenance.
Unlike the initial equipment sale, the revenue from recurring component purchases and services provided to existing customers requires less spending on long-term assets.
For example, inventory purchases or hiring technical staff to service customers are cheaper than major Capex.
We can now calculate the fixed asset turnover ratio by dividing the net revenue for the year by the average fixed asset balance, which is equal to the sum of the current and prior period balance divided by two.
The calculated fixed turnover ratios from Year 1 to Year 5 are as follows.
Despite the reduction in Capex, the company's revenue is growing – higher revenue is generated on lower levels of Capex purchases.
Since the company’s revenue growth remains robust across the 5-year forecast period, while its Capex spending declined in the same period, the fixed asset turnover ratio trends upward.

Enroll in The Premium Package: Learn Financial Statement Modeling, DCF, M&A, LBO and Comps. The same training program used at top investment banks.


No comments yet.