What is Capital Turnover?
The Capital Turnover is a financial ratio that measures the efficiency at which a company can use its equity funding to generate sales.

The Capital Turnover is a financial ratio that measures the efficiency at which a company can use its equity funding to generate sales.
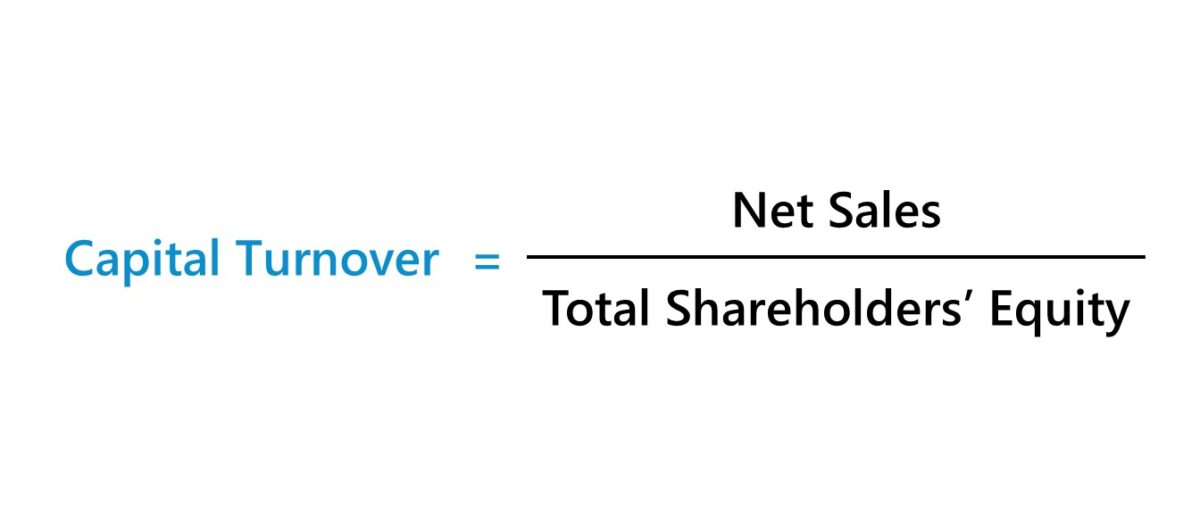
The capital turnover ratio estimates the operating efficiency of a company via its allocation of equity capital.
Expressed as a formula, capital turnover is the ratio between a company's net sales and the average shareholders' equity across a specified period.
The two components of the capital turnover ratio are: 1) net sales and 2) shareholders' equity.
Conceptually, the capital turnover therefore measures the proportion of a company’s sales generated per dollar of equity contribution.
The calculation of the capital turnover ratio is a three-step process:
The formula to calculate capital turnover is as follows.
Sales represent the “top line” of the income statement line, while inventory is found in the current assets section of the balance sheet.
Thus, there is a mismatch between the time period covered in the numerator and denominator.
The use of the average shareholders' equity is an imperfect compromise to fix the mismatch in timing, yet it is a more accurate approach than simply using the ending balance.
However, the marginal improvement in accuracy is negligible in most cases, i.e. the insights derived, in all likelihood, will be nearly identical whether the average or ending balance is used in the formula.
The capital turnover ratio is a method to understand a company's operating efficiency, including analyze the upside in terms of its growth potential.
In general, a higher capital turnover ratio corresponds to greater upside in terms of revenue growth and profitability (and vice versa for lower ratios).
However, there are some pitfalls to the ratio that must be considered.
We’ll now move to a modeling exercise, which you can access by filling out the form below.


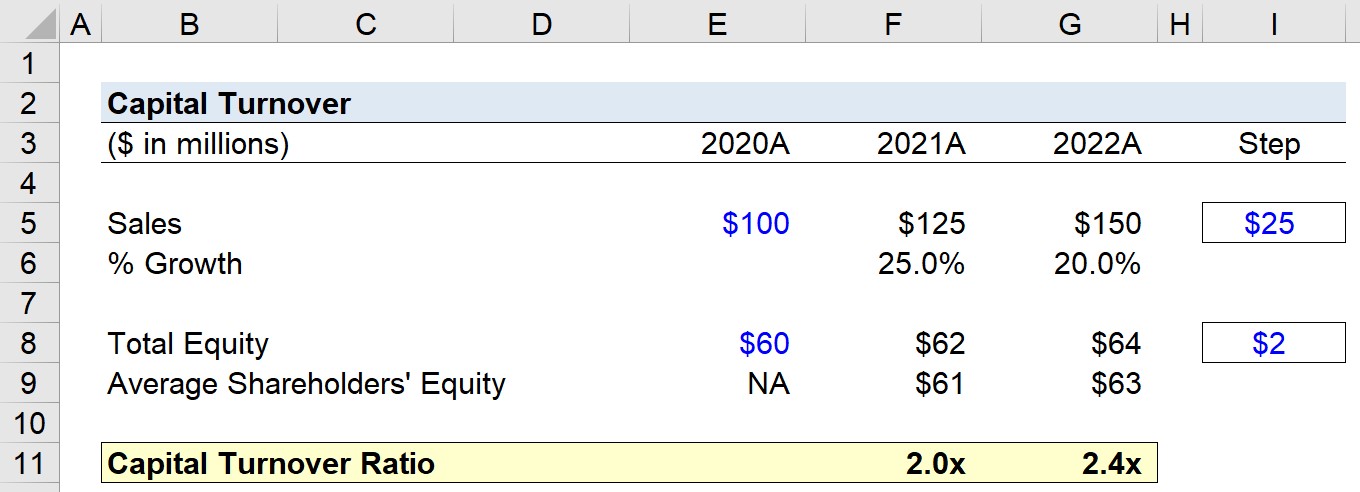
Suppose we’re tasked with calculating the capital turnover ratio for a manufacturer with the following income statement and balance sheet data.
| Selected Financial Data | 2020A | 2021A | 2022A |
|---|---|---|---|
| Net Sales | $100 million | $125 million | $150 million |
| Total Shareholders' Equity | $60 million | $62 million | $64 million |
Starting off, we’ll determine the average shareholders' equity balance for our historical periods.
The sales of a company over the course of the three-year historical period were provided as assumptions, i.e. $100 million, $125 million and $150 million.
Our next step is to divide the sales from each period by the corresponding average shareholders' equity balance to calculate the capital turnover.
Once completed, we arrive at a historical capital turnover ratio of 2.0x and 2.4x, which by itself, implies that the company is becoming more efficient over time at generating revenue per dollar of equity.

Enroll in The Premium Package: Learn Financial Statement Modeling, DCF, M&A, LBO and Comps. The same training program used at top investment banks.


No comments yet.