How to Forecast the Balance Sheet
Our Balance Sheet Forecasting Guide provides step-by-step instructions on how to forecast the key line items and how to balance a 3-statement model.

Our Balance Sheet Forecasting Guide provides step-by-step instructions on how to forecast the key line items and how to balance a 3-statement model.
Imagine that we are tasked with building a 3-statement model for Apple. Based on analyst research and management guidance, we have completed the company’s income statement projections, including revenues, operating expenses, interest expense and taxes – all the way down to the company’s net income.
Typically, the main balance sheet section of a model will either have its own dedicated worksheet or it will be part of a larger worksheet containing other financial statements and schedules. Before we dive into individual line items, here are some balance sheet best practices.
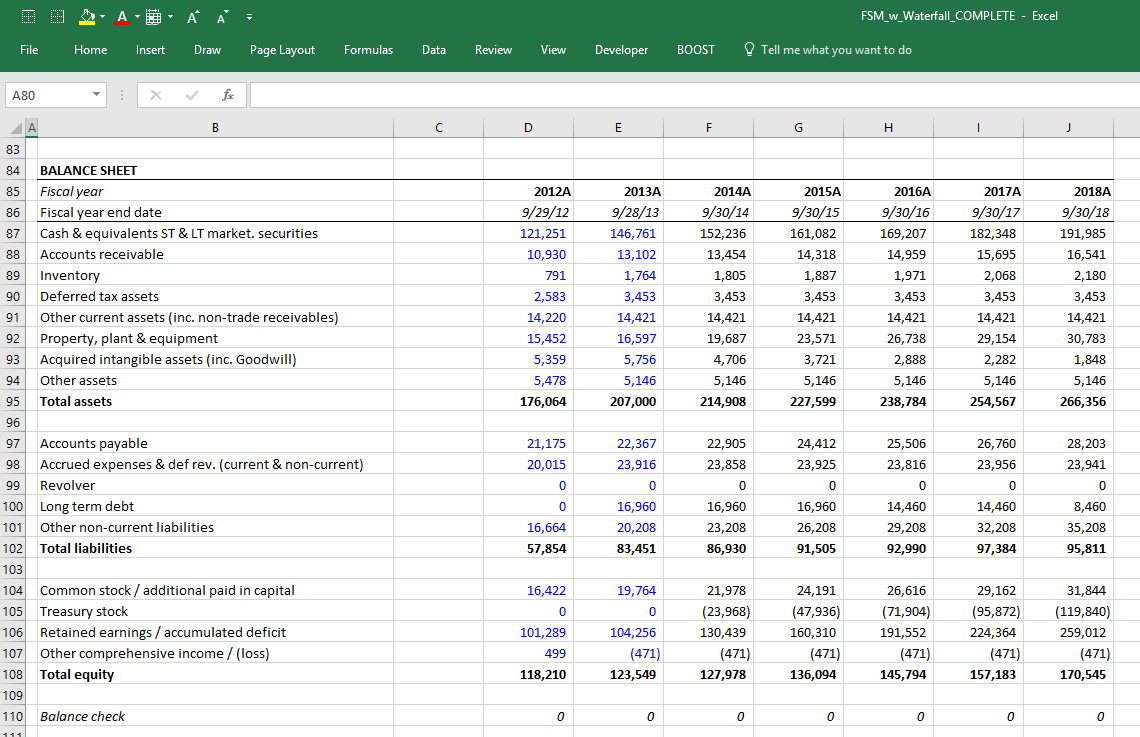
We start the balance sheet forecast by forecasting working capital items.
Broadly speaking, working capital items are driven by the company's revenue and operating forecasts.
Conceptually, working capital is a measure of a company’s short-term financial health.
The common working capital items include:
Accounts Receivable (A/R)
Inventories
Prepaid expenses
Other Current Assets
Accounts payable
Accrued Expenses
Deferred revenue
Taxes Payable
Other current liabilities
The largest component of most company’s long term assets are fixed assets (property plant and equipment), intangible assets, and increasingly, capitalized software development costs.
These line items are also driven largely by the company’s operations. In other words, the more revenue, the more capital spending and purchases of intangibles we expect to see.
Unlike working capital, PP&E and intangible assets are depreciated or amortized (with a few notable exceptions like land and goodwill). This creates a layer of complexity in the forecasting, as illustrated below:
PP&E (BOP) + capital expenditures ‑ depreciation‑ asset sales = PP&E (EOP)
| Line Item | How to Forecast |
|---|---|
| PP&E (BOP) |
|
| Capital expenditures |
|
| Depreciation |
|
| Asset sales |
|
intangible assets (BOP) + purchases - amortization = intangible assets (EOP)
| Line Item | How to Forecast |
|---|---|
| Intangible Assets (BOP) | Reference from last period’s EOP |
| Purchases |
|
| Amortization | Companies typically disclose future amortization expense for the current intangible assets in 10K footnote. Of course, if forecasting new purchases, this will have incremental impact on future amortization. In this case, apply the historical ratio of amortization/purchases. |
Goodwill is usually straight-lined in a 3-statement financial model. In other words, if goodwill on the latest balance sheet is $400m, it stays at $400m indefinitely. (For more on goodwill, read our quick primer on how goodwill is created.) That’s because to do anything else would imply either:
It is difficult to reliably forecast such things. One exception to this is when modeling private companies that amortize goodwill.
Deferred taxes are a complex topic and, as you see below, are either grown with revenue or straight-lined in the absence of a detailed analysis.
| Deferred tax assets |
|
| Deferred tax liabilities |
|
Note that DTAs and DTLs can be classified in the financial statements as both current and non-current.
You’ll often encounter catch-all line items on the balance sheet simply labeled “other.” Sometimes the company will provide disclosures in the footnotes about what’s included, but other times it won’t. If you don’t have good detail on what these line items are, straight-line them as opposed to growing with revenue. That’s because unlike current assets and liabilities, there’s a likelihood these items could be unrelated to operations such as investment assets, pension assets and liabilities, etc.
Below we see Apple’s 2016 debt balances. We observe that Apple has both short-term commercial paper and long-term debt (including a portion that's due this year):
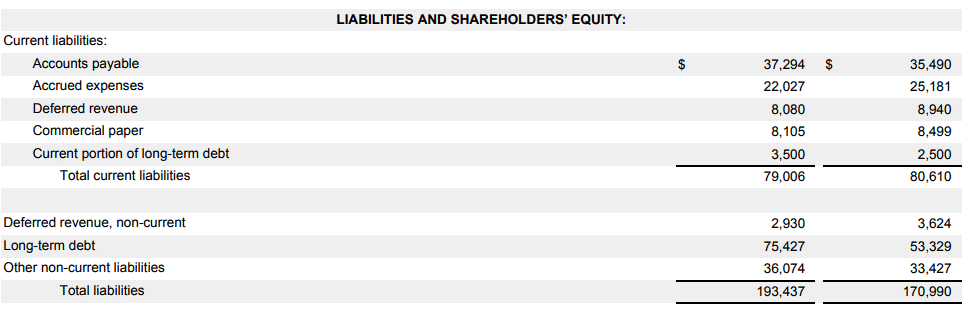
Let's focus on long term debt for now and get back to the commercial paper later. Companies will usually provide a footnote disclosure of future maturities of long-term debt. In Apple’s 2016 10K, you can see a typical debt maturity disclosure which identifies all the upcoming maturities of long-term debt (including the $3.5 billion current portion of long term debt that is due in 2017):
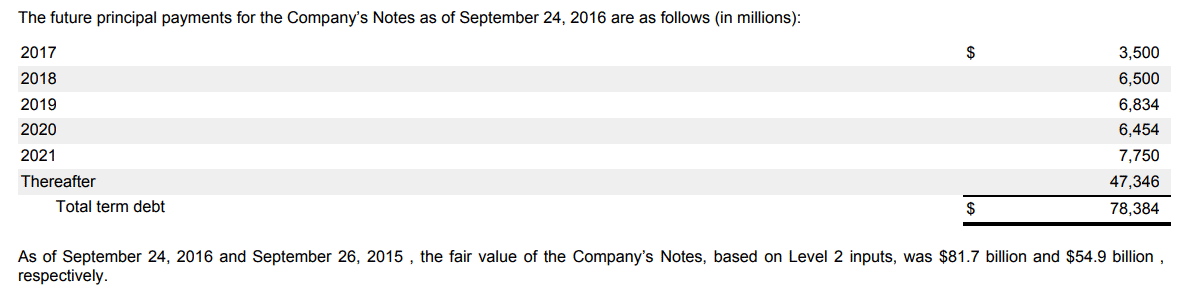
So we know these notes will be coming due – after all, Apple is contractually required to pay them down. This might lead you to believe that forecasting debt is just a matter of reducing the current debt balances by these scheduled maturities. But a financial statement model is supposed to represent what we think will actually happen. And what will most likely actually happen is that Apple will continue to borrow and offset future maturities with additional borrowings.
That’s because most companies replace (or “refinance”) maturing debt with new debt. Companies do this to maintain a stable capital structure. This means that even when the footnotes disclose that debt will be paid down, it is more appropriate to assume that debt stays at current levels or grows to reflect a fixed capital structure. Mechanically we do this by either:
We have now identified the forecasting techniques for all assets and liabilities except for cash and the revolver. We now turn to forecasting the line items in the statement of shareholders’ equity. The four big line items in that section are:
Companies issue new common stock in one of two ways:
Companies issue stock-based compensation to incentivize employees with stock in addition to cash salary. Companies primarily issue stock options and restricted stock to employees.
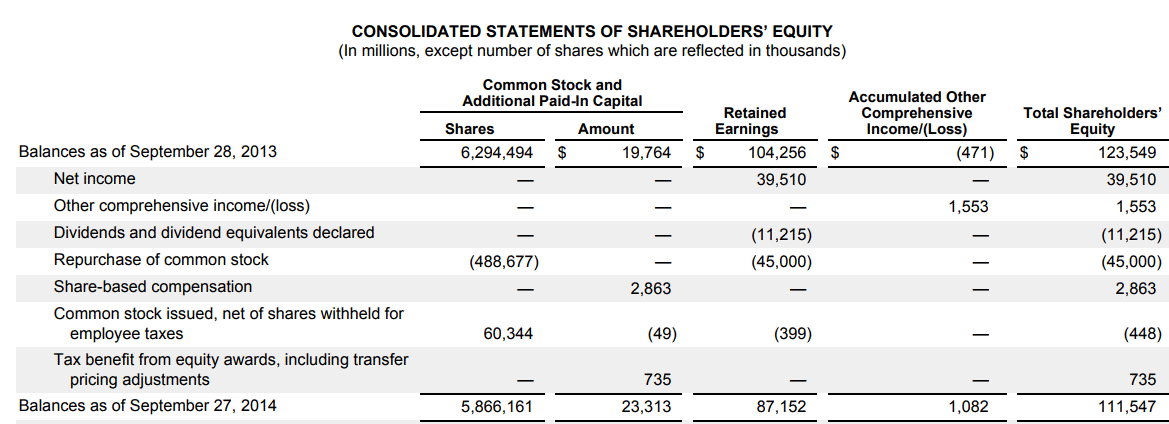
Some companies buy back their own shares when they have excess cash. For example, if a company buys back $100 million of its own shares, treasury stock (a contra account) declines (is debited) by $100 million, with a corresponding decline (credit) to cash.
Conceptually, a share buyback is essentially a dividend to remaining shareholders paid in the form of additional ownership of the company. In our example, the $100 million that the company wants to return to shareholders can actually be achieved one of two ways: via a cash dividend or equivalently via a $100m buyback. The per share increase to each shareholder (all else equal) should amount to exactly $100 million in aggregate value. One benefit with the share repurchase approach is that unlike a cash dividend, tax can usually be deferred paid by shareholders on the buyback.
From a modeling perspective, barring some management guidance or thesis on future buybacks, if a company has engaged in recurring buybacks historically (the amount of buybacks can be found on the historical cash flow statement), straight-lining the amount into the forecast period is usually reasonable.
Share issuance and buybacks that we forecast on the balance sheet directly impacts the shares forecast, which is important for forecasting earnings per share.
Retained earnings is the link between the balance sheet and the income statement. In a 3-statement model, the net income will be referenced from the income statement. Meanwhile, barring a specific thesis on dividends, dividends will be forecast as a percentage of net income based on historical trends (keep the historical dividend payout ratio constant).
retained earnings (BOP) + net income - dividends (common and preferred) = retained earnings (EOP)
| Line Item | How to Forecast |
|---|---|
| Net income | From income statement forecast |
| Dividends (Common and Preferred) | Forecast as a % of net income based on historical trends. |
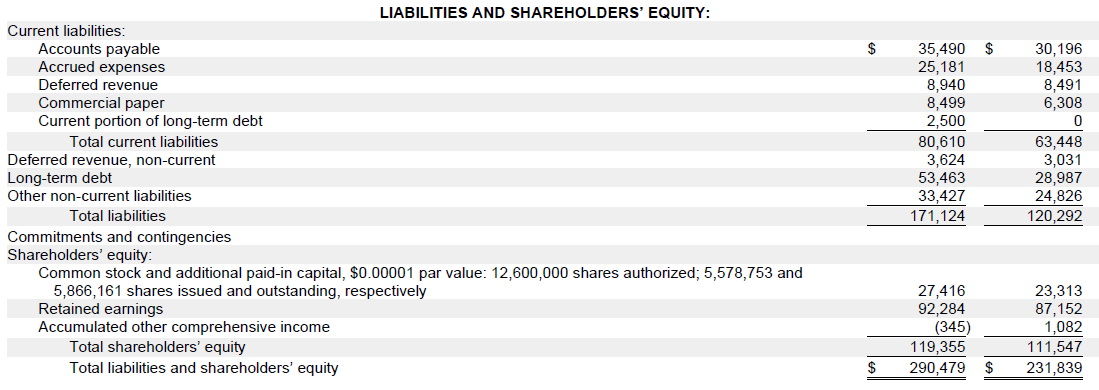
Under GAAP, there are many financial activities whose gains and losses don't impact net income: Gains and losses on foreign currency translations, derivatives, etc. Instead, they are classified as "other comprehensive income" (OCI) and are accumulated in a balance sheet line item distinct from retained earnings. You can see this in Apple's balance sheet (observe that the line "accumulated other comprehensive income" declined by $1,427m during the year from an accumulated balance of $1,082 to a negative $354m):
And in a separate schedule in the 10K you can see a full breakout of $1,427m in year-over-year changes in OCI (much like the income statement is a breakout of the year over year changes in retained earnings):
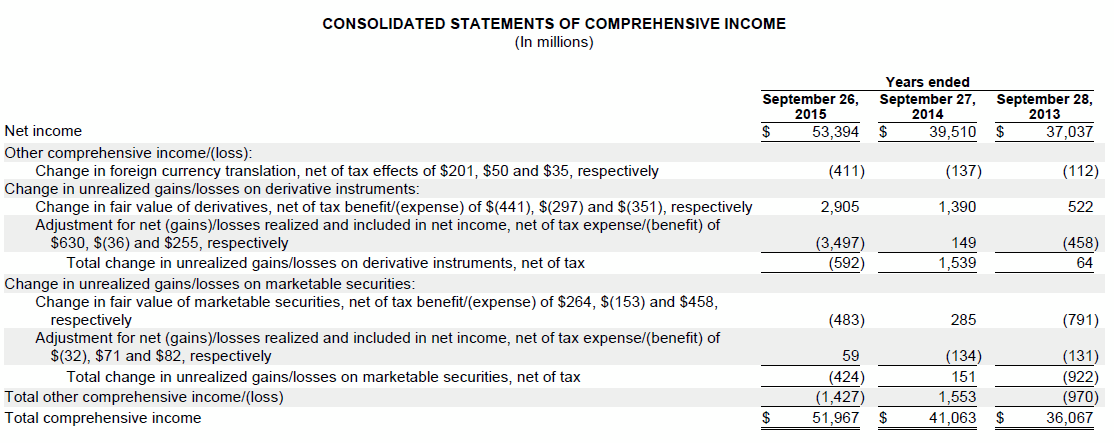
Forecasting OCI is fairly straightforward. Because the gains and losses that flow into this line item are difficult to predict, the safest bet is to assume no change year-over-year going forward (in other words, straight-line the last historical OCI balance on the balance sheet):
OCI (BOP) +/- OCI generated during the year = OCI (EOP)
| Line item (see formula above) | How to forecast |
|---|---|
| OCI generated during the year | Assume no OCI gains and losses in the forecast (i.e. straight-line historical OCI balance). |
Last but not least, we turn to the forecasting of short term debt and cash. Forecasting short term debt (in Apple’s case commercial paper) requires an entirely different approach than any of the line items we've looked at so far. It is a key forecast in an integrated 3-statement financial model, and we can only quantify the amount of short term funding required after we forecast the cash flow statement. That’s because cash and short term debt (the revolver) serve as a plug in most 3-statement financial models – if after everything else is accounted for, the model is forecasting a cash deficit, the revolver will grow to fund the deficit. Conversely, if the model is showing a cash surplus, the cash balance will simply grow.
Finally, any balance sheet forecast isn't complete if the balance sheet does not balance. While a company's reported balance sheet will always show assets equaling liabilities plus equity, when forecasting the balance sheet, any number of mistakes can lead to the model getting out of balance. In fact, the strength of a 3-statement model is that the three statements are interlinked. However, these inter-linkages also increase the potential for error. Some of the most common reasons the balance sheet doesn't balance include:
While this can be a time consuming process, the good news is that if you follow the above steps correctly, you will locate the error and your model will balance.

Enroll in The Premium Package: Learn Financial Statement Modeling, DCF, M&A, LBO and Comps. The same training program used at top investment banks.


Hey there! Thanks for creating this web page. Could you please explain more about what you mean regarding “Using an IF statement, model should enable users to override with days sales outstanding (DSO) projection, where days sales outstanding (DSO) = (AR / Credit Sales) x days in period”? What I mean is, should the model include a switch that is based upon an IF statement? That a user should be abel to use to override? It’s just not 100% clear – thanks for your time.
Nevin:
Yes, you’ve got it correct! It just adds some functionality to a model.
Best,
Jeff
Thanks, this is really helpful
Thanks for creating this. Very helpful
Hey, thank you so much for creating this! It helps me a lot on my assignment. Can I ask what do you mean by straight-line the other CA or CL? Does this mean that the value of this category will be 0 at the end of the period?
Hi, Vivian,
Glad to hear this is a help, and thanks for the feedback! Straight-lining other CA or other CL means keeping the prior year amount constant, so the net impact on cash will be zero, but the balance sheet amount will remain the same (it will not go down to zero).
BB
When checking to make certain all items on the cash flow statement are linked to the correct balance sheet items, to what item on the balance sheet should stock based compensation be linked? Common stock?
Hi, Jay,
That is correct. The SBC should cause in increase in Common Stock/APIC, just as it causes a decrease in Retained Earnings (since it is an expense).
BB
Looking for a little help. I built a 3 statement model that works quite nicely. My balance sheet balances, etc. When I add stock based compensation to income statement, BS continues to balance. However, if I add back the SBC to NI on the Cash Flow Statement & increase equity by same amount, my balance sheet doesn’t balance. Any thoughts as to why that is? What am I missing? Thanks.
JD
Hi, Jay,
The reason your B/S balances when you add something to the I/S is that both retained earnings and cash (via the CFS) pick up net income. You need to make sure this is the case, make sure that when you add SBC to the I/S, it is making it into the totals. Then if you add it back on the CFS (again make sure it is picked up in the totals), then you have to add it back somewhere else on the B/S for it to balance, and this should be Common Stock/APIC.
BB
I didn’t understand two things from treasury stock:
1) the treasury stock declines when the company engages in buyback.
I understand that the double-entry accounting principle mentions if there is a decline in cash there should be a corresponding decrease in stock. but if there is a buyback doesn’t the common stock shud decrease and treasury stock increase with a decrease in cash?
2) when there is a buyback, the shareholder’s equity in the company increases (% wise) so what does this have to do with taxes? The article says: “…tax can usually be deferred paid by shareholders on the buyback.” what does it mean? Are shareholders getting something during buyback other than equity which can be deferred if yes, how is it deferred?
Hi, Prasad,
Great questions: 1) Treasury stock goes up, but this is a contra equity account which reduces the $ value of equity invested in the company. So treasury stock increases as a negative equity account and offsets common stock. 2) This seems a bit confusing to me too, but what I think it means is that the remaining shareholders who are not bought out of their shares now have an increased value in the company equivalent to what they would have received if they had been paid a dividend, but unlike in the case of a dividend, by merely holding onto the more highly value shares, they do not yet pay tax as they would if they had received a dividend.
BB
Hi this is super helpful! Could you also show how we should make assumptions for the right of use assets? Thanks!
Hi, Emily,
In theory, lease ROU assets should grow a lot like PP&E, but unfortunately, companies don’t purchase them like they do capex each year. So it might make sense to grow leases with revenue to account for the additions to new leases each year.
BB