What is LTM?
LTM stands for “Last Twelve Months” and measures the performance of a metric, most often revenue, as of the trailing twelve-month period.

LTM stands for “Last Twelve Months” and measures the performance of a metric, most often revenue, as of the trailing twelve-month period.
In finance, last twelve-month (LTM) metrics—often used interchangeably with “Trailing Twelve Months” (TTM)"—are used to measure a company's most recent financial state.
LTM financial metrics are frequently calculated after a company reports earnings or in anticipation of a certain corporate event, such as an acquisition.
Using LTM financial data, an equity analyst, like an investor at a hedge fund, can analyze the current operating performance of a company in the prior twelve months.
The LTM income statement of a company is ordinarily compiled in full, but the two critical financial metrics in M&A tend to be:
In particular, many transaction offer prices are based on a purchase multiple of EBITDA – hence, the widespread usage of the LTM EBITDA metric in M&A.
But to ensure the LTM EBITDA or LTM revenue of a company reflects past performance and not an anomaly regarding its financial state, the EBITDA margin (%) can be compared across historical periods and the compound annual growth rate (CAGR) can annualize the growth rate across multiple periods.
The following steps are used to calculate a company's LTM revenue:
The process is virtually identical to calculating LTM EBITDA, with the only distinction being switching out "Revenue" with "EBITDA".
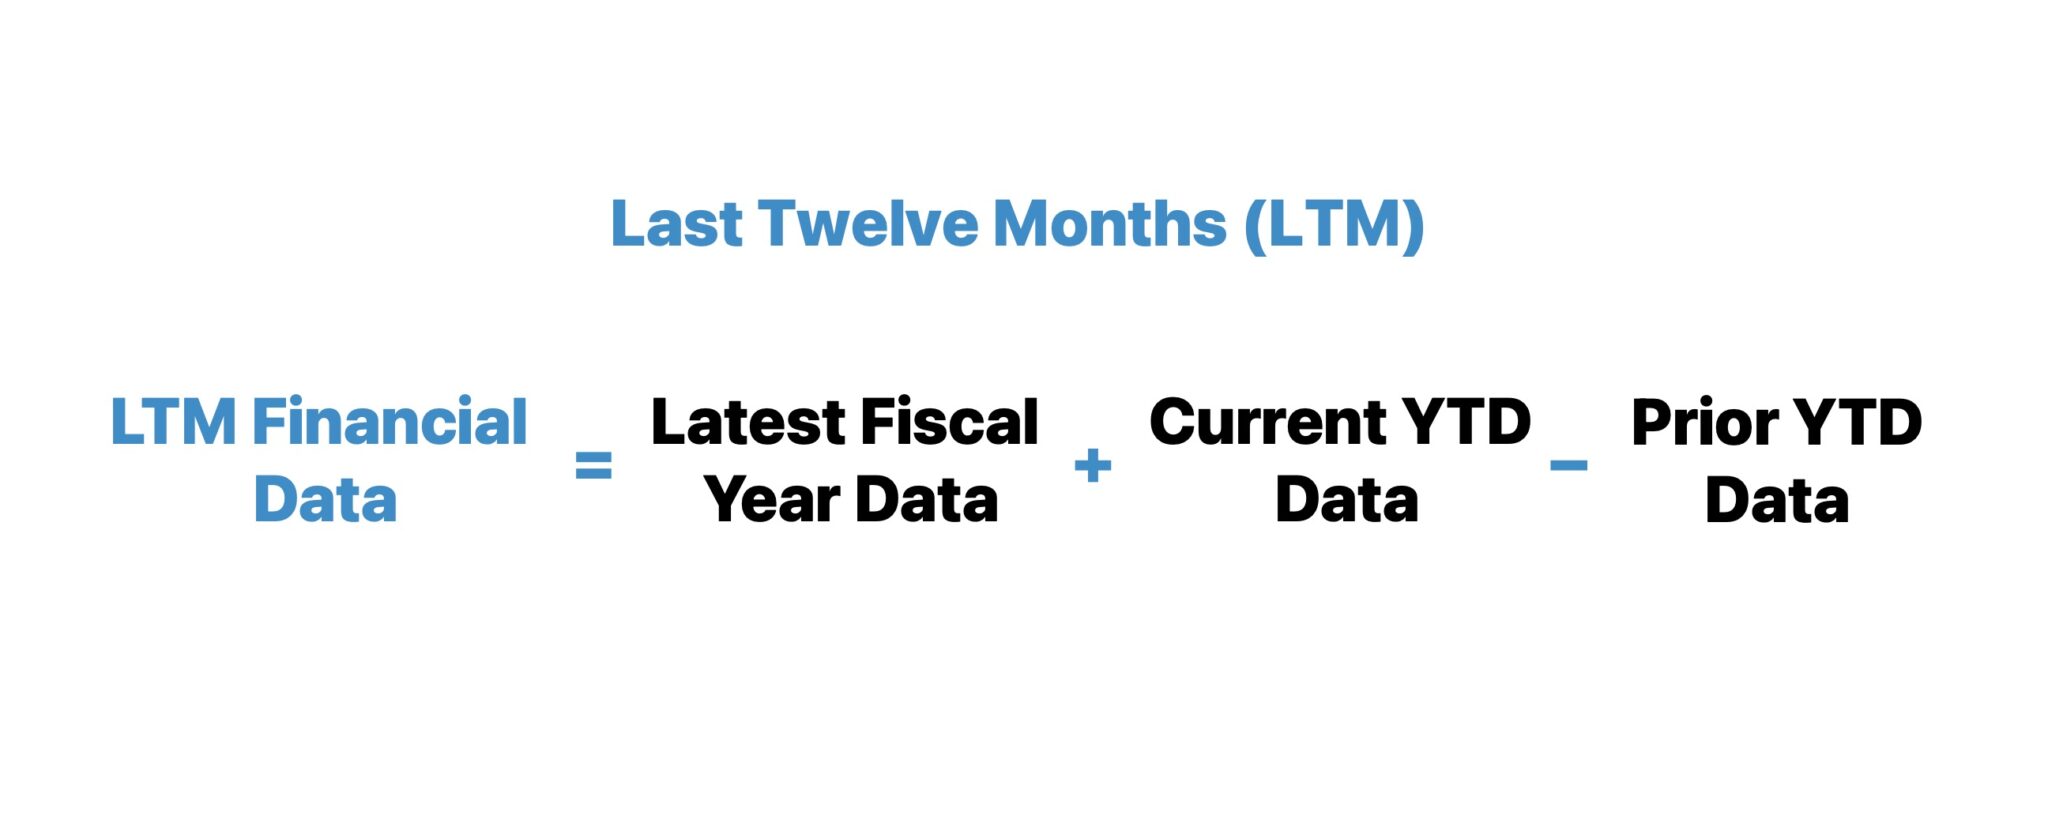
The formula for calculating a company's last twelve months financials (LTM) is as follows.
The process of adding the period beyond the fiscal year ending date (and subtracting the matching period) is called the “stub period” adjustment.
If the company is publicly traded, the latest annual filing data can be found in its 10-K filings, whereas the most recent YTD and corresponding YTD financial metrics to deduct can be found in the 10-Q filings.
The formula used to calculate LTM revenue is as follows.
Note that the stub periods in the calculation—the two adjustments to the revenue reported in the most recent fiscal year—must "match" in terms of the timing covered.
Suppose an equity analyst is tasked with updating a financial model to reflect the LTM income statement data of Apple (AAPL).
Apple recently reported its Q2-24 earnings on 03/30/2024, thereby the equity analyst must add the YTD financial data to the FY-23 financial data and then deduct the corresponding YTD financial data from the prior period.
The reported revenue data of Apple—obtained from the financial data platform Daloopa—is as follows:
| Net Sales ($ in millions) | 2022-Q4 | 2023-Q1 | 2023-Q2 | 2023-Q3 | 2023-FY | 2024-Q1 | 2024-Q2 |
|---|---|---|---|---|---|---|---|
| Product | $96,388 | $73,929 | $60,584 | $67,184 | $298,085 | $96,458 | $66,886 |
| Services | 20,766 | 20,907 | 21,213 | 22,314 | 85,200 | 23,117 | 23,867 |
| Net Sales | $117,154 | $94,836 | $81,797 | $89,498 | $383,285 | $119,575 | $90,753 |
The Q4 revenue data is seldom broken out separately on the income statement—and thus, the more practical approach to compute LTM revenue is to add the YTD revenue to the latest fiscal year revenue, and then subtract the prior YTD revenue.
To complicate matters further, Apple's fiscal year ends around 09/30 rather than the standard 12/31.
Given the quarterly and annual revenue data pulled from Apple's income statement, we’ll insert the reported revenue figures into the LTM formula.
Upon inserting Apple's reported net sales figures into the formula, we arrive at $381,623 in LTM revenue as of Q2-2024.
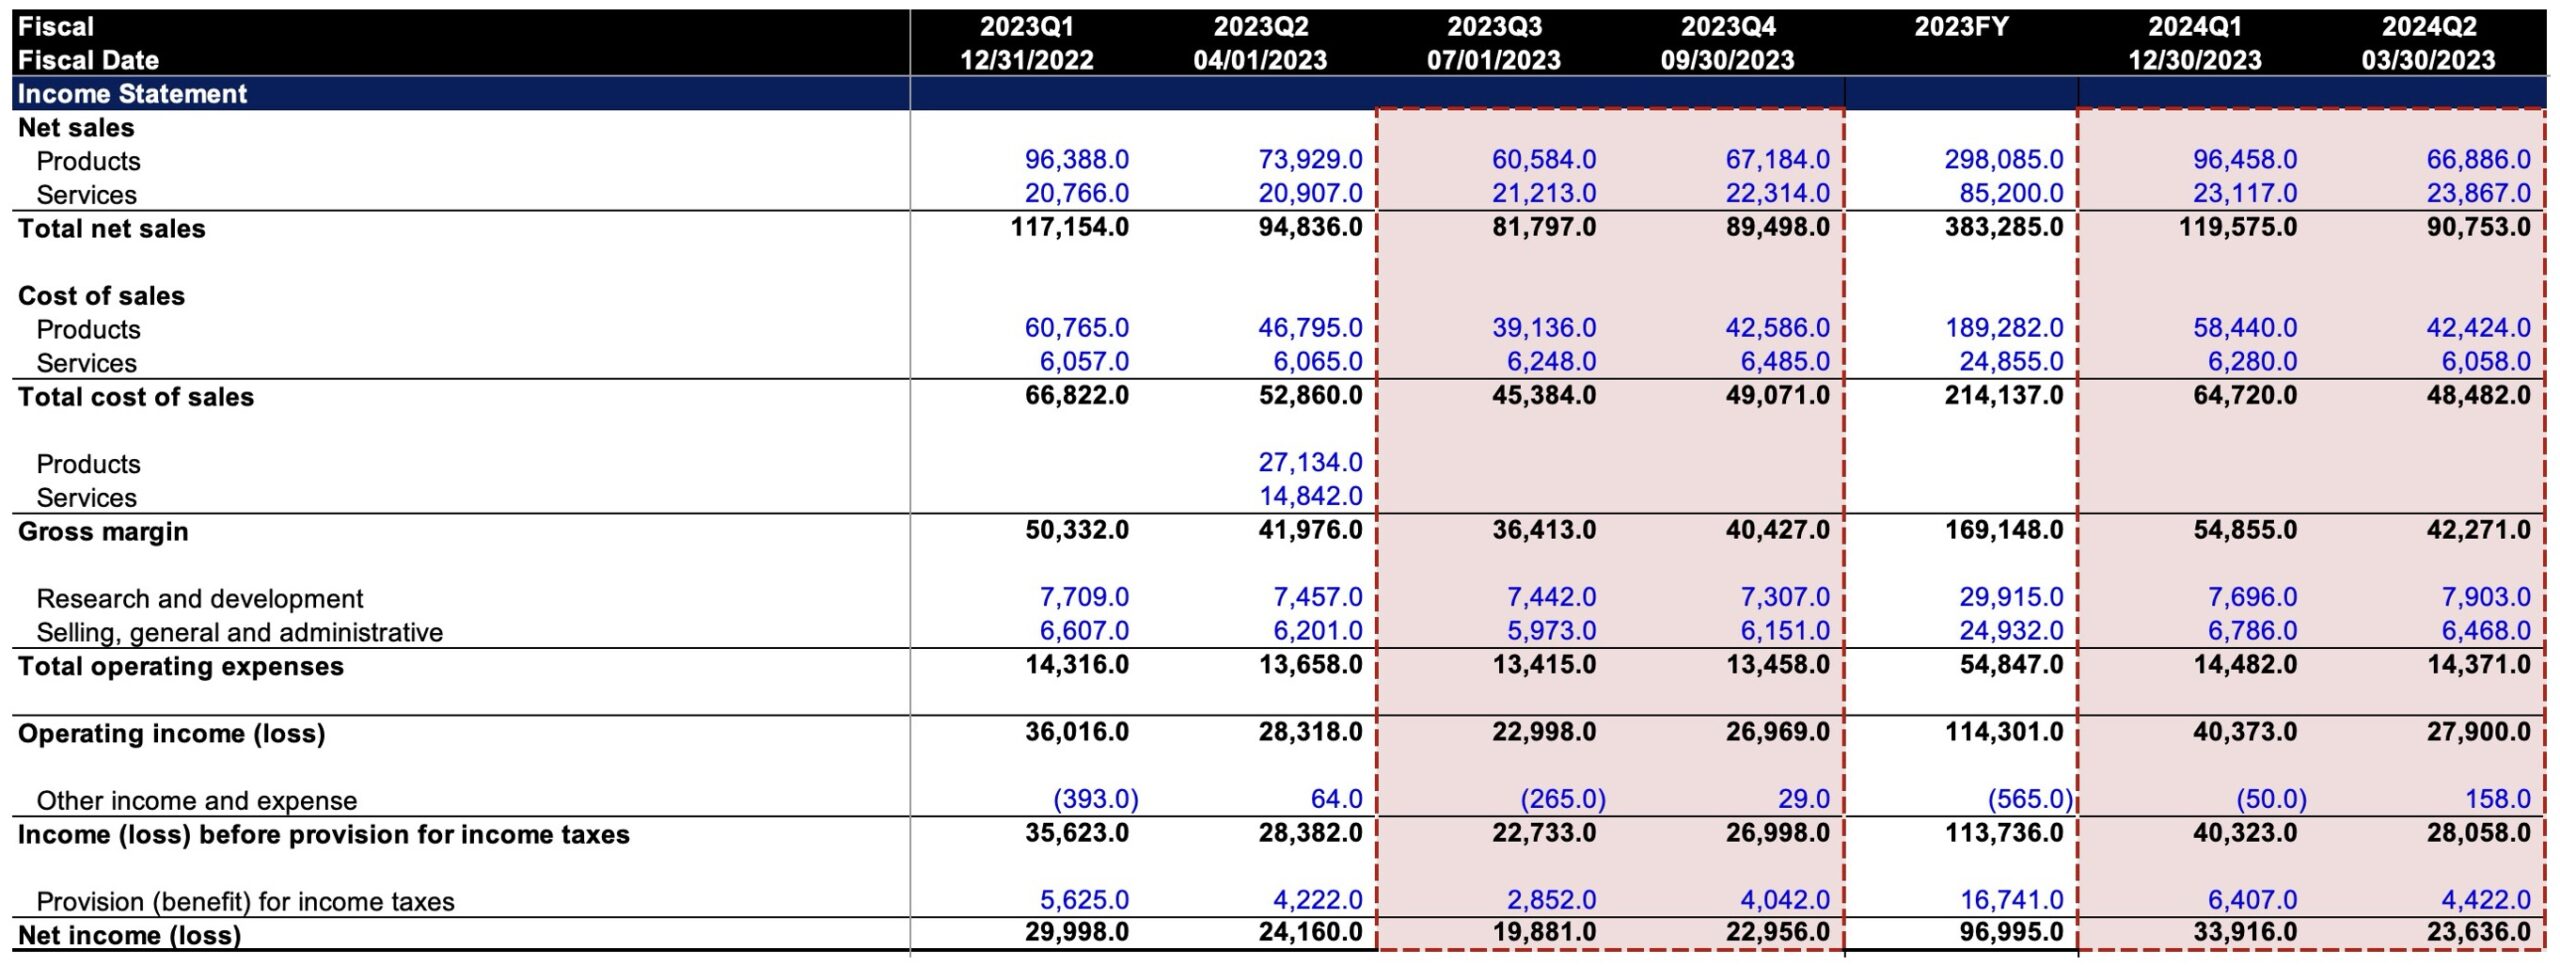
AAPL LTM Income Statement Financial Data (Source: Daloopa)
In short, LTM revenue is a backward-looking measure of a company's revenue performance, while the NTM revenue is a pro-forma, forward-looking measure of revenue performance.

Enroll in The Premium Package: Learn Financial Statement Modeling, DCF, M&A, LBO and Comps. The same training program used at top investment banks.


No comments yet.