The Trailing Twelve Months (TTM) is a method to measure a company’s operating performance across the past four quarters, or last twelve months.
TTM financial data is compiled in a financial model to analyze the operating performance of a particular company to ensure the most recent reported data is reflected in the output.
How to Calculate TTM Revenue
TTM stands for “Trailing Twelve Months” and is a backward-looking metric that portrays the financial performance of a company as of its most recent four reporting quarters.
TTM (“Trailing Twelve Months”)—often used interchangeably with the term LTM (“Last Twelve Months”)—is used by practitioners to analyze a company's recent financial performance.
Conceptually, the trailing twelve months (TTM) is a measure of a company’s financial performance in the most recent 12-month period.
In effect, a metric presented on a trailing twelve-month basis, such as TTM revenue, is intended to reflect the most up-to-date, current state of a company’s growth trajectory and profitability.
In practice, the two most common metrics presented on a trailing twelve-month basis are TTM revenue and TTM EBITDA.
TTM Revenue ➝ TTM revenue is determined by summing the reported revenue from the last four consecutive quarters, offering a dynamic and rolling measure of a company's financial performance.
TTM EBITDA ➝ Likewise, TTM EBITDA is equal to the sum of a company's EBITDA from the past four quarters on a rolling basis to measure operating performance.
The continuous update attributable to TTM financial data facilitates the identification of patterns in a company’s operating performance, while "smoothing out" seasonal fluctuations.
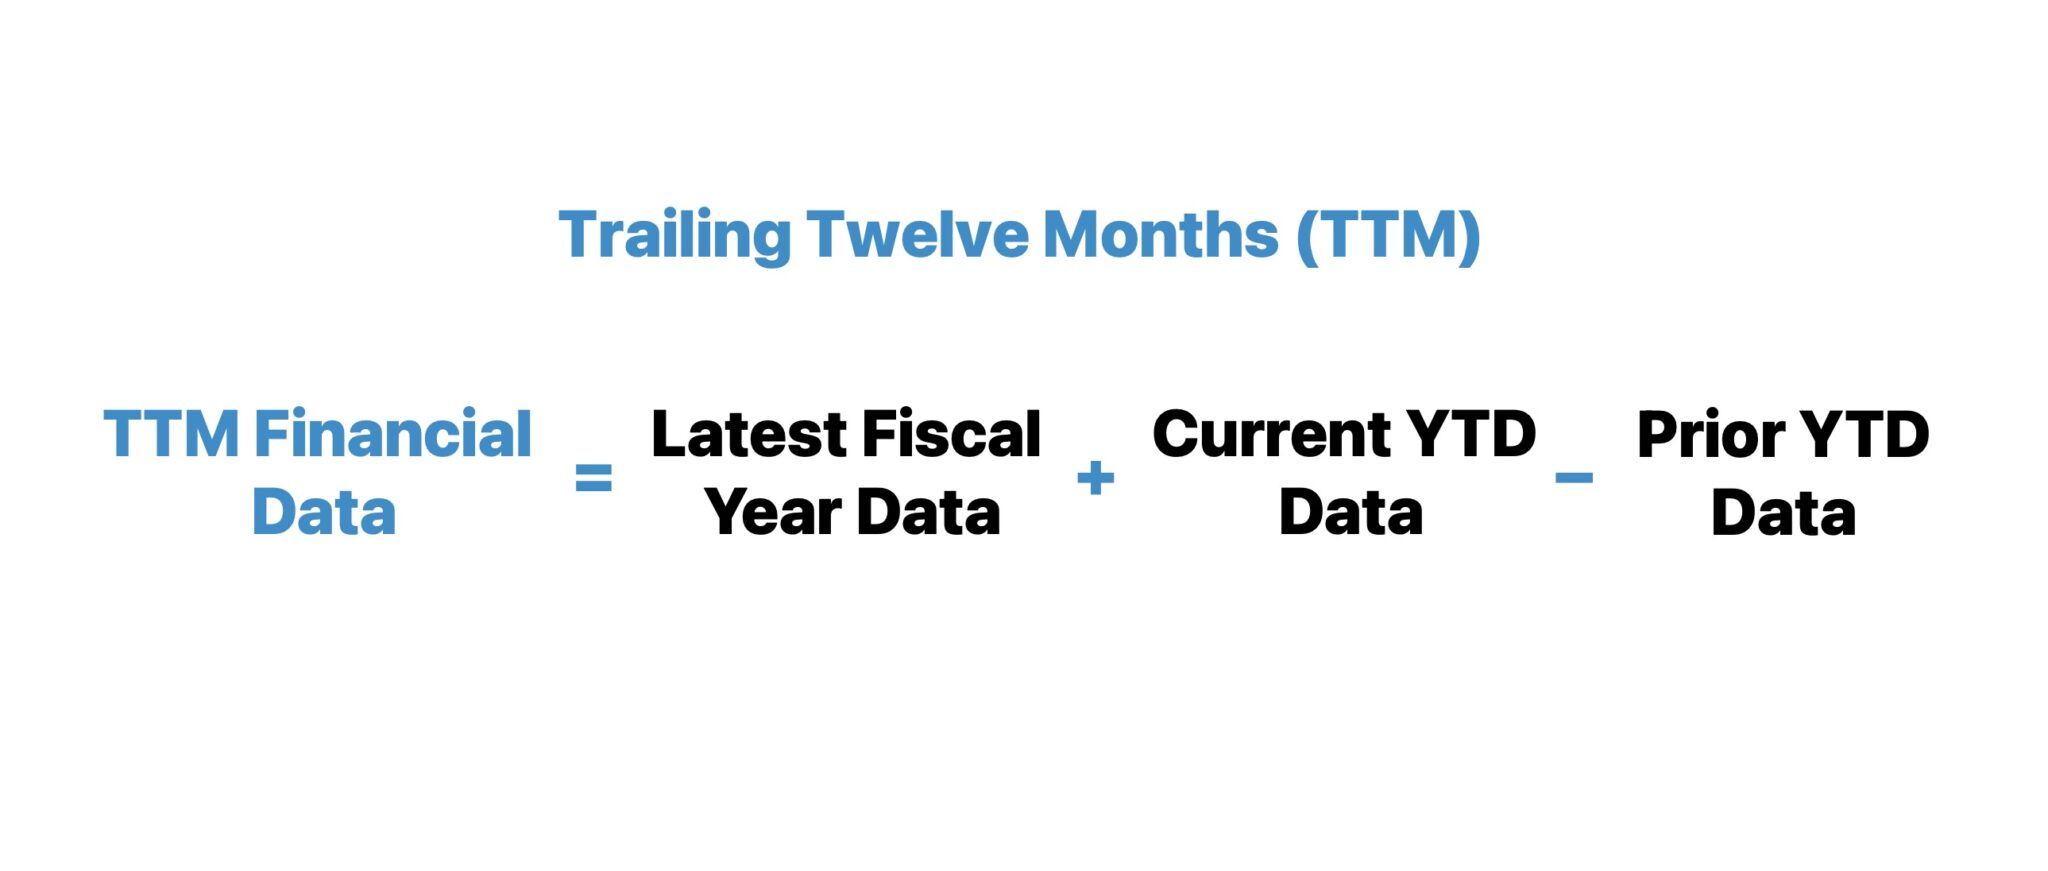
The process of adjusting a financial metric like revenue, operating income (EBIT), or EBITDA, comprises adding the most recent period past the latest reported fiscal year and subsequently deducting the matching period (i.e. the “stub period” adjustment).
The required financial filings to perform such a calculation are the company's latest 10-K, most recent quarterly filing(s), and the corresponding filings from the year prior.
To calculate a company’s TTM revenue, the following three steps can be followed.
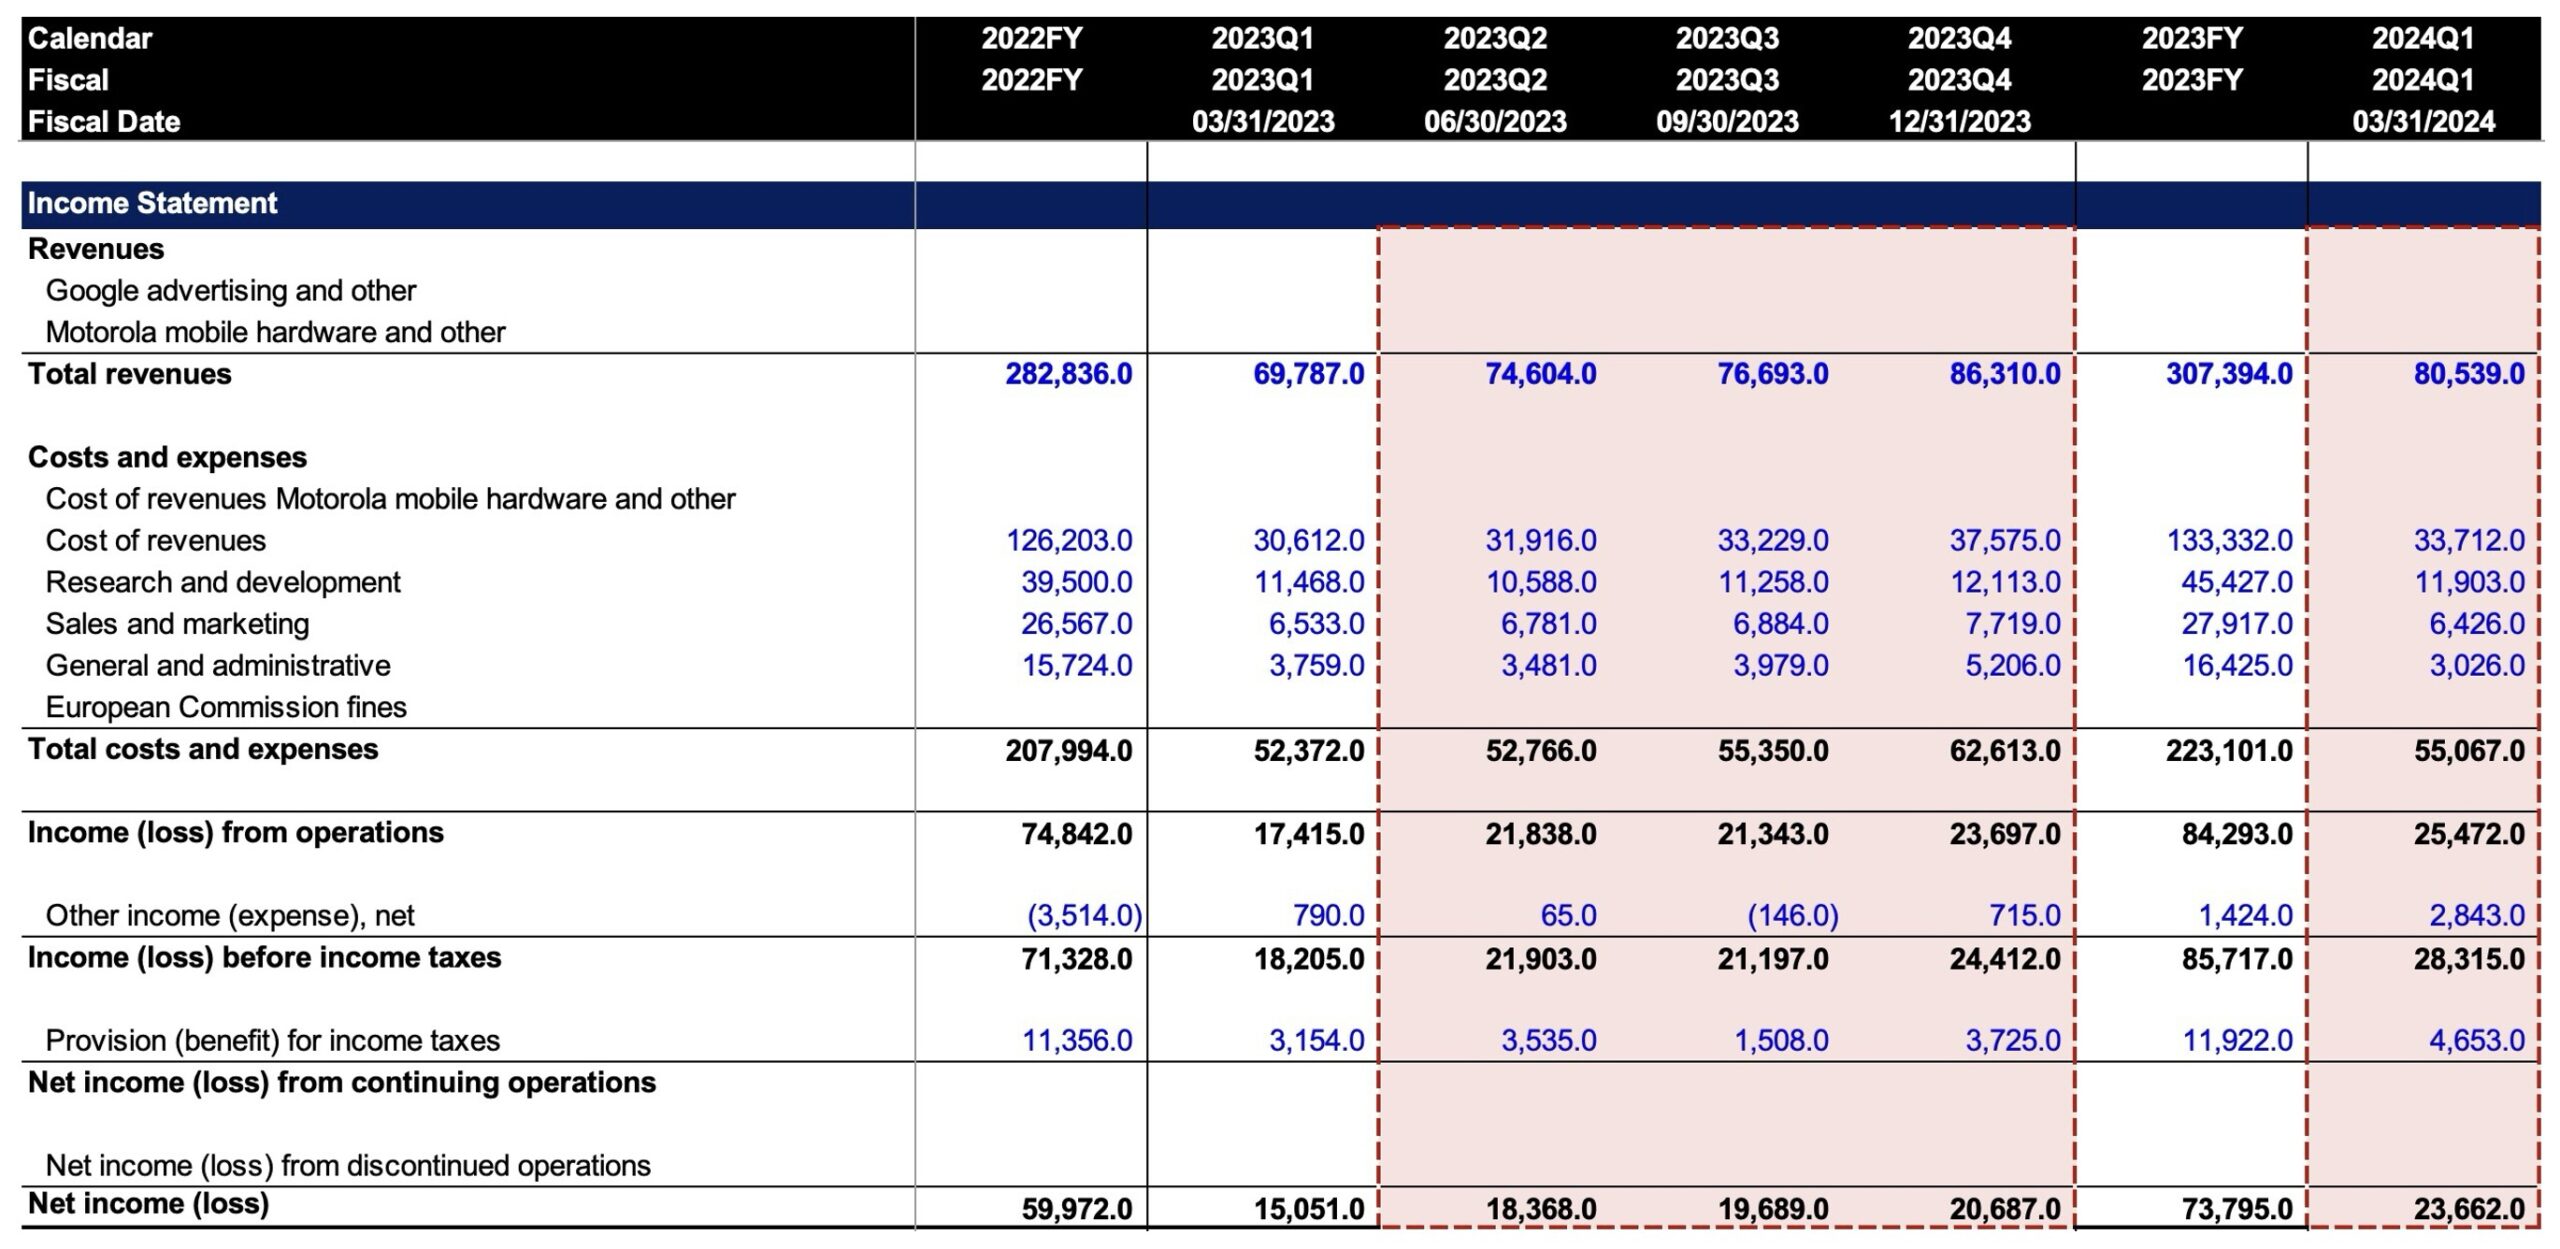
Alphabet recently reported its Q1 earnings (03/31/2024), thereby the equity analyst must add the recent Q1-24 financial data to the FY-23 financial data and then deduct the financial data from the period (Q1-23).
The reported revenue data of Alphabet—derived from financial data platform Daloopa—is as follows:
Selected Financial Data
Q1–2023
Q2–2023
Q3–2023
Q4–2023
FY-2023
Q1–2024
($ in millions)
03/31/2023
06/30/2023
09/30/2023
12/31/2023
12/31/2023
03/31/2024
Revenue
$69,787
$74,604
$76,693
$86,310
$307,394
$80,539
If the Q-4 revenue data is explicitly stated, the calculation process is straightforward.
The TTM revenue of Alphabet (GOOGL), as of the end of Q1-2024, is $318,146 million, like before.
TTM Revenue = $307,394 million + $80,539 million − $69,787 million = $318,146 million
TTM Income Statement Financial Data Example (Source: Daloopa)
TTM vs. NTM Revenue: What is the Difference?
TTM ("Trailing Twelve Months") and NTM ("Next Twelve Months") are two methods to analyze and present the revenue performance of a company, with each metric providing practical insights that pertain to growth.
In short, TTM revenue reflects historical data (”Actual”), while NTM revenue is derived from a pro-forma forecast (”Projected”).
The primary difference between TTM and NTM revenue is that TTM revenue is based upon historical performance, offering a reliable, factual perspective into the financial state of a company.
In contrast, NTM revenue is oriented around pro-forma financial performance obtained from a forecast model, providing insights into expected growth and performance.
Metric
Description
Trailing Twelve Months (TTM) Revenue
TTM revenue represents the total revenue generated over the most recent twelve-month period ending at a specified date.
Continuously updated to reflect the latest financial data, TTM revenue serves as a dynamic measure of historical performance.
On the job, equity analysts calculate TTM revenue by summing the revenue from the last four consecutive quarters.
The TTM financial data "smoothens" seasonal variations and provides an up-to-date view of the company’s growth profile and historical trends.
Next Twelve Months (NTM) Revenue
NTM revenue represents the projected revenue for the upcoming twelve-month period.
Based on consensus estimates, company guidance, and market conditions, NTM revenue serves as a forward-looking metric.
Calculating NTM revenue requires forecasting future revenue based on current data, historical trends, and other relevant factors, which are driven by discretionary assumptions.
NTM revenue is analyzed to understand a company’s pro-forma growth potential and future performance.
Equity analysts and investors alike rely on NTM revenue data to make informed decisions about the company’s prospects, compare future growth expectations, and evaluate the company’s ability to meet its revenue targets.
Continue Reading Below
The Wharton Online & Wall Street Prep Applied Value Investing Certificate Program
Learn how institutional investors identify high-potential undervalued stocks. Enrollment is open for the upcoming cohort.
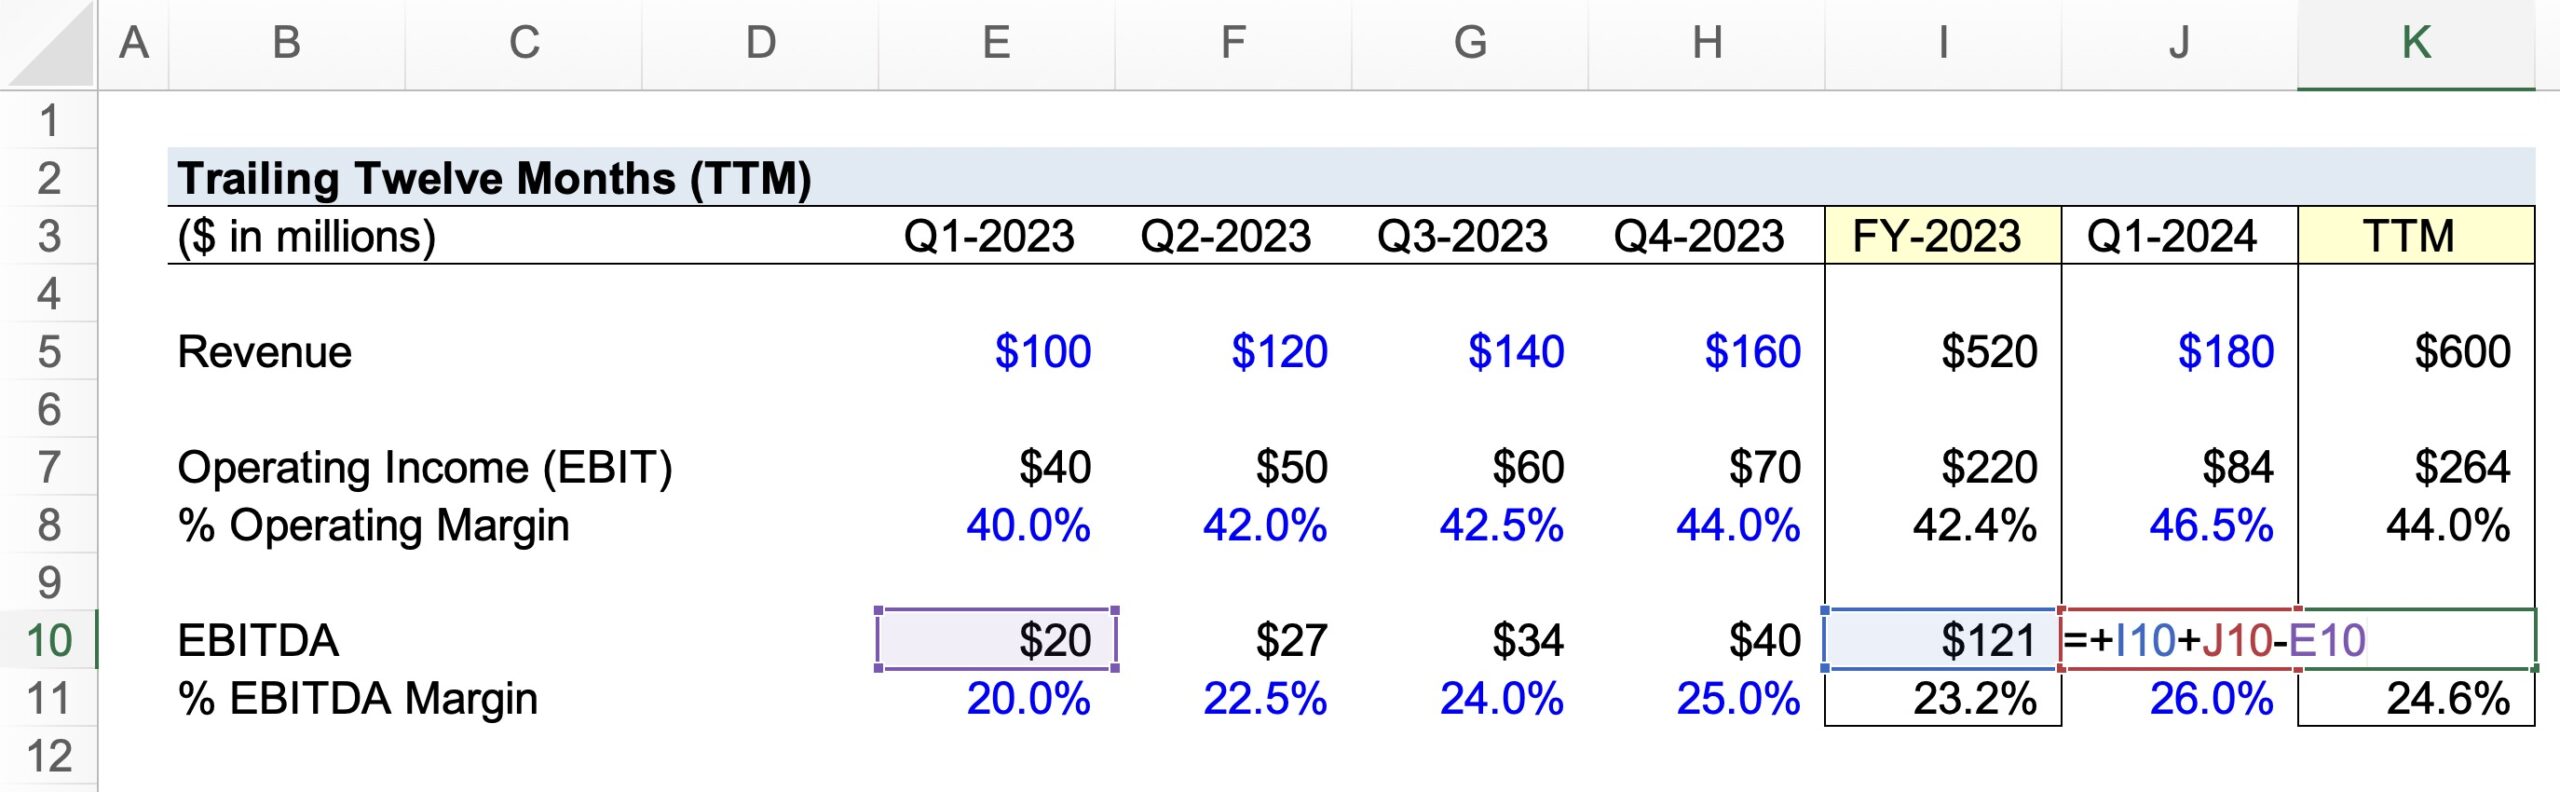
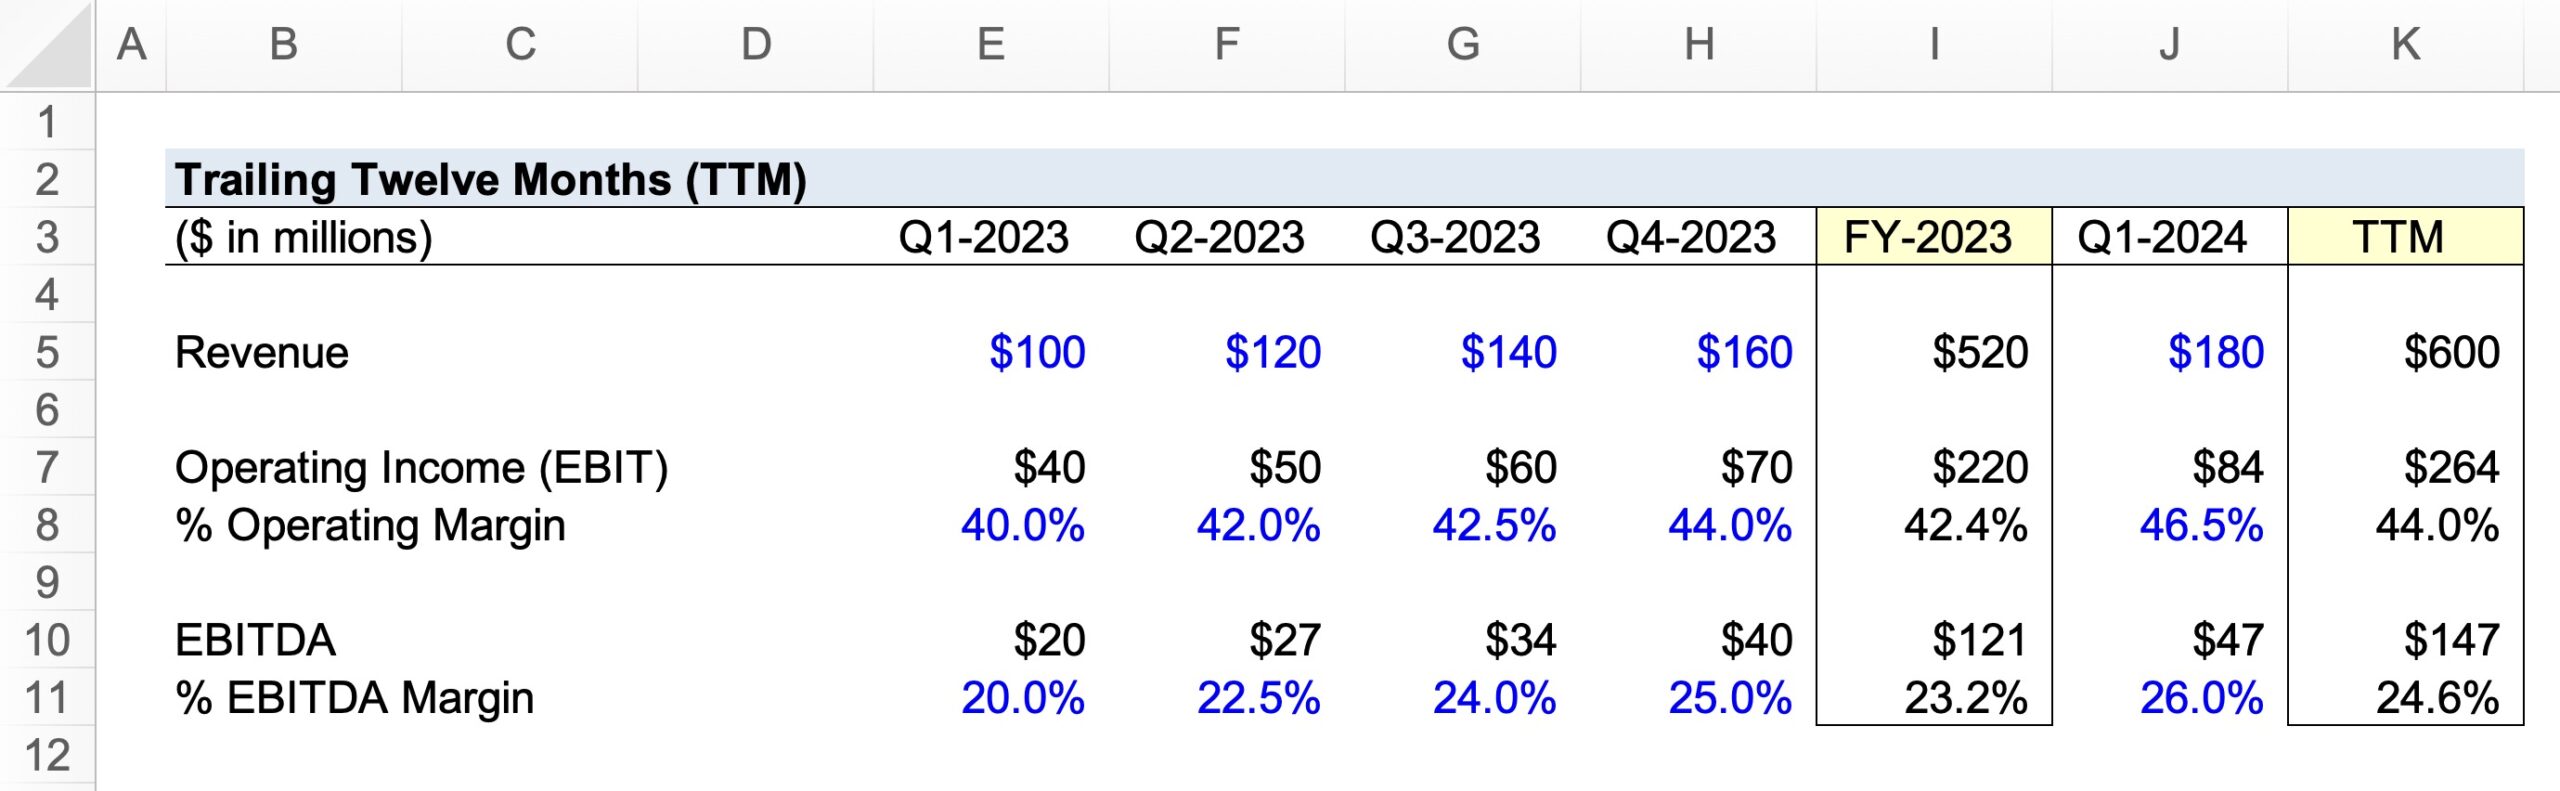
Upon inserting our assumptions into each corresponding formula, we arrive at $600 million, $264 million, and $ 148 million for TTM revenue, TTM EBIT, and TTM EBITDA, respectively.
TTM Revenue = $520 million + $180 million − $100 million = $600 million
TTM EBIT = $220 million + $84 million − $40 million = $264 million
TTM EBITDA = $121 million + $47 million − $20 million = $148 million
In Excel, the TTM EBITDA formula is equal to FY-23 EBITDA (Cell I10) plus Q1-24 EBITDA (Cell J10), subtracted by Q1-23 EBITDA (Cell E10).
Technically, we could compute TTM EBITDA as the sum of each quarter, but for illustrative purposes, we'll use the more practical formula mentioned earlier.
The updated income statement—with the TTM financial data in the far right column—is as follows:
TTM Financial Data
Q1–2023
Q2–2023
Q3–2023
Q4–2023
FY-2023
Q1–2024
TTM
Revenue
$100 million
$120 million
$140 million
$160 million
$520 million
$180 million
$600 million
Operating Income (EBIT)
$40 million
$50 million
$60 million
$70 million
$220 million
$84 million
$264 million
% Operating Margin
40.0%
42.0%
42.5%
44.0%
42.4%
46.5%
44.0%
EBITDA
$20 million
$27 million
$34 million
$40 million
$121 million
$47 million
$147 million
% EBITDA Margin
20.0%
22.5%
24.0%
25.0%
23.2%
26.0%
24.6%
The differential between the FY-2023 operating performance and TTM operating performance is substantial. Hence, financial models must be constantly updated, especially since the 3-statement model is the basis for practically all valuation models, including a discounted cash flow (DCF) analysis, trading comps, transaction comps, and leveraged buyout (LBO) models.
In closing, the TTM financial data reflects the current operating performance of our hypothetical company more accurately.
Considering the fact that the allocation of capital and investments are selected based on analyzing a company's reported financial data, ensuring a financial model is continuously updated with the most up-to-date and reliable, publicly available data is a necessity for sound decision-making.





No comments yet.