What is Year to Date?
YTD stands for “year to date” and represents the time period from the beginning of the fiscal year to the present date.

YTD stands for “year to date” and represents the time period from the beginning of the fiscal year to the present date.
In finance, the term YTD stands for "Year to Date" and refers to the period starting from the first date of the current year to the current period.
However, the YTD abbreviation could also mean the period between the beginning date of the fiscal year to the current date, or the most recent reporting period, such as the latest quarterly report.
In that case, the year-to-date (YTD) is most likely alluding to the financial statements of the company, rather than a percentage return.
By measuring YTD performance, a company can assess its performance to date and determine how its current trajectory compares to its prior periods and internal forecasts, as well as for benchmarking purposes with comparable companies in either the same or an adjacent industry.
The trend of the company’s sales performance, or alternatively the returns on a portfolio, can be useful for understanding the current state of its performance and if adjustments are necessary in order to reach the goals set by the management team.
Suppose the management team of Microsoft (MSFT) were to state that their share price is currently up over 40% YTD.
Therefore, as of the current date in August 2023, MSFT's stock price has increased over 40% since January 1, 2023.
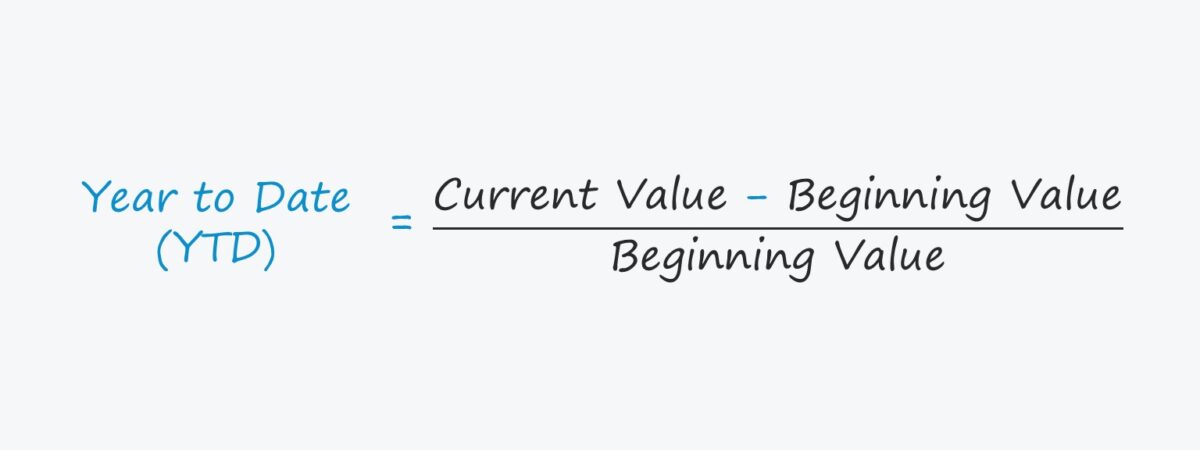
To calculate the YTD return, subtract the starting period value from the current period value, and divide the resulting figure by the starting year value.
In the final step, multiply the figure in decimal notation by 100 to convert the YTD figure into a percentage.
For most companies, the starting date of the fiscal year tends to be January 1st, however, there are exceptions – such as companies such as Apple (AAPL) with fiscal years that begin on different dates, i.e. the end of September.
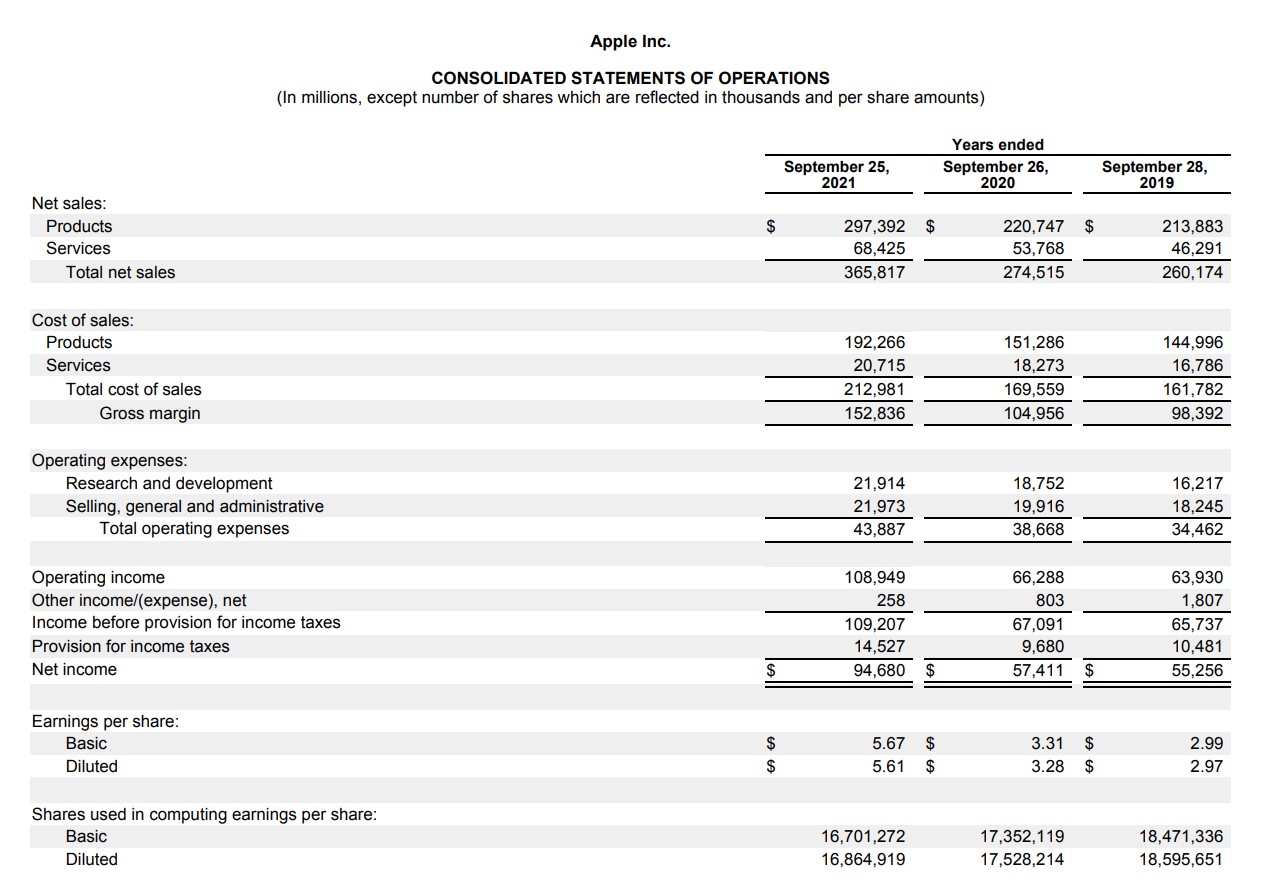
Apple Fiscal Year Ending Date Example (Source: Apple 10-K)
The formula to calculate year-to-date (YTD) performance or returns is as follows.
In order to convert the decimal value into a percentage, the resulting figure must be multiplied by 100.
For example, if an investor's portfolio was worth $200,000 at the beginning of 2022 and is currently worth $220,000 in the middle of 2022, the year-to-date return is calculated as 10%.
The S&P 500, or "Standard and Poor’s 500", is a stock market index tracking the performance of approximately 500 publicly-traded companies based in the U.S.
The screenshot of the graph below reflects the YTD returns of the S&P 500 index as of the latest closing date, November 23, 2022.
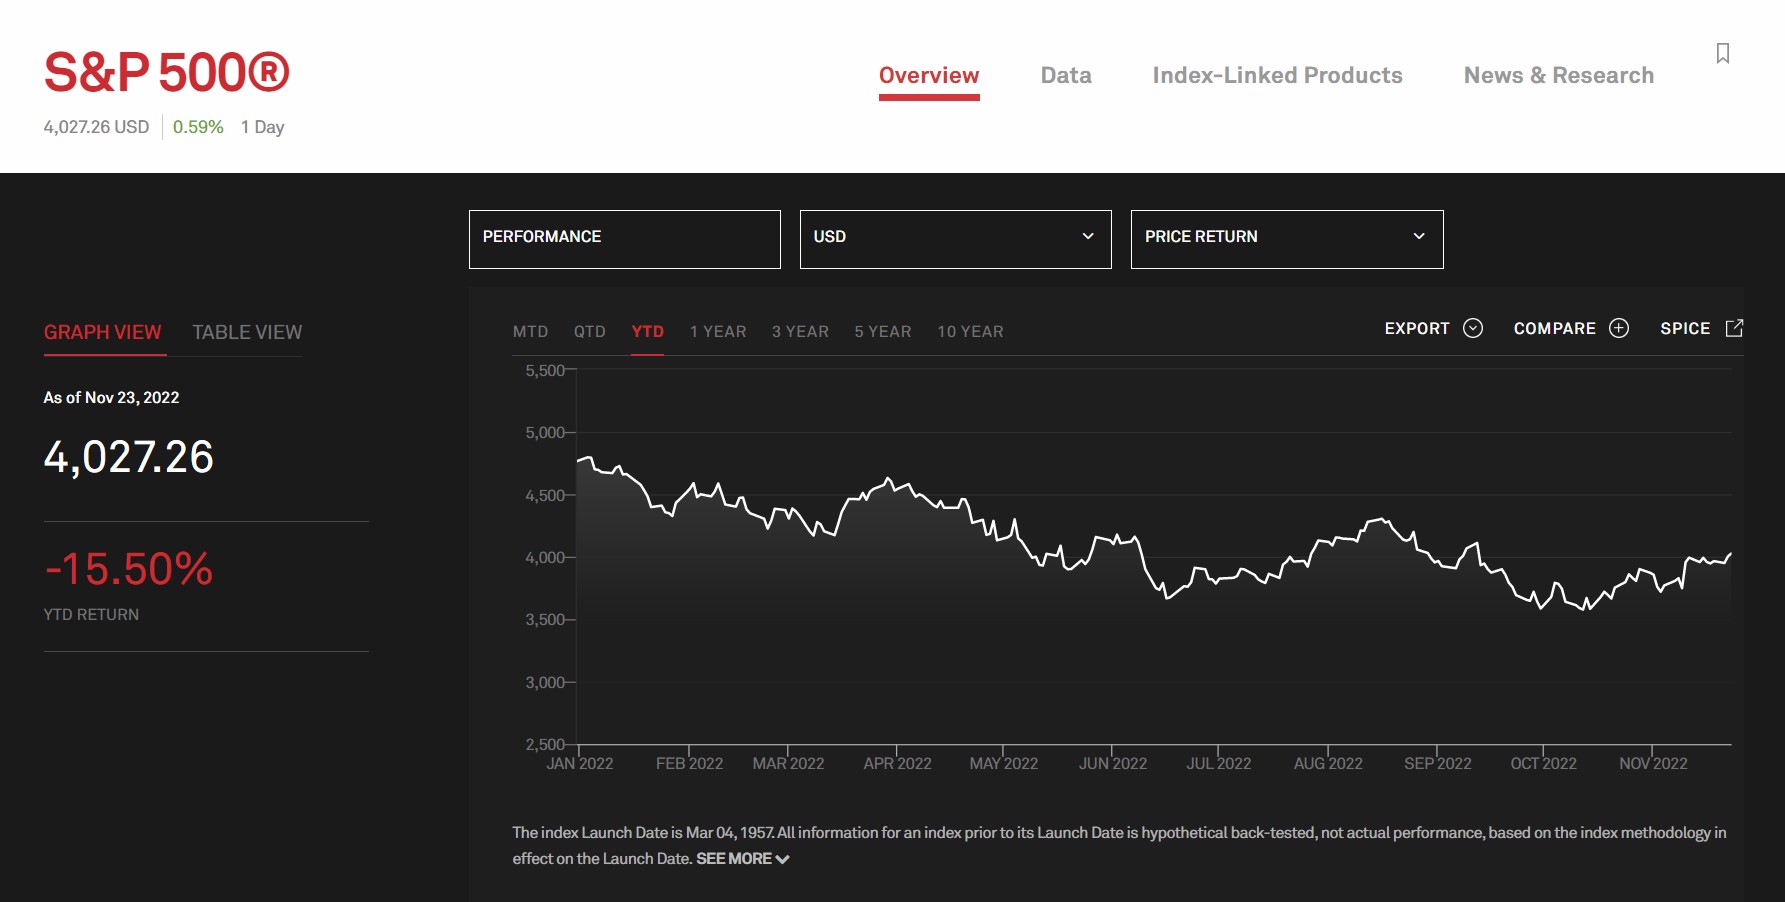
S&P 500 Index YTD Returns (Source: S&P Dow Jones Indices)
We’ll now move to a modeling exercise, which you can access by filling out the form below.


Suppose a company is measuring its year-to-date financial performance to compare its revenue and earnings figures to that of its last fiscal year, 2021.
The company’s 2021 fiscal year and quarterly income statement metrics are as follows.
| Income Statement | 2021A | Q1-2022 | Q2-2022 | Q3-2022 |
|---|---|---|---|---|
| Revenue | $100 million | $26 million | $30 million | $34 million |
| Less: COGS | (40) million | (8) million | (10) million | (12) million |
| Gross Profit | $60 million | $18 million | $20 million | $22 million |
| Less: SG&A | (20) million | (4) million | (5) million | (6) million |
| EBIT | $40 million | $14 million | $15 million | $16 million |
| Less: Interest | (5) million | (1) million | (1) million | (1) million |
| EBT | $35 million | $13 million | $14 million | $15 million |
| Taxes (@ 25% Tax Rate) | (9) million | (3) million | (4) million | (4) million |
| Net Income | $26 million | $10 million | $11 million | $11 million |
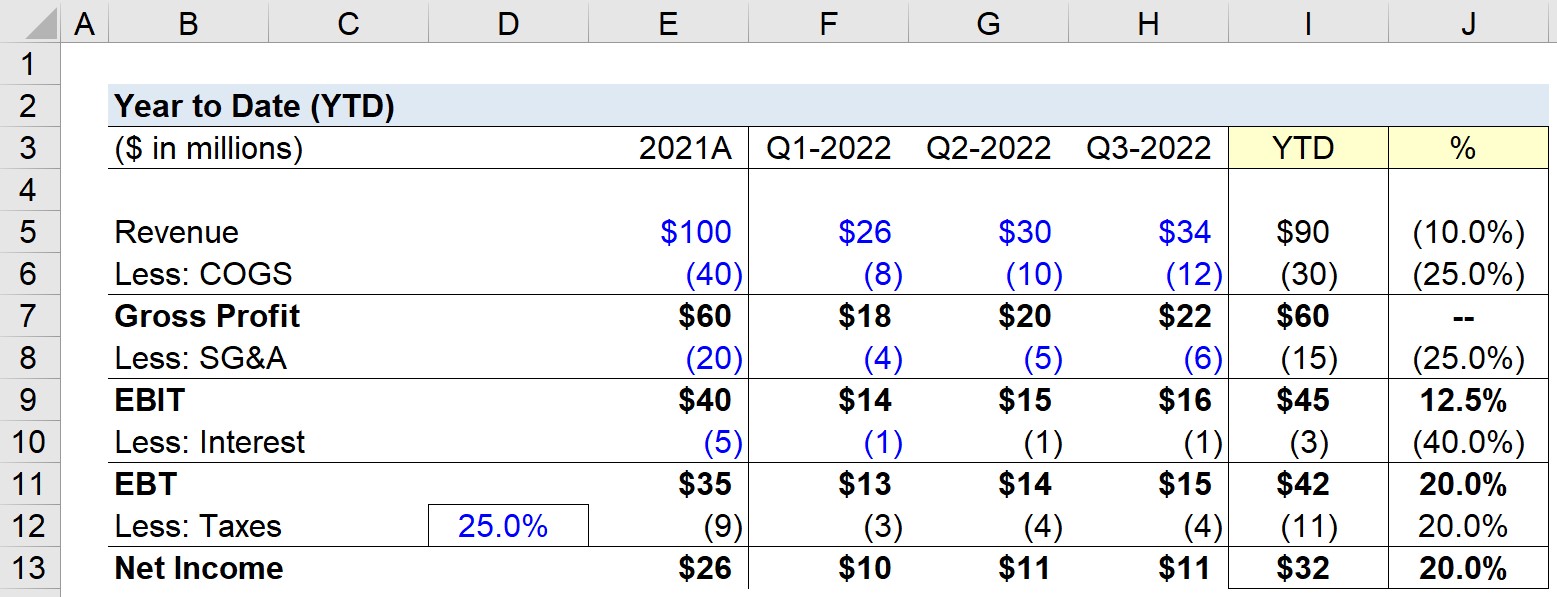
By taking the sum of the quarterly figures, we can arrive at our company’s 2022 year-to-date metrics.
Q1 to Q3 2022 Financials
Note that year-to-date (YTD) financials could also refer to the last four quarters. If that is the case, we would add the financials from Q4-2021.
But in our modeling exercise, we're attempting to gauge the progress of only Q-1 to Q-3 2022 performance to determine how it is tracking compared to fiscal year 2021.
By comparing the performance of three quarters to a full fiscal year, a company can quantify the difference to set targets for Q-4 2022 performance.
If we divide the ending values from above by the beginning values (2021A), we can determine how the company is performing to date.
We’ll focus on the company’s revenue and earnings metrics:

Enroll in The Premium Package: Learn Financial Statement Modeling, DCF, M&A, LBO and Comps. The same training program used at top investment banks.


hi,i want spot formol:
y~=(cp/p0)+(par-p0/T)
Hi, Samaneh,
Can you clarify your question?
BB