The PEG Ratio—shorthand for “Price/Earnings-to-Growth”—is a valuation metric that standardizes the P/E ratio against a company’s expected growth rate.
Unlike the traditional price-to-earnings ratio (P/E), which tends to be used more frequently among investors, the PEG ratio accounts for the future growth of the company.
Generate Key Takeaways
How to Calculate PEG Ratio
The price/earnings-to-growth ratio—or PEG ratio—addresses one of the primary weaknesses of the price-to-earnings (P/E) ratio, which is the lack of consideration for future growth.
Because the P/E ratio is adjusted for the expected earnings growth rate, the PEG ratio can be viewed as a more accurate indicator of a company's true value.
In effect, investors can use the ratio to make more well-informed decisions on whether the market valuation of a stock is currently undervalued or overvalued.
But similar to the P/E ratio, there are two notable pitfalls to the metric:
Positive Net Earnings ➝ The company must have positive net income (the “bottom line”)
Later-Stage of Lifecycle➝ While growth is considered in the PEG ratio formula, companies with significant volatility in growth may not be suited for usage of the metric
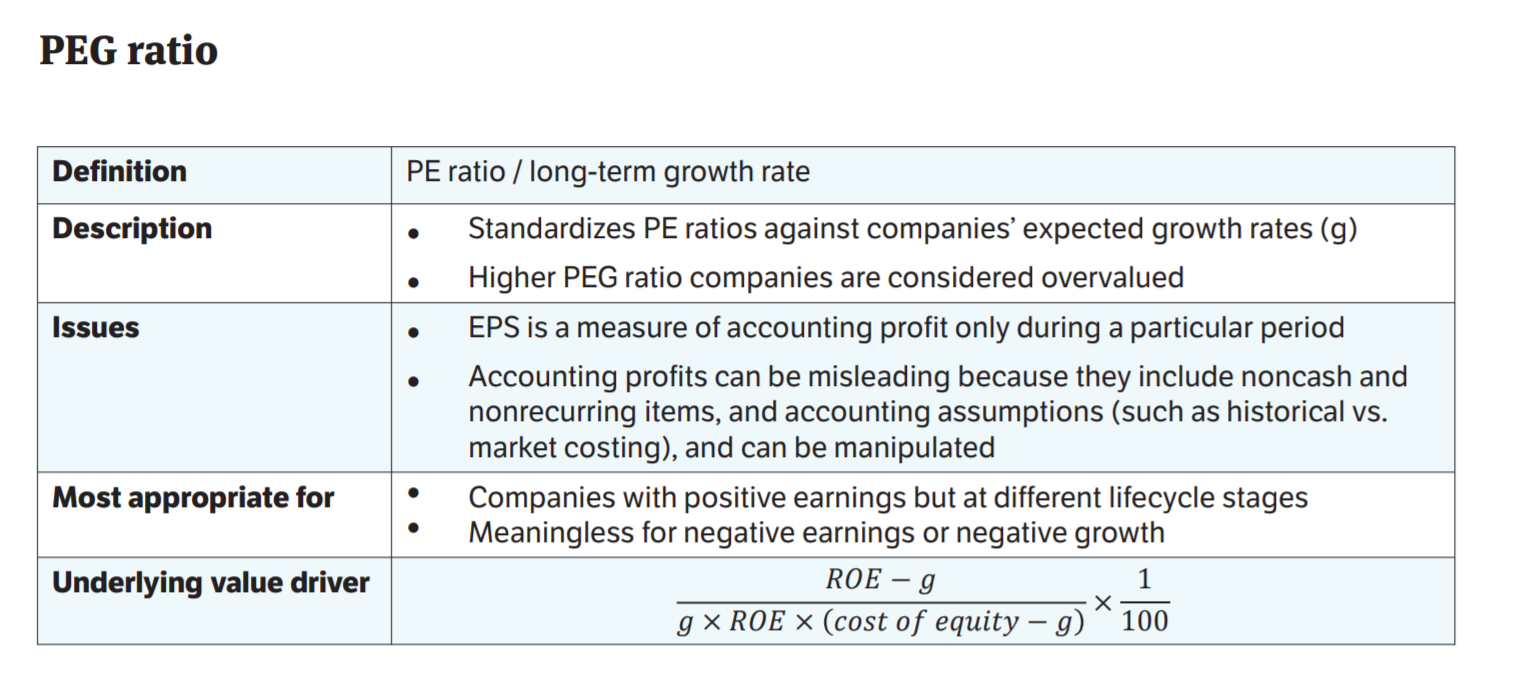
For the reasons mentioned above, the ratio is most appropriate for mature, low to mid-level growth companies, and near meaningless for those with negative earnings or negative projected growth.
Additionally, the PEG ratio uses an accounting measure of profit, net income. Often, accounting profits can be misleading at times due to the:
Inclusion of Non-Cash Expenses ➝ Depreciation and Amortization (D&A)
Differences in Accounting Treatment ➝ Straight-Line Depreciation vs. Accelerated Depreciation, Revenue and Cost Recognition Policies, Inventory Costing Method (FIFO, LIFO)
Overall, accounting measures of profits are prone to discretionary management decisions, which creates room for the “manipulation” of profits to paint a misleading depiction of the company’s profitability.
The three-step process to calculate the PEG ratio is as follows:
Step 3 ➝ Divide P/E Ratio by Expected EPS Growth Rate (g)
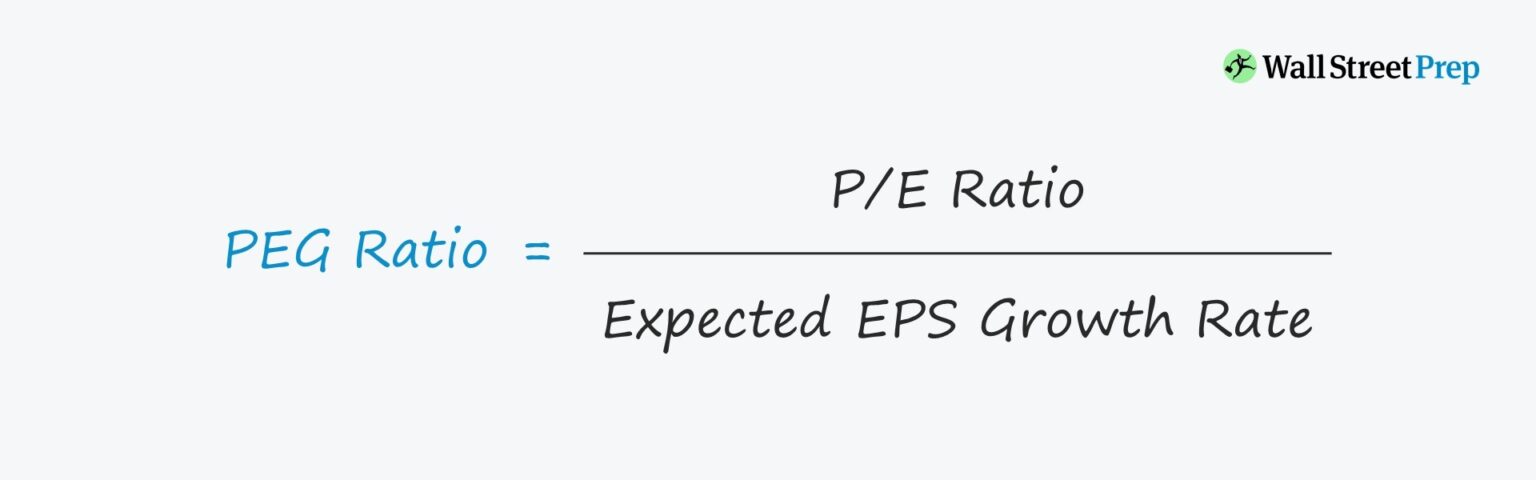
PEG Ratio Formula
The PEG formula consists of calculating the P/E ratio and then dividing the P/E ratio by the expected EPS growth rate for the next couple of years.
PEG Ratio = P/E Ratio ÷ Expected EPS Growth Rate
With regard to the denominator—the expected EPS growth rate—the point here is to ensure that the long-term growth rate assumption is deemed sustainable (i.e. reasonable).
While historical growth rates could be used (or at least referenced), intuitively it would not make much sense as investors value companies based on future growth, not historical growth — albeit the two are closely related.
Note that companies often issue potentially dilutive securities to shareholders and employees. Thus, the total diluted shares outstanding must be used to avoid inflating the earnings per share (EPS) figure.
As a general rule of thumb, if a company's PEG ratio exceeds 1.0x, the stock is considered to be overvalued, whereas a company with a PEG of less than 1.0x is considered to be undervalued.
Besides being an internal measure, the ratio can be compared to a company's industry peer group,
Unlike a standard P/E ratio, the PEG allows for comparisons across a broader range of company types, notably between companies with different growth rates.
However, this does not mean that a company with an EPS growing at 2% can necessarily be compared to a company with EPS growth forecasted at growing 50% year-over-year.
Instead, the differences in growth rates should be relatively reasonable – or, said differently, companies should be at similar stages in their lifecycles to warrant a meaningful comparison.
Higher PEG Ratio➝ Higher ratios in comparison to peers could be interpreted as a *potential* sign that the stock is overvalued (i.e. the market is placing too much value on the future growth of the company)
Lower PEG Ratio ➝ Lower ratios in comparison to peers is a *potential* sign that the company might be undervalued and/or the market is neglecting the expected earnings growth
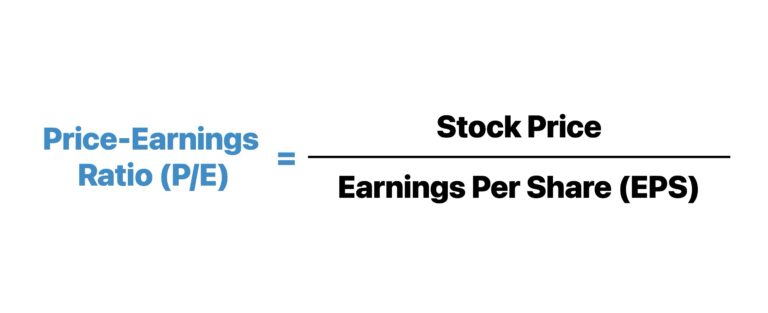
For instance, if a company’s latest closing share price is $5.00 and its diluted EPS in the last twelve months (LTM) is $2.00, we can compute the P/E ratio as follows:
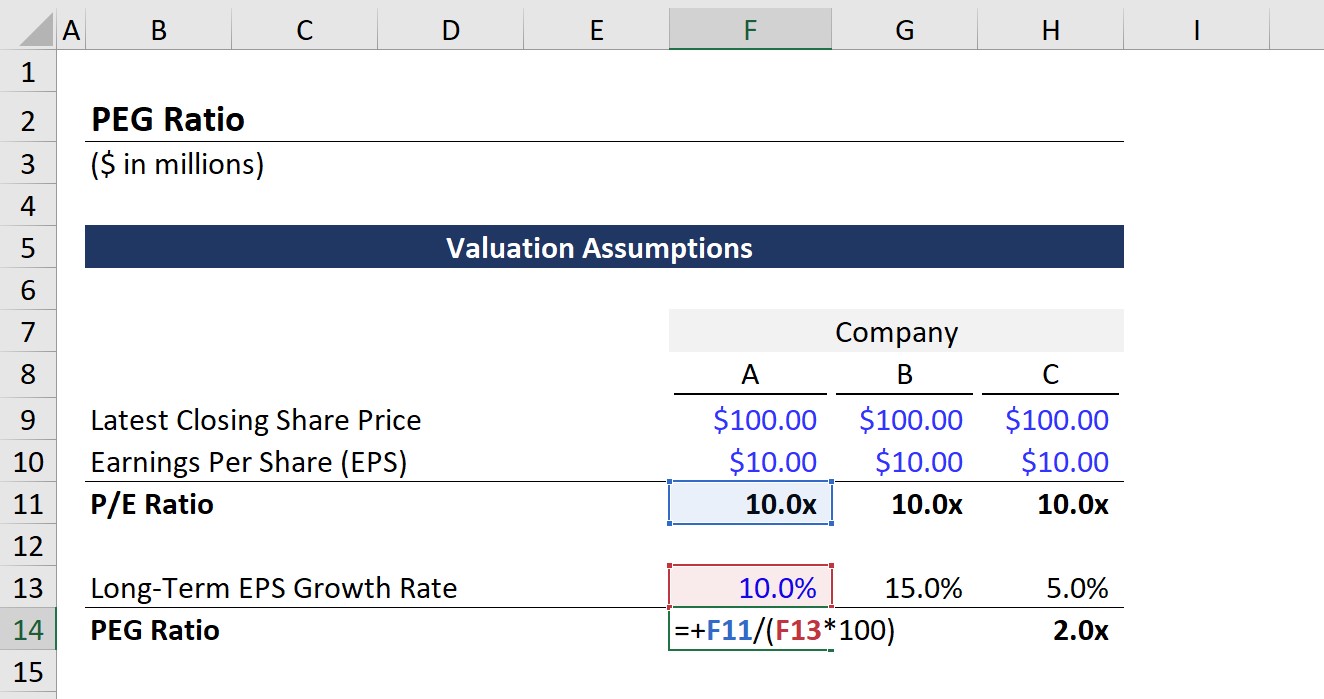
Let's get started – below are the assumptions we'll be using for all three cases for Companies A, B, and C:
Latest Closing Share Price = $100.00
Earnings Per Share (EPS) = $10.00
With that said, the P/E ratio can be calculated by just dividing the share price by the EPS.
P/E Ratio = $100.00 ÷ $10.00 = 10.0x
As of the present day, the market is willing to pay $10 for one dollar of these companies' earnings.
The remaining step is to divide the P/E ratio by the EPS growth rate (g), which is where the differences amongst each of the companies lie.
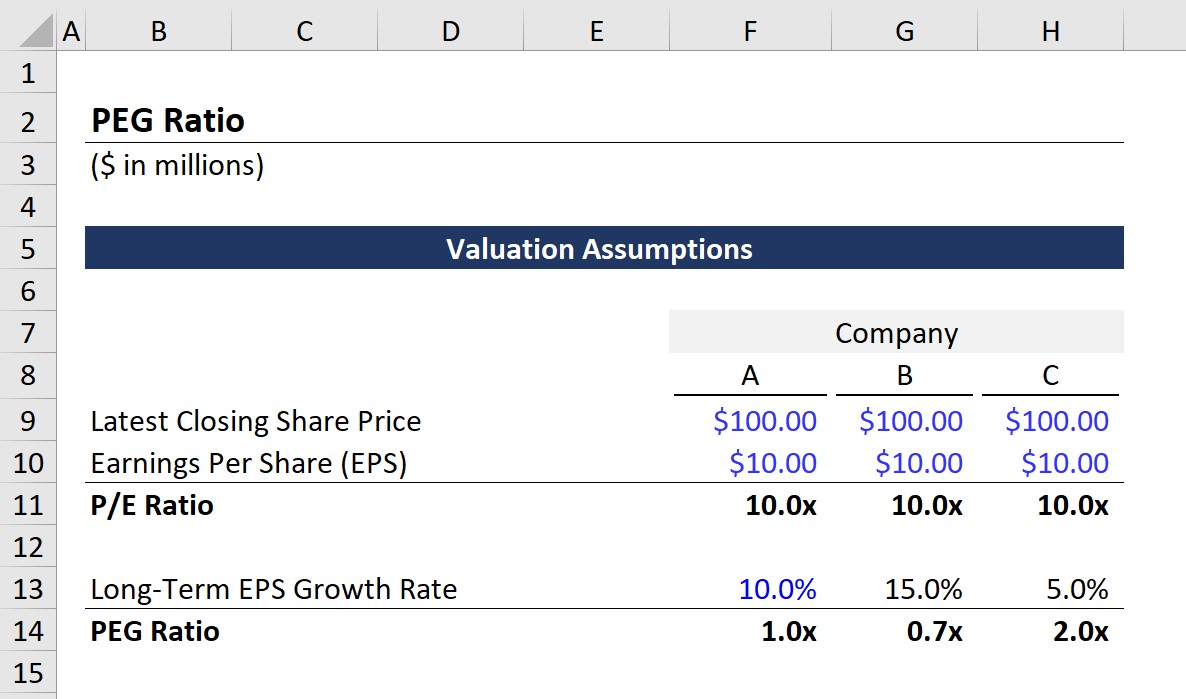
Expected EPS Growth (g), Company A = 10.0%
Expected EPS Growth (g), Company B = 15.0%
Expected EPS Growth (g), Company C = 5.0%
From those assumptions, Company A is our base case, Company B is our upside case (i.e. high growth), and Company C is our downside case (i.e. low growth).
Once the process is done for each scenario (Company A, B, and C), we get the following PEG ratios:
PEG Ratio, Company A = 1.0x
PEG Ratio, Company B = 0.7x
PEG Ratio, Company C = 2.0x
While there are further complexities that must be taken into consideration, from our exercise, we'd interpret these findings are:
Company A is fairly valued (i.e. neither undervalued nor overvalued)
Company B is undervalued and potentially a profitable investment
Company C is overvalued and a potential “sell” if a portfolio holding
If we were to rely solely on the P/E ratio, each company would have a P/E ratio of 10.0x, illustrating the practical use-case of the PEG ratio.
But upon adjusting for the differences in the expected EPS growth rates, we derive more insights into the market values of the three companies.
In conclusion, our exercise highlights how the PEG ratio addresses one of the common sources of criticism of the P/E ratio, and offers a more nuanced perspective on the valuation of a particular company.
Continue Reading Below
Step-by-Step Online Course
Everything You Need To Master Financial Modeling
Enroll in The Premium Package: Learn Financial Statement Modeling, DCF, M&A, LBO and Comps. The same training program used at top investment banks.





No comments yet.