What is Shiller PE Ratio?
The Shiller PE, or “CAPE Ratio” is a variation of the price to earnings ratio adjusted to remove the effects of cyclicality, i.e. the fluctuations in the earnings of companies over different business cycles.

The Shiller PE, or “CAPE Ratio” is a variation of the price to earnings ratio adjusted to remove the effects of cyclicality, i.e. the fluctuations in the earnings of companies over different business cycles.
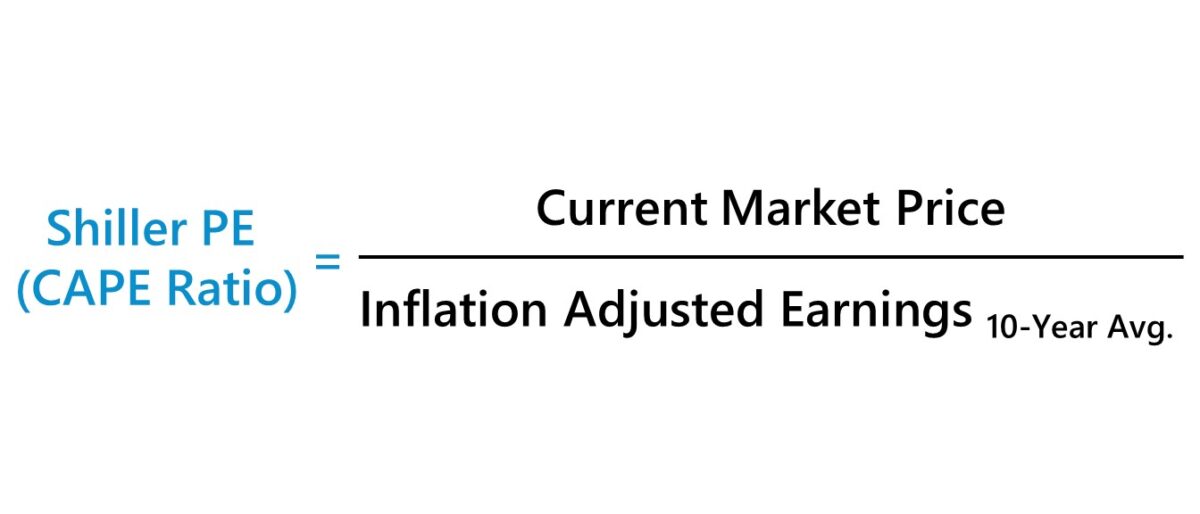
The Shiller PE, or CAPE ratio, refers to the “Cyclically Adjusted Price to Earnings Ratio”, and the rise in its usage is attributed to Robert Shiller, a Nobel Prize-winning economist and renowned professor at Yale University.
Unlike the traditional price to earnings ratio (P/E), the CAPE ratio attempts to eliminate fluctuations that can skew corporate earnings, i.e. “smoothen” the reported earnings of companies.
In practice, the use-case of the CAPE ratio is to track broad market indices, namely the S&P 500 index.
However, taking the average of a company’s reported EPS figures in the past ten years neglects a critical factor that affects the financial performance of all corporations, which is inflation.
In economics, the term “inflation” is a measure of the rate of change in the pricing of goods and services within a country across a specified time frame.
While there is significant criticism (and controversy) surrounding the methodology by which inflation is measured, the Consumer Price Index (CPI) remains the most common measure of inflation in the U.S.
The process of calculating the Shiller PE ratio can be broken into a four-step process:
The formula to calculate the Shiller PE (CAPE Ratio) divides the current share price of a company by its inflation-adjusted earnings, expressed on a 10-year average basis.
The CAPE ratio most often serves as a market indicator, so the share price refers to the market price of a stock market index.
Learn how institutional investors identify high-potential undervalued stocks. Enrollment is open for the upcoming cohort.
The difference between the Shiller P/E ratio and the traditional P/E ratio is the time period covered in the numerator, as we mentioned earlier.
In the following section, we’ll discuss the reason that the traditional P/E ratio can be deceiving to investors at times.
The drawback to the traditional P/E ratio comes down to the concept of cyclicality, which describes the fluctuations in economic activity over time.
Certain sectors might be less prone to the negative effects of cyclicality, i.e. “defensive” sectors,” but the recurring pattern of periods of economic expansion and contraction are natural and, for the most part, inevitable in a free market.
Hence, companies that are barely profitable often exhibit P/E ratios so high that usage of the metric is not informative. But by no means does the high P/E ratio necessarily signal that the company in question is currently overvalued by the market.
The solution offered by the Shiller P/E ratio is to bypass these cyclical periods by calculating the historical ten-year average, with the proper adjustments made to account for the effects of inflation.
While Professor Robert Shiller may be credited for formally presenting the metric to the Federal Reserve and using it in academia, the concept of using a “normalized”, average figure for the earnings metric was not a novel idea.
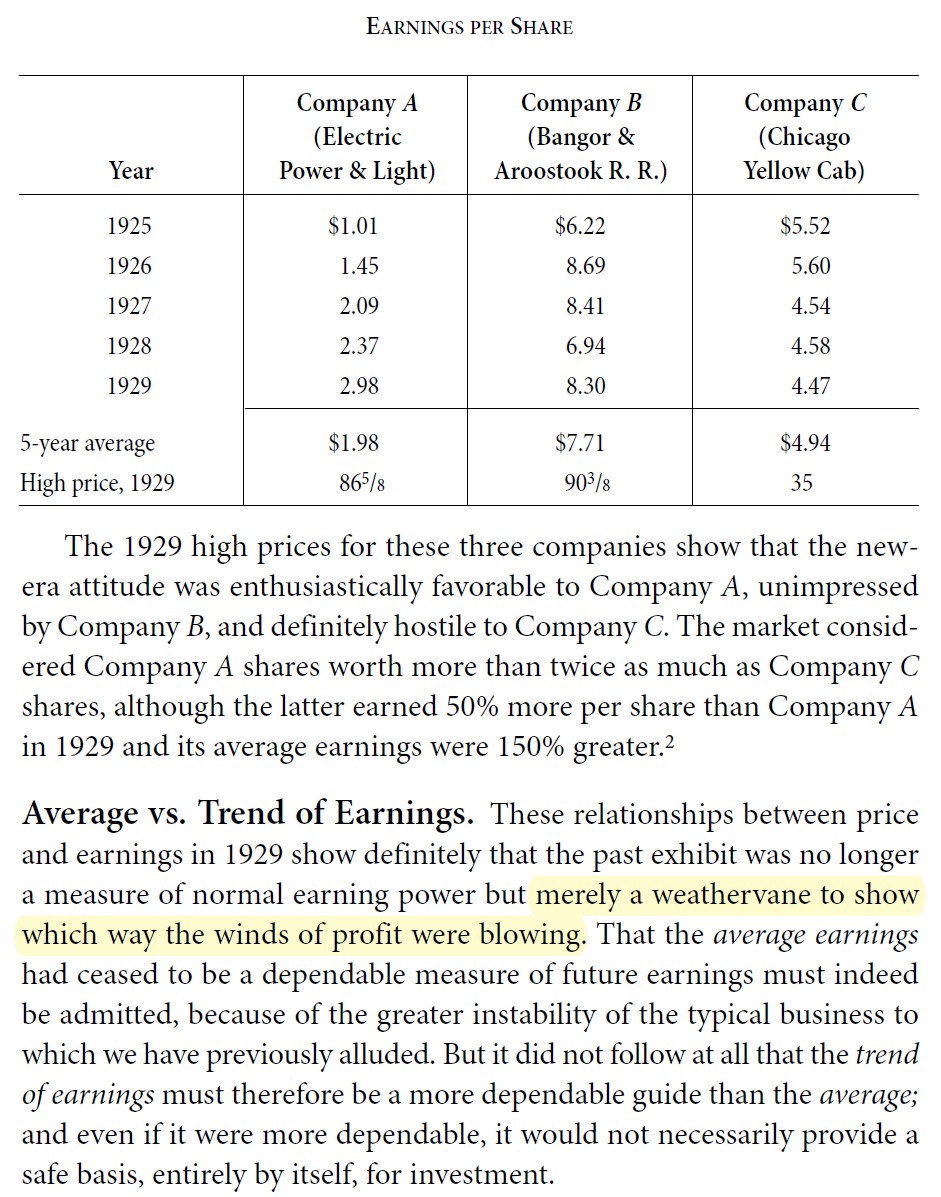
For instance, Benjamin Graham recommended the necessity to use an average of past earnings in his book, Security Analysis. Graham emphasized that tracking recent trends can be informative yet insufficient by itself to make an investment decision, i.e. the long-term “bigger picture” must also be understood to avoid mistakes related to only looking at short-term cyclical patterns.
There are many vocal critics of the Shiller P/E ratio, who point to the following shortcomings:
Note: Profession Shiller has released more alternative data sets in response (Source: Yale Economics Online Data)
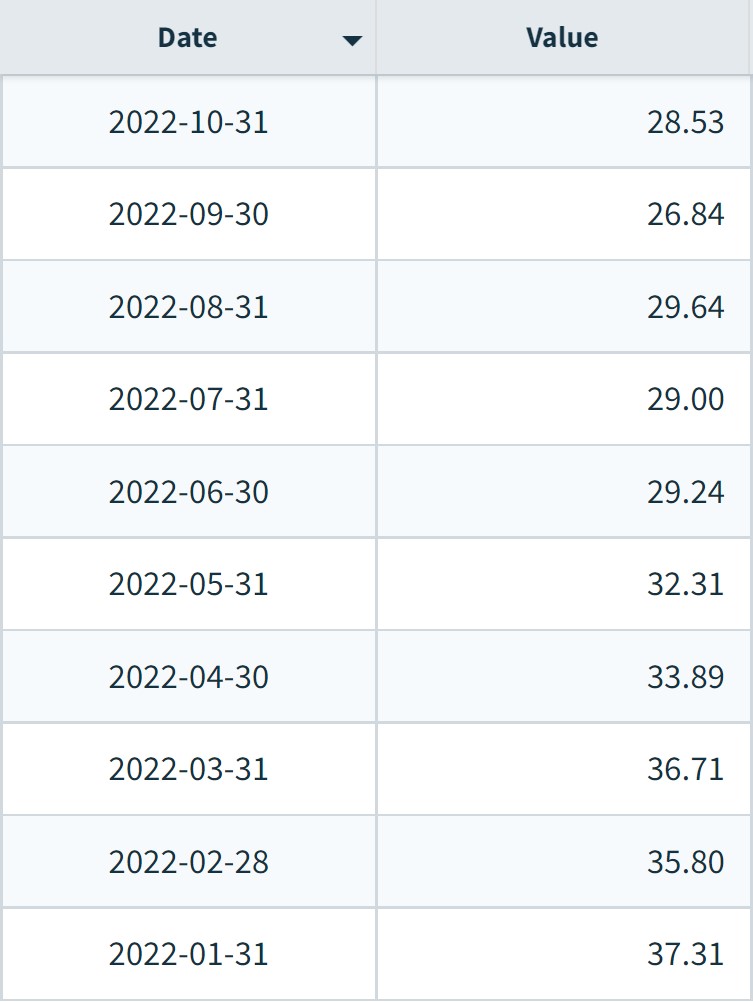
S&P 500 Shiller Index by Month (Source: NASDAQ Data)


No comments yet.