Exit to Learning Dashboard

Days Sales Outstanding (DSO)

Step-by-Step Guide to Understanding Days Sales Outstanding (DSO)

Jul. 19, 2026
8m Read
Matan Feldman
Written ByMatan Feldman
Andrew Federico
Reviewed ByAndrew Federico
UpdatedJul. 19, 2026
Read Time8m

How to Calculate Days Sales Outstanding (DSO)

The days sales outstanding (DSO) is a working capital metric that measures the number of days it takes a company to retrieve cash payments from customers who paid using credit.

Usually, the DSO metric is expressed on an annual basis for comparability, so the average accounts receivable balance is used in the calculation to prevent a timing mismatch.

The accounts receivable (A/R) line item on the balance sheet represents the value of the cash still owed to a company for products or services "earned" (i.e., delivered to customers) per accrual accounting standards.

Customers nowadays are often presented with the option to pay in the form of cash or credit.

In the latter option, the customer has more time post-purchase to actually complete the payment obligation in cash.

Since days sales outstanding (DSO) is the number of days it takes to collect due cash payments from customers who paid on credit, a lower DSO is preferred to a higher DSO.

  • Lower Days Sales Outstanding (DSO)➝ A low DSO implies the company can convert credit sales into cash relatively quickly, and the duration that receivables remain outstanding on the balance sheet before collection is shorter.
  • Higher Days Sales Outstanding (DSO) ➝ But a higher DSO indicates the company is unable to quickly convert credit sales into cash, and the longer the receivables remain outstanding (and less liquidity the company has).

Days Sales Outstanding Formula (DSO)

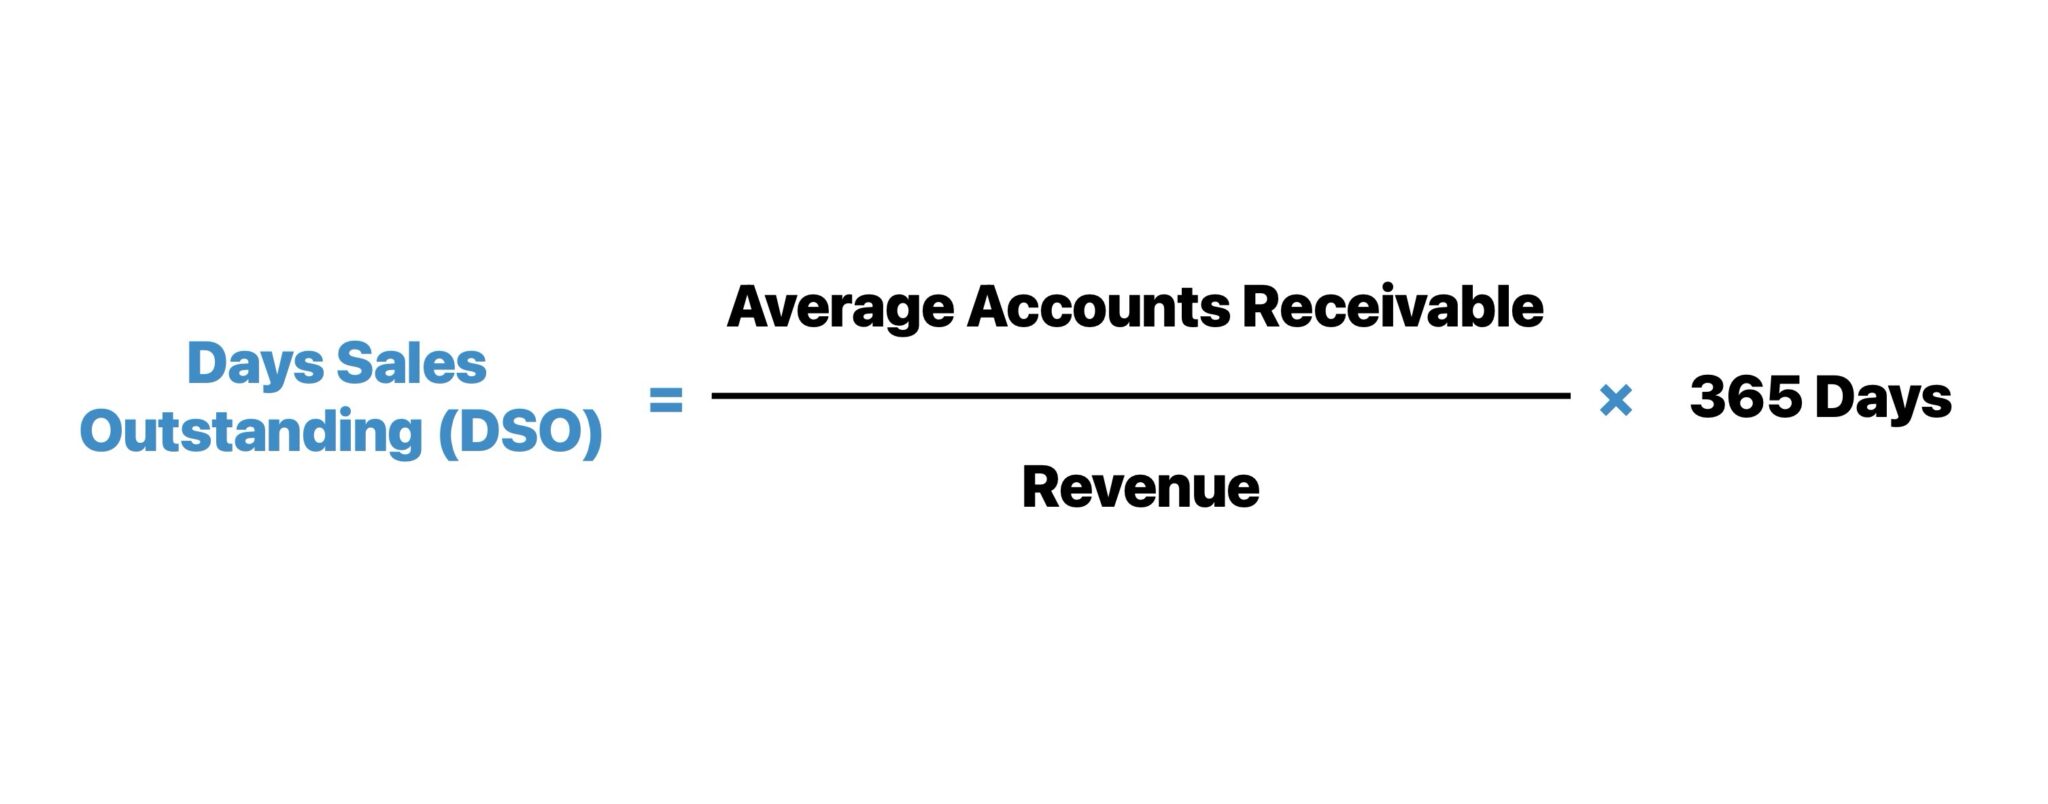
The calculation of days sales outstanding (DSO) involves dividing the accounts receivable balance by the revenue for the period, which is then multiplied by 365 days.

Days Sales Outstanding (DSO) = (Average Accounts Receivable ÷ Net Revenue) × 365 Days

Where:

  • Average Accounts Receivable = (Ending Accounts Receivable + Beginning Accounts Receivable) ÷ 2
  • Net Revenue = Gross Revenue – Returns – Discounts

The reason the days sales outstanding (DSO) metric matters in analyzing the operating efficiency of a company is that faster cash collections from customers directly contribute to increased liquidity (i.e. more cash on hand).

  • Liquidity Risk ➝ The benefits of increased liquidity – i.e. cash on hand – should be intuitive, from a risk standpoint.
  • Cash Flow Generation ➝ The increase in free cash flow (FCF) can be allocated for various purposes, such as reinvestments or capital expenditures (Capex), where a positive return on investment is achievable – rather than merely waiting for the cash payment.

Days Sales Outstanding Calculation Example

Suppose a company accounts receivable (A/R) balance of $30k and $200k in revenue.

If we divide $30k by $200k, the result is 0.15 (or 15%).

We then multiply 15% by 365 days to get approximately 55 for DSO, which means that once a company has made a sale, it takes ~55 days to collect the cash payment.

The product or service has been delivered to the customer (and thus, the revenue is "earned").

But over the course of the waiting period, the company has yet to be paid in cash, despite the revenue being recognized under accrual accounting.

Therefore, the only remaining step is for the customer to hold up their end of the bargain by actually paying the company in cash.

  • Accounts Receivable (A/R) = $30,000
  • Revenue = $200,000
  • A/R % of Revenue = 15%
  • Days Sales Outstanding (DSO) = 15% × 365 Days = 55x

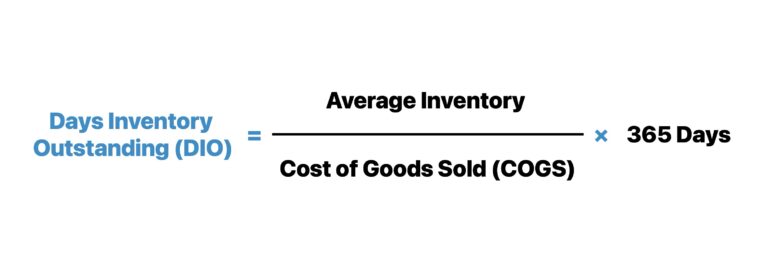
Similar to the calculation of days inventory outstanding (DIO), the average balance of A/R could be used (i.e., the sum of the beginning and ending balance divided by two) to match the timing of the numerator and denominator more accurately.

But the more common approach is to use the ending balance for simplicity, as the difference in methodology rarely has a material impact on the B/S forecast.

What is a Good Days Sales Outstanding (DSO)?

If a company's days sales outstanding (DSO) is increasing over time relative to historical periods, the change implies operational inefficiencies to fix, as more time is required to collect cash from credit sales.

On the other hand, if a company's days sales outstanding (DSO) is decreasing, the downward trend is a positive sign suggesting the company is more efficient at cash collection (and thus has more cash).

As a general rule of thumb, companies strive to minimize days sales outstanding (DSO), since it implies the current payment collection method is efficient.

Recall that an increase in an operating working capital asset is a reduction in FCFs (and the reverse is true for working capital liabilities).

That said, an increase in A/R represents an outflow of cash, whereas a decrease in A/R is a cash inflow, as it means the company has been paid and thus has more liquidity (cash on hand).

  • Decreasing Days Sales Outstanding (DSO) ➝ Efficient Cash Collection from Credit Sales (Higher Free Cash Flow)
  • Increasing Days Sales Outstanding (DSO) ➝ Inefficient Cash Collection from Credit Sales (Less Free Cash Flow)

One exception, however, is for seasonal companies, where sales are concentrated in a specific quarter, or cyclical companies where annual sales are inconsistent and fluctuate based on the prevailing economic conditions.

While analyzing only credit sales, rather than net sales, is technically more accurate, public companies seldom report their revenue with cash and credit sales separated, or the details around the timing of customer purchases, in their SEC financial filings (10-K, 10-Q).

For example, a DSO of 85 days could be the industry standard in a high-end industrial products manufacturer with commercial customers, expensive pricing, and low-frequency purchases, whereas 85 days would be a concerning figure for a company in the clothing retail industry.

For our hypothetical clothing retailer, it is presumably necessary to improve its current collection methods, as confirmed by its DSO trailing its industry peers (i.e. competitors).

How to Lower Days Sales Outstanding (DSO)

For inefficiently-run companies with DSOs greater than their industry comparables, common methods to lower the DSO include the following examples:

  1. Decline Payments via Credit (or Offer Incentives such as Discounts for Cash Payments)
  2. Identify Customers with Repeated History of Delayed Payments (Place Targeted Restrictions – e.g., Require Upfront Cash Payments)
  3. Perform Customers Credit Background Checks (Relevant for Installment Payment Agreements)

However, in certain cases, extended DSOs could be a function of a customer making up a significant source of revenue for the company, which enables them to push back their payment dates (i.e., buyer power and negotiating leverage).

Thus, it is critical to not only diligence industry peers (and the nature of the product/service sold) but the customer-buyer relationship.

For example, a major customer that has a track record of delayed payments is not considered as problematic, especially if the relationship with the customer is long-term and there have never been any past concerns about this particular customer not paying.

Days Sales Outstanding Calculator (DSO)

We’ll now move to a modeling exercise, which you can access by filling out the form below.

Excel Template IconDownload Icon

1. Income Statement Assumptions

Suppose we're tasked with forecasting the accounts receivable (A/R) balance of a hypothetical company that reported revenue of $200mm in 2020.

Over the course of the projection period, the company's management team expects revenue to grow at a constant rate of 10.0% each year.

  • Revenue (2020A) = $200mm
  • Revenue Growth (%) = 10% per Year

2. Days Sales Outstanding (DSO) Calculation Example

The first step to projecting accounts receivable is to calculate the historical DSO.

The DSO for 2020 can be calculated by dividing the $30mm in A/R by the $200mm in revenue and then multiplying by 365 days, which comes out to 55, which means that it takes the company roughly ~55 days on average to collect cash from credit sales.

Here, we only have a single data point to work with (2020 DSO = 55 days), but for modeling on the job, it is ideal to take a close look at historical trends over multiple years.

The general rules of thumb to perform trend analysis on a company's days sales outstanding (DSO) are as follows.

  • Consistent Trend → If the DSO has remained consistent year-over-year, then you could simply extend the DSO assumption to future years (i.e., link to the cell on the left). Or, you can take the average of the past couple of years to normalize for any minor cyclicality.
  • Upward or Downward Trend → However, if DSO has been trending upward or downward, this would warrant a more in-depth look into what is happening internally at the company. If a company is making progress towards becoming more efficient at collecting payments, then A/R days should gradually continue to decrease over time. But the cause of the decrease in DSO should be identified before blindly carrying the assumption forward.

Note: As a sanity check, a company's days sales outstanding (DSO) assumptions should also be referenced against the average DSO of comparable peers.

3. Accounts Receivable Forecast

Now, we can project A/R for the forecast period, which we'll accomplish by dividing the carried-forward DSO assumption (55 days) by 365 days and then multiply it by the revenue for each future period.

  • Days Sales Outstanding (DSO) = 55x ("Straight-Lined")

For example, A/R is forecasted to be $33mm in 2021, which was calculated by dividing 55 days by 365 days and multiplying the result by the $220mm in revenue.

The output for the A/R projections from 2021 to 2025 from our completed days sales outstanding (DSO) model is as follows:
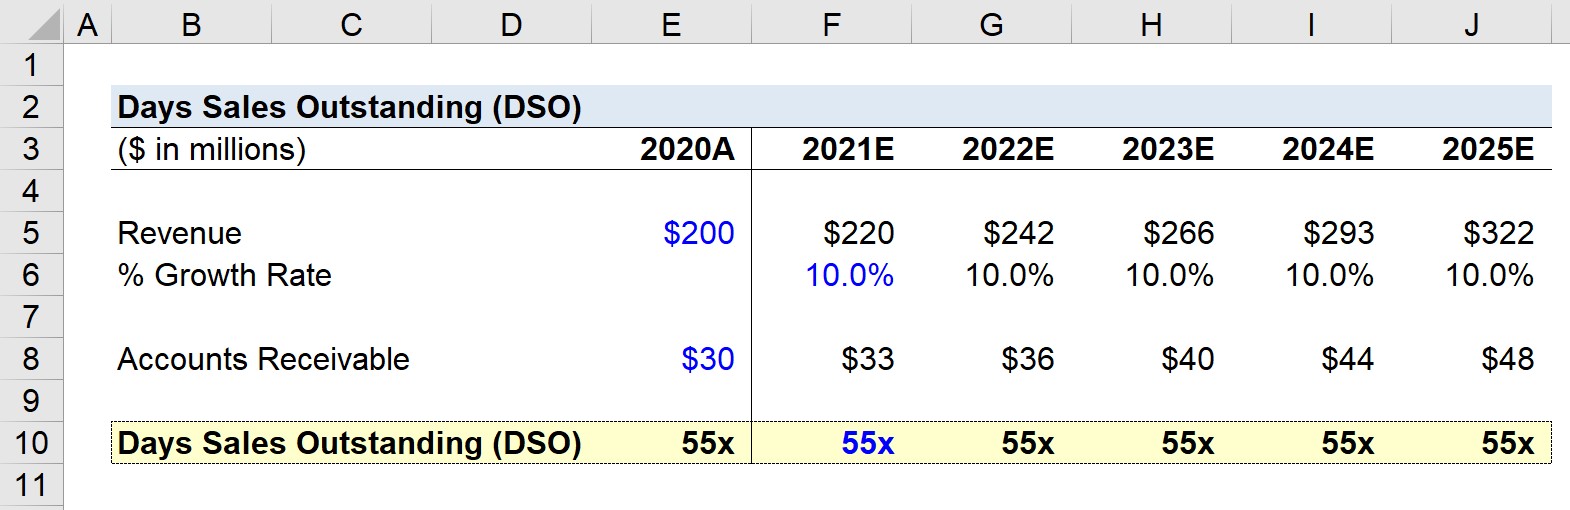

  • Accounts Receivable, 2021E = $33 million
  • Accounts Receivable, 2022E = $36 million
  • Accounts Receivable, 2023E = $40 million
  • Accounts Receivable, 2024E = $44 million
  • Accounts Receivable, 2025E = $48 million
Days Sales Outstanding Calculator (DSO)
Continue Reading Below
Everything You Need To Master Financial Modeling
Step-by-Step Online Course
Everything You Need To Master Financial Modeling

Enroll in The Premium Package: Learn Financial Statement Modeling, DCF, M&A, LBO and Comps. The same training program used at top investment banks.

Enroll Today
AI in Finance

Improving DSO Monitoring and Analysis with AI

Monitoring Days Sales Outstanding (DSO) is vital for managing cash flow, but manual tracking can delay insights and mask risk. Artificial intelligence improves this process by automating receivables analysis, highlighting overdue accounts, and forecasting payment behavior. Wall Street Prep and Columbia Business School Executive Education developed the AI for Business & Finance Certificate Program to train professionals in AI-enhanced cash flow planning and automated credit analytics.
Learn the AI for Finance Skill Set →

Frequently Asked Questions
What's the difference between DSO and DPO?
DSO measures how many days it takes a company to collect cash from its own customers after a credit sale, reflecting how quickly the company gets paid. DPO measures the opposite side of the relationship: how many days a company takes to pay its own suppliers after receiving a bill. A company benefits from a lower DSO and a higher DPO simultaneously, since that combination means collecting cash quickly while holding onto cash longer before paying it out.
How does DSO relate to the cash conversion cycle?
DSO is one of three components that make up the cash conversion cycle, alongside days inventory outstanding and days payable outstanding, and it specifically represents the receivables collection leg of that cycle. A rising DSO extends the overall cash conversion cycle, meaning cash stays tied up longer in the business, while a falling DSO shortens the cycle and frees up cash more quickly for reinvestment or debt paydown.
Can a company have a DSO that's too low?
While a low DSO is generally favorable, an unusually low DSO relative to industry peers can sometimes indicate overly strict credit terms that are pushing away potential customers who would prefer more flexible payment options. In competitive industries where offering credit terms is a meaningful sales tool, being too aggressive about collecting cash quickly can cost a company revenue and market share, even though it looks efficient on a working capital basis.
What's the difference between DSO and the average collection period?
There isn't a meaningful difference: DSO and average collection period are two names for the same metric, both measuring the average number of days it takes a company to collect cash from credit sales. The terms are used interchangeably across finance literature and company disclosures, so encountering one or the other in a filing or textbook doesn't signal a different calculation methodology.
How do early payment discounts affect DSO?
Offering customers a discount for paying early, such as a 2% discount for payment within 10 days instead of the standard 30, incentivizes faster cash collection and typically lowers a company's DSO if enough customers take advantage of the offer. The tradeoff is that the company sacrifices a small percentage of revenue on each discounted sale, so the benefit of improved cash flow needs to be weighed against the cost of the discount itself.
What's a bad debt reserve, and how does it relate to DSO?
A bad debt reserve is an estimate a company sets aside for the portion of its accounts receivable it expects will never actually be collected, based on historical collection patterns and customer credit risk. A rising DSO combined with a growing bad debt reserve can be a warning sign that a company isn't just collecting cash more slowly, but that a meaningful portion of its outstanding receivables may never convert to cash at all.
How can factoring or selling receivables affect a company's reported DSO?
When a company sells its accounts receivable to a factoring company for immediate cash, those receivables come off the balance sheet, which can artificially lower reported DSO even though the company's underlying customer payment behavior hasn't actually improved. This is worth watching for when comparing DSO across companies or time periods, since a sudden drop in DSO driven by factoring reflects a financing decision rather than a genuine gain in collection efficiency.
What's considered a good DSO for a SaaS or subscription business?
SaaS and subscription businesses often have relatively low DSOs, frequently in the 30 to 45 day range, since much of their revenue is billed on a recurring basis with automated payment collection built directly into the subscription model. Companies with a strong mix of monthly, auto-charged subscriptions tend to sit at the lower end of that range, while those relying more heavily on annual invoicing to enterprise customers typically show a somewhat higher DSO due to longer negotiated payment terms.
Why might DSO spike temporarily even if a company's collections process hasn't changed?
A DSO spike can occur when a disproportionately large sale closes near the end of a reporting period, since that revenue and the resulting receivable get added to the balance before there's been any real time to collect on it yet. This kind of timing-driven spike often self-corrects in the following period once that specific sale is collected, which is why it's worth looking at a trend over several periods rather than reacting to a single quarter's DSO figure in isolation.
Does DSO capture cash sales, or only credit sales?
In principle, DSO is meant to measure only credit sales, since cash sales are collected immediately and shouldn't factor into how long it takes to convert credit into cash. In practice, most public companies report a single combined revenue figure without separating cash and credit sales, so DSO is typically calculated using total revenue as an approximation, which slightly understates the true DSO for companies that do a meaningful portion of business in cash upfront.
Comments

No comments yet.