What is A/R Days?
The A/R Days measures the approximate number of days in which a company needs to retrieve cash from customers that paid using credit.

The A/R Days measures the approximate number of days in which a company needs to retrieve cash from customers that paid using credit.
The A/R days metric, more formally referred to as days sales outstanding (DSO), counts the average number of days between the date of a completed credit sale and the date of cash collection.
In practice, the usage of A/R days is most common for two purposes:
For internal purposes, the importance of tracking A/R days is tied to ensuring a company is operating at the highest level of efficiency attainable.
Since A/R days quantifies the number of days necessary to obtain the unmet cash payments still owed from customers, companies have the incentive to reduce the amount of time required.
The longer a company's accounts receivables (A/R) remain outstanding on its balance sheet, the less cash on hand the company possesses, which could otherwise be spent on reinvestments, such as funding its day-to-day working capital needs and capital expenditures (Capex).
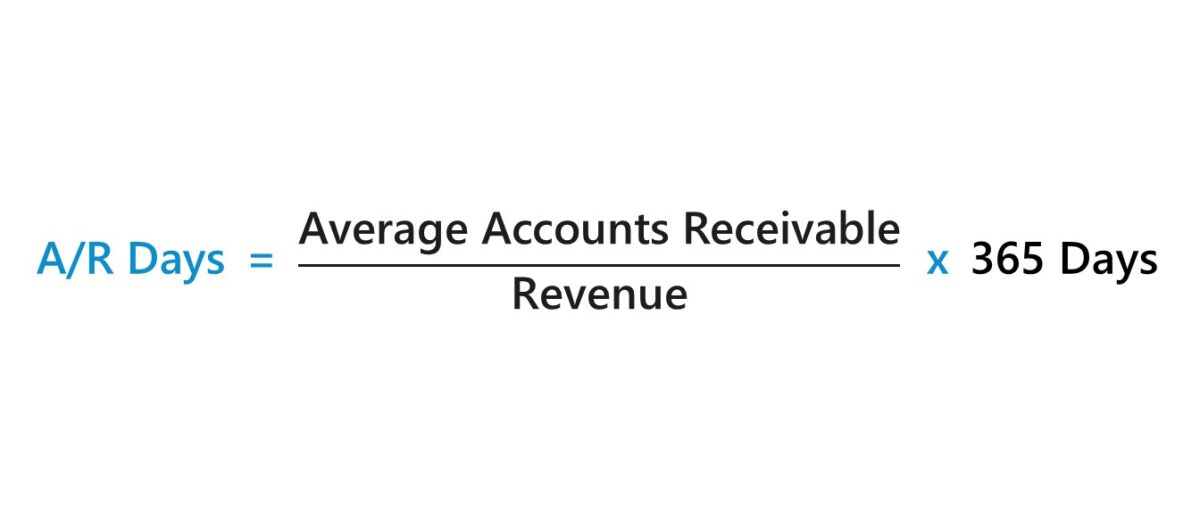
The formula to calculate the A/R days is as follows.
Because of the fact that revenue (i.e. the "top line") comes from the income statement, whereas the accounts receivable line item comes from the balance sheet, there is a mismatch in timing, i.e. the income statement tracks a company's financial performance over a period of time, while the balance sheet is a “snapshot” of a company's assets, liabilities, and equity at a specific point in time.
Hence, using the average accounts receivable balance is technically the more accurate method to fix the discrepancy in timing. However, unless a company's accounts receivable balance is significantly different across the two historical periods, there are no issues with using the ending balance rather than the average balance.
We’ll now move on to a modeling exercise, which you can access by filling out the form below.


Suppose you're tasked with forecasting a company's accounts receivable balance for a five-year time horizon given the following historical data.
| Historical Data | 2020A | 2021A | 2022A |
|---|---|---|---|
| Net Revenue | $100 million | $120 million | $150 million |
| Accounts Receivable (A/R) | $20 million | $22 million | $26 million |
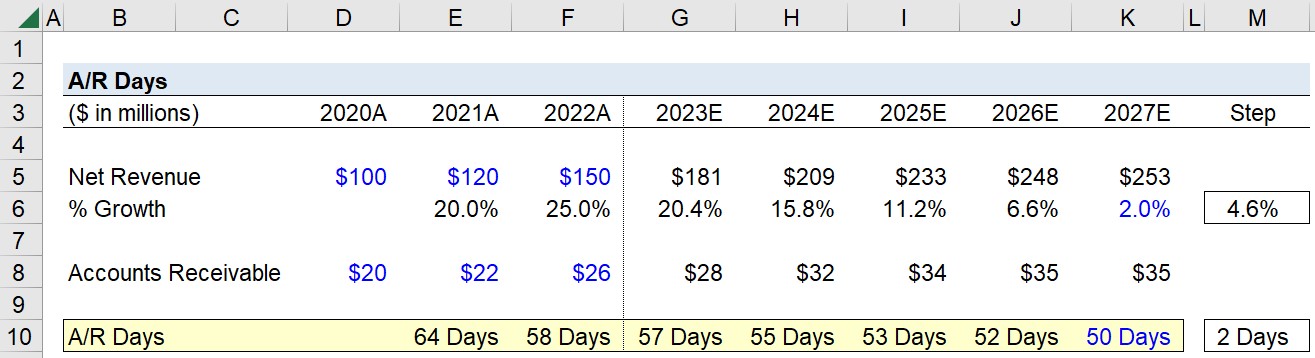
We'll start by calculating the A/R days in the historical periods to have a point of reference, which we'll achieve by dividing the sum of the current and prior period accounts receivable balance by the current period revenue, followed by multiplying the resulting figure by 365 days.
The historical A/R days come out to be 64 days and 58 days in 2021 and 2022, respectively.
Based on the limited information we have on hand, we'll assume our company's operating efficiency, based upon its cash collection from credit sales, appears to be improving over time considering the decline from 64 days to 58 days.
In the next part of our tutorial, we'll forecast our company's accounts receivable balance for the next five-year period.
Our company's revenue growth will be assumed to decline to 2.0% by the end of 2027 in equal increments, i.e. the year-over-year (YoY) growth rate declines by 4.6% in each period.
For our forward-looking operating assumptions regarding A/R – following industry analysis and comparisons to mature industry peers – we'll estimate our company's A/R days reaches 50 days by the end of 2027, an implied incremental reduction of approximately 2 days per year.
With all our required assumptions now listed in our spreadsheet, we'll now project our company's accounts receivable balance across the five-year forecast period using the following formula.
Upon entering that equation into our forecast period, we arrive at the following accounts receivable balances.

Enroll in The Premium Package: Learn Financial Statement Modeling, DCF, M&A, LBO and Comps. The same training program used at top investment banks.


No comments yet.