What is A/P Days?
A/P Days counts the average number of days it takes for a company to fulfill an invoice from suppliers or vendors for orders placed using credit.

A/P Days counts the average number of days it takes for a company to fulfill an invoice from suppliers or vendors for orders placed using credit.
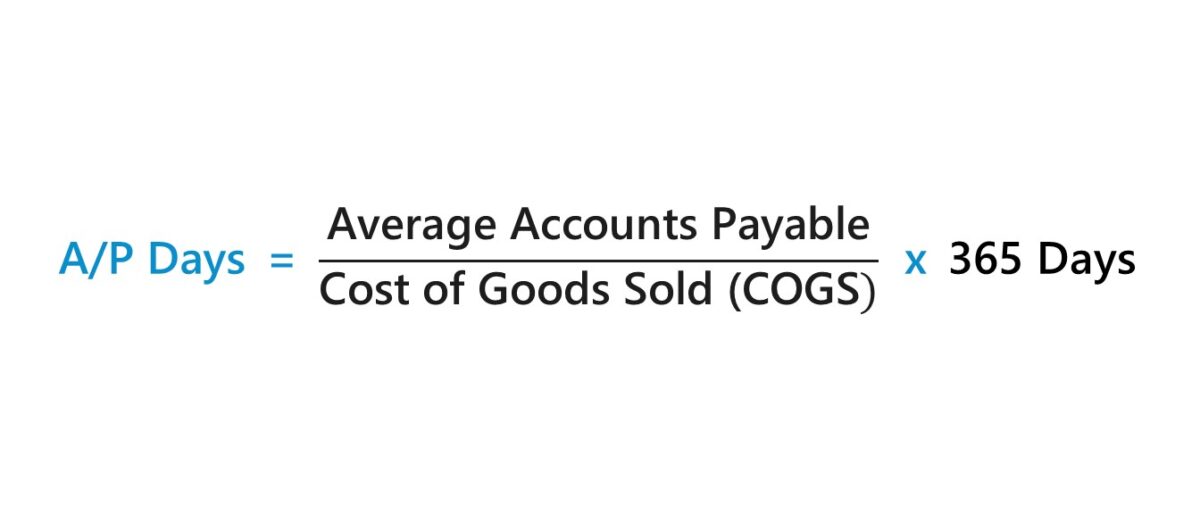
The A/P days metric, often referred to as days payable outstanding (DPO), measures the time between the date of a credit purchase from a supplier or vendor and the date of cash payment, expressed in terms of days.
The accounts payable line item appears in the current liabilities section of the balance sheet and captures a company’s total outstanding balance of unmet payments from past purchases made on credit. The supplier or vendor, as part of their agreement with the customer, already delivered the good or service to the company under the expectation of being paid in cash soon thereafter.
Therefore, the A/P days metric tracks the number of days it takes for a company to fulfill its obligation to pay its outstanding invoices owed to suppliers or vendors.
There are three primary use cases of the A/P days metric:
The formula to calculate the A/P days is as follows.
Since COGS is a line item on the income statement, while the accounts payable line item comes from the balance sheet, there is a mismatch in timing as the two financial statements cover different periods. More specifically, the income statement measures a company's financial performance across a period, whereas the balance sheet is a “snapshot” at a specific point in time.
Therefore, the average balance of accounts payable is the most accurate approach to align the timing mismatch. In most cases, however, using the ending balance does not make a significant enough difference unless there was a drastic change in the business model and efficiency of the company across the period.
Considering A/P days measures the number of days between the initial date of credit purchase and the date of cash payment to the suppliers or vendors that fulfilled their end of the transaction, companies strive to extend the amount of time until the cash is paid.
Of course, unmet invoices must eventually be taken care of by the company, but the company is free to spend that cash in the meantime for other needs. Hence, accounts payable functions like financing provided by the supplier with no interest owed, in contrast to other forms of debt securities.
We’ll now move on to a modeling exercise, which you can access by filling out the form below.


Suppose you’re tasked with forecasting a company’s accounts payable for a five-year period using the following historical data.
| Historical Data | 2020A | 2021A | 2022A |
|---|---|---|---|
| Cost of Goods Sold (COGS) | ($50 million) | ($60 million) | ($75 million) |
| Accounts Payable | $10 million | $13 million | $18 million |
Since we need a point of reference upon which to base our assumptions, the first step is to calculate the historical A/P days in the historical periods.
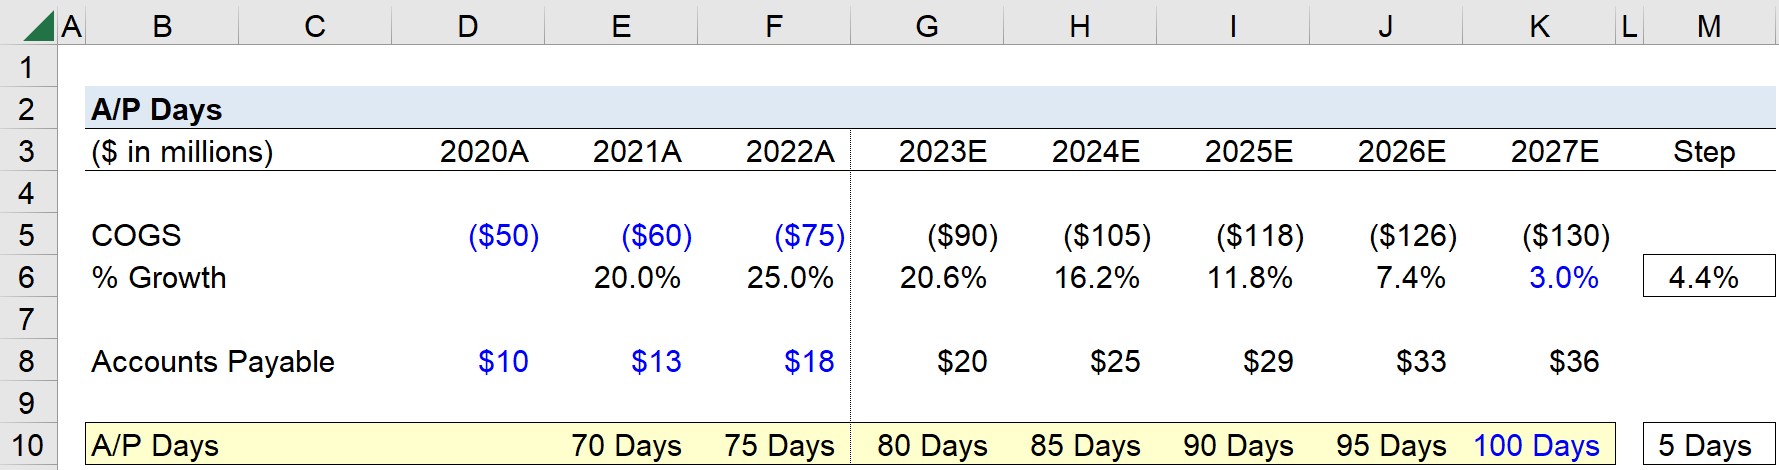
By calculating the sum of the accounts payable balance in the current and prior year, and then dividing by two, we arrive at 70 days and 75 days in 2021 and 2022, respectively.
Based on the trailing periods, the company extends its days payable, which is typically perceived as a positive sign, although there are exceptions such as a company being incapable of paying their invoices (and thus be at risk of becoming insolvent).
Note: Because COGS was entered as a negative number in our sign convention, a negative sign must be placed in front of the equation, or else the A/P days will be negative.
In the next section of our exercise, we’ll forecast our company’s accounts payable balance for the next five periods.
The growth rate of our company’s cost of goods sold (COGS), the underlying driver of our A/P forecast, will be assumed to reach 3.0% by the end of 2027 in equal increments (i.e. the growth rate declines by a constant 4.4% each year).
Using a step function, the projected COGS incurred by the company is as follows.
With our projection of the COGS line item complete, we’ll perform a similar process for our forward-looking A/P days assumptions.
The average A/P days among mature companies operating in the same industry as our company is 100 days, which we’ll use as our final year assumption.
Like earlier, we’ll use a step function to incrementally increase our A/P days assumption from 75 days at the end of 2022 to 100 days by the end of 2027, an implied increase of 5 days per year.
We now have all the required inputs to forecast our accounts payable line item, which we’ll accomplish using the following formula.
In closing, we arrive at the following forecasted accounts payable balances after entering the equation above into our spreadsheet.

Enroll in The Premium Package: Learn Financial Statement Modeling, DCF, M&A, LBO and Comps. The same training program used at top investment banks.


No comments yet.