What is Inventory Days?
Inventory Days measures the average amount of time in which a company’s inventory is held on hand until it is sold.

Inventory Days measures the average amount of time in which a company’s inventory is held on hand until it is sold.
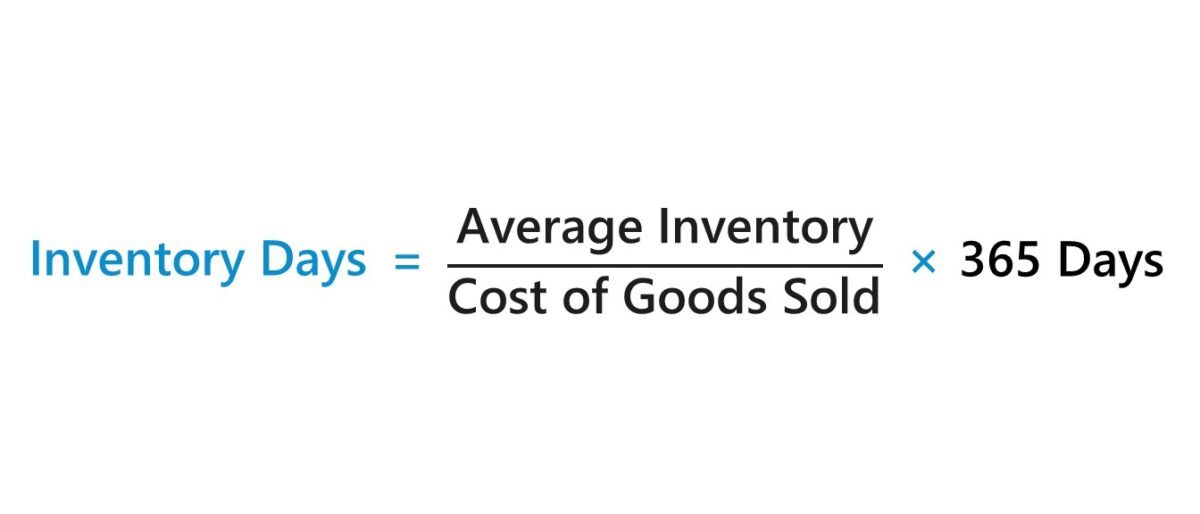
The inventory days metric, otherwise known as days inventory outstanding (DIO), counts the number of days on average it takes for a company to convert its inventory on hand into revenue.
On the balance sheet, the "Inventory" line item appears in the current assets section and represents the outstanding dollar value of a company's entire inventory and consists of three primary components:
The following list describes some practical use-cases of the inventory days KPI:
The process of calculating a company’s inventory days can be broken into four steps:
The formula to calculate inventory days is as follows.
While COGS is a line item found on the income statement, the inventory line item is found in the current assets section of the balance sheet. In effect, there is a timing mismatch as the income statement measures performance across a period, but the balance sheet is a "snapshot" of a company's assets, liabilities, and shareholder's equity at a specific point in time.
The average inventory balance is thereby used to fix the timing misalignment. However, there is usually no material impact on the completed model if the ending balance of inventory is used in lieu of the average balance, although there can be outliers, which would be signified by substantial differences between a company's inventory balance.
Since the inventory days KPI tracks the time required by a company to sell through its inventories, companies strive to reduce the number of days in which inventory is kept on hand before being sold, i.e. they aim for quicker cycles of inventory orders.
Otherwise, the company's inventory is waiting to be sold for a prolonged duration – which at the risk of stating the obvious – is an inefficient situation to be in that management must fix.
Whether drastic measures are required or not is dictated by the circumstances at hand. But at a bare minimum, the management team (and supporting team) should spend time researching the following:
If the time needed by a company to sell through its inventory is higher than comparable companies operating in the same industry, that is a potential red flag that adjustments to the current business model and inventory management practices might be necessary.
One mistake to avoid, however, is to compare the inventory days of companies in completely different industries, as that would be an unfair comparison where the interpretation is likely to be incorrect (i.e. "apples-to-oranges").
In the best-case scenario, no further action might be necessary, as the accumulation of inventory could be a byproduct of targeting a niche customer segment and operating in a cyclical market that balances out over the long run.
We’ll now move on to a modeling exercise, which you can access by filling out the form below.


Suppose you’re tasked with forecasting a company’s ending inventory for a five-year period given the following historical data.
| Historical Data | 2020A | 2021A | 2022A |
|---|---|---|---|
| Cost of Goods Sold (COGS) | ($80 million) | ($100 million) | ($140 million) |
| Inventory | $10 million | $12 million | $15 million |
To have a point of reference to base our operating assumptions upon, our first step is to calculate the historical inventory days in the historical periods (2020 to 2022).
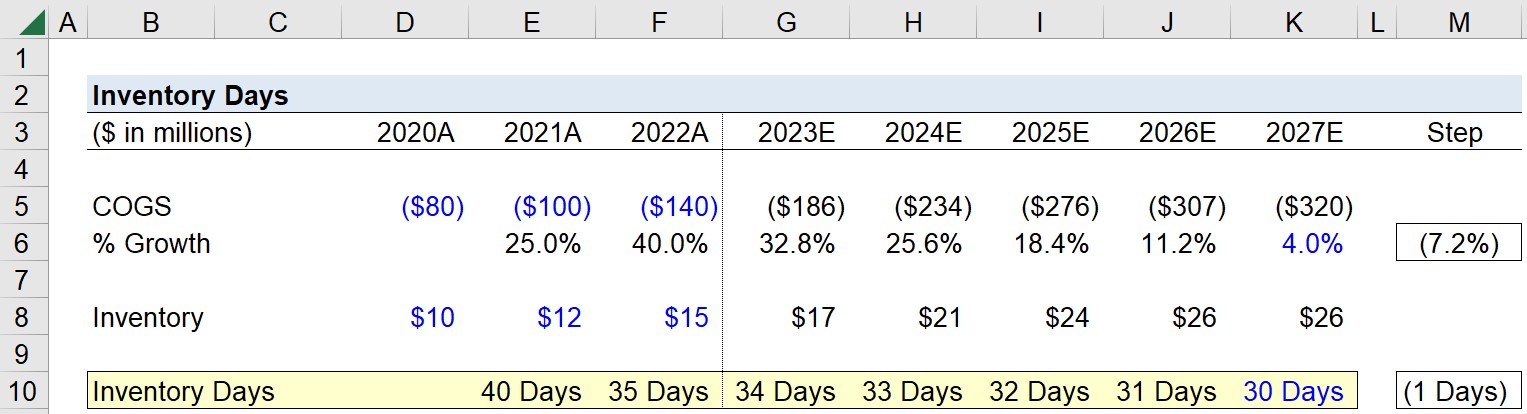
By adding the current and prior year inventory balance, and then dividing it by two, the inventory days calculated comes out to 40 days and 35 days in 2021 and 2022, respectively.
Based on the recent downward trend from 40 days to 35 days, the company seems to be moving in the right direction in terms of becoming more efficient at clearing out its inventory quickly.
Note: The cost of goods sold (COGS) line item was entered as a negative number, so a negative sign must be placed in front of the inventory days formula, otherwise the KPI will be a negative integer.
The next part of our exercise comprises forecasting our company's ending inventory across the five-year projection period.
The growth rate of our company's cost of goods sold (COGS) is assumed to reach 4.0% by the end of 2027, with the change in the growth rate occurring in equal increments.
Using a step function, we'll reduce the growth rate in 2022 by 7.2% each period until reaching our target 4.0% growth rate by the end of the forecast.
If the historical inventory days metric remains constant, the historical average can be used to project the inventory balance. However, if there is a clear directional trend in recent years – as in the case of our hypothetical scenario – it is recommended to follow the downward (or upward) trajectory, while remaining cognizant of the industry average (i.e. to perform a "sanity check" to ensure the assumptions are within reason).
Using a step function, the projected COGS incurred by the company is as follows.
The projection of the cost of goods sold (COGS) line item finished, so the next step is to repeat a similar process for our forward-looking inventory days assumptions that'll drive the forecast.
We'll assume the average inventory days of our company's industry peer group is 30 days, which we'll set as our final year assumption in 2027. Like earlier, a step function is used to incrementally reduce our assumption from 35 days at the end of 2022 to our target 30-day assumption by the end of 2027, which implies a decline of approximately one day per year.
We now have the necessary components to input into our forecasted inventory formula.
In closing, we arrive at the following forecasted ending inventory balances after entering the equation above into our spreadsheet.

Enroll in The Premium Package: Learn Financial Statement Modeling, DCF, M&A, LBO and Comps. The same training program used at top investment banks.


No comments yet.