What is Revenue Per Employee?
The Revenue Per Employee measures the sales efficiency of a company by comparing its revenue to its number of employees.

The Revenue Per Employee measures the sales efficiency of a company by comparing its revenue to its number of employees.
The revenue per employee metric is utilized by companies to track the sales productivity of an average employee.
While there are limitations to the metric — such as representing an overly broad, lagging indicator of operating efficiency — the RPE still can be useful for internal budgeting and setting targets related to sales quotes.
In particular, the metric is most applicable for companies where the primary strategy for driving growth is via the sales team (e.g. software-as-a-service, or “SaaS”).
If the revenue per employee increases over time, that implies the operational efficiency of the company has improved – all else being equal.
In other words, the company can generate the same (or more) revenue using fewer resources, which in this case refers to the number of employees.
Therefore, a company with higher revenue per employee should expect to see more favorable profit margins – all else being equal.
However, for the metric to retain its usefulness, comparisons are limited to a company’s own historical periods and to its closest industry peers.
For example, an industry with high operating leverage like energy and telecommunications would see much greater revenue per employee metrics on average than in retail.
Other factors such as the company’s maturity (e.g. early-stage, growth-stage, late-stage) and size with regard to total revenue must also be taken into account.
Learn how institutional investors identify high-potential undervalued stocks. Enrollment is open for the upcoming cohort.
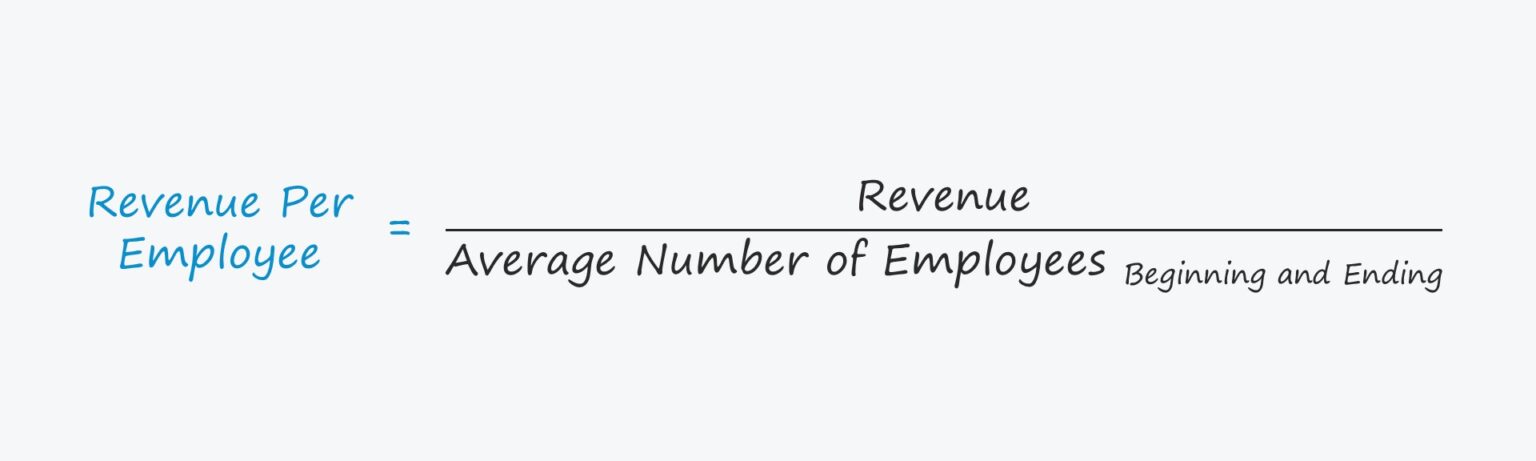
The formula to calculate revenue per employee is the ratio between revenue and the average number of employees over a pre-defined period.
Where:
The rationale for using the average number of employees rather than the ending employee count is to match the numerator and denominator in the duration covered (and to account for employee turnover through the year).
But the difference is normally negligible unless there is a noticeable amount of employee churn or new hiring.
The metric can be made more practical by including only the employees that are directly involved in generating revenue, such as the sales team, yet such information is not always readily accessible.
We’ll now move to a modeling exercise, which you can access by filling out the form below.


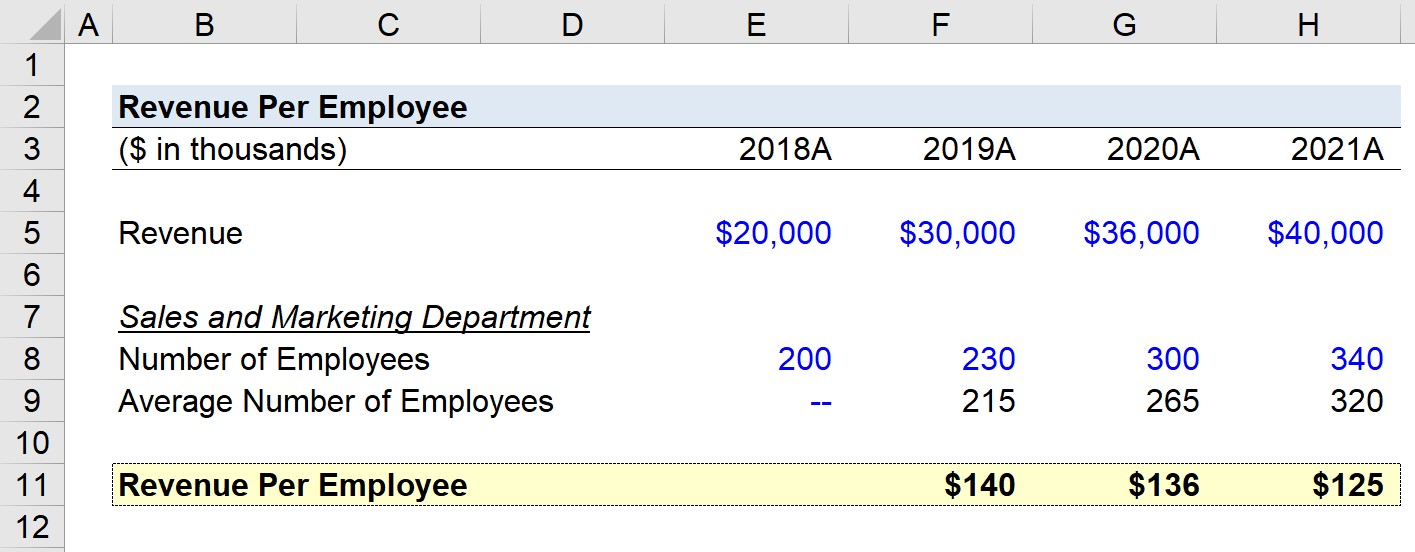
Suppose a SaaS company is attempting to measure the efficiency of its sales and marketing team by tracking its revenue per employee.
The employee data we’ll be working with consists of the following:
The revenue that corresponds to the periods above is as follows:
Starting in 2019, we’ll take the revenue amount and divide it by the average of the ending employee count and the prior year's employee count, which results in the company’s revenue per employee.
While the average revenue per employee may have declined over time from $140k to $125k, that is not necessarily a red flag, considering how minor the decrease is relative to the fact that the company's revenue has doubled.


No comments yet.