What is AOV?
Average Order Value (AOV) estimates the typical amount spent by a customer in each order, commonly placed on a website (i.e. e-commerce) or mobile app.

Average Order Value (AOV) estimates the typical amount spent by a customer in each order, commonly placed on a website (i.e. e-commerce) or mobile app.
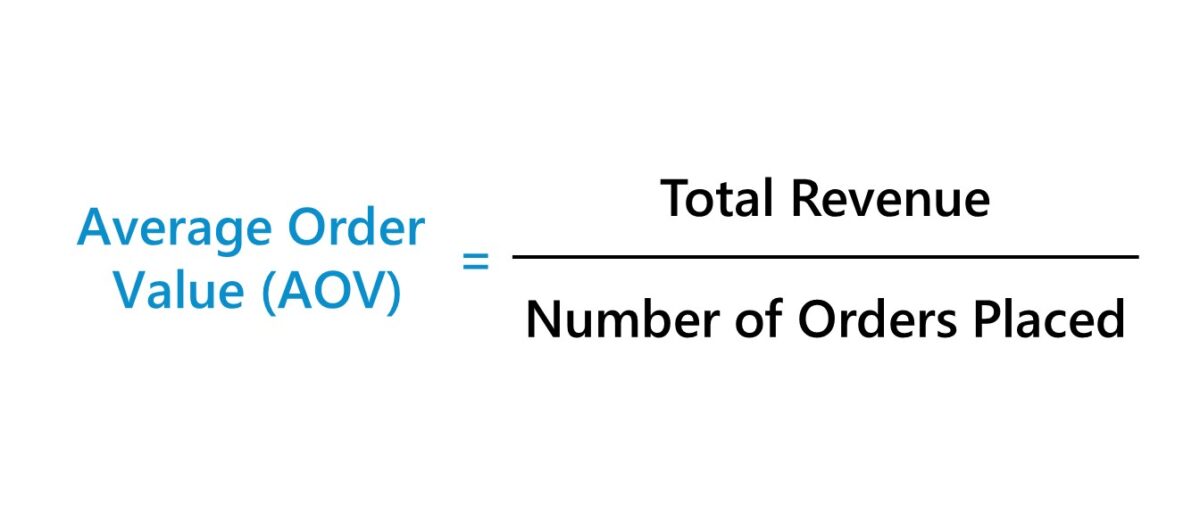
The average order value (AOV) is an estimate of the revenue generated per product sale.
By measuring the average order value (AOV), a company – most often operating in the e-commerce vertical – can obtain insights regarding the spending patterns of its customers.
In particular, tracking the average order value metric can help understand if upselling/cross-selling efforts have been paying off.
If so, the company's average order value over time should reflect a positive trend line moving upward year-over-year (YoY), which is a positive signal that the current strategy in working as planned.
Clearly, companies desire their customers to spend more in each order, as this implies their product/service offerings are complementary.
The steps to calculate the average order value (AOV) are as follows:
The formula for calculating the average order value (AOV) divides the total revenue by the number of orders placed.
Similar to the average selling price (ASP) and average revenue per user (ARPU) metrics, the core of the average order value KPI is a price metric divided by a volume metric, which is the inverse of the traditional bottom-up revenue forecast.
Learn how institutional investors identify high-potential undervalued stocks. Enrollment is open for the upcoming cohort.
Companies can increase their AOV by identifying and segmenting their top customers – i.e. higher percentage of total revenue contribution – and then delivering them personalized sales and marketing (S&M) tactics.
Not only does this encourage these high-value customers to purchase more and increase their AOV, but it also helps with customer retention.
Furthermore, patterns can be recognized where the top customers share traits, which can help guide the go-to-market strategy – i.e. target more similar customers as market demand (and value-add) has been confirmed.
In addition, companies can better understand the needs of their customers and introduce new products/services to address those needs appropriately – developed either internally or via M&A.
We’ll now move to a modeling exercise, which you can access by filling out the form below.


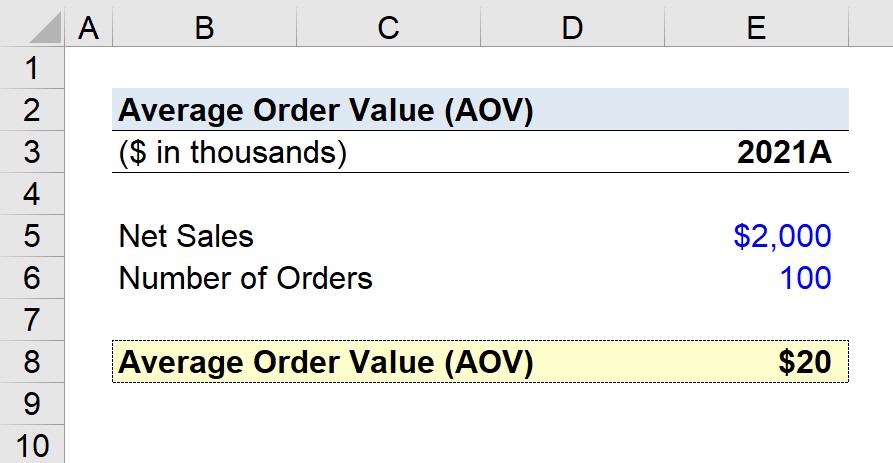
Suppose an e-commerce company generated $2 million in net sales last year, 2021, with 100,000 total orders.
Upon dividing the company’s net sales figure by the order count, we arrive at the company's AOV.
In closing, our company’s average order value (AOV) comes out to $20, which reflects the typical customer order size.


No comments yet.