What is Net Promoter Score?
The Net Promoter Score—or “NPS”—measures a customer’s willingness to promote a specific product or service to their friends, family, and colleagues.

The Net Promoter Score—or “NPS”—measures a customer’s willingness to promote a specific product or service to their friends, family, and colleagues.
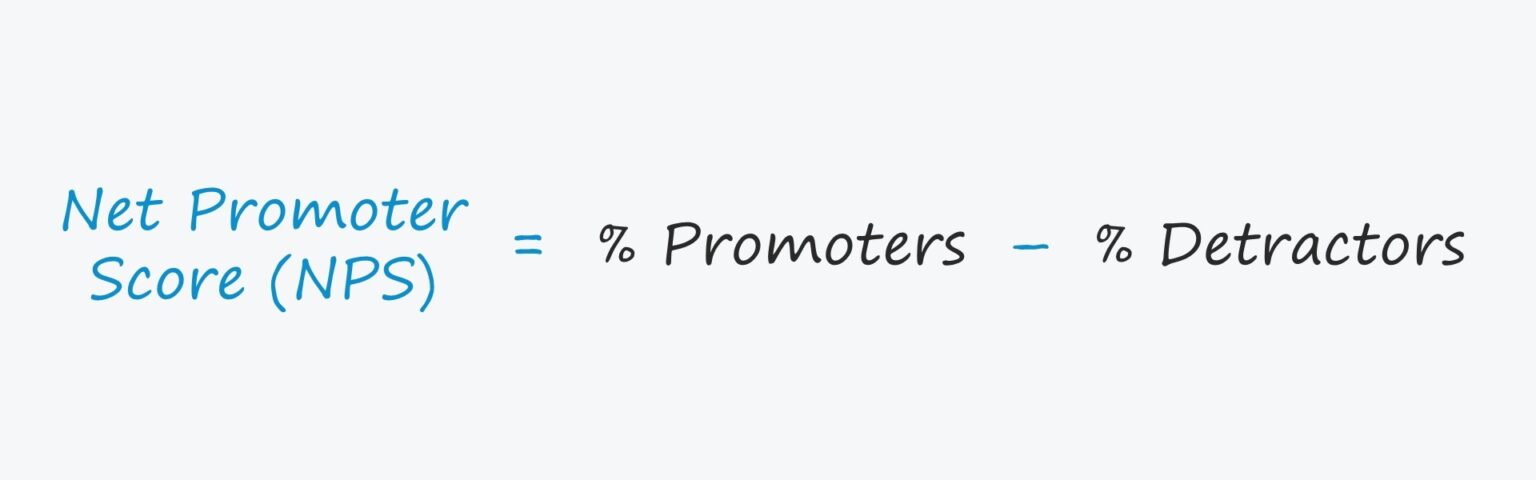
The premise of the net promoter score (NPS) system revolves around the question, “How likely are you to recommend us to a friend or colleague?”
In response, customers are asked to pick a number between one and ten to indicate their willingness to recommend the product/service, which represents the scoring system.
Usually, the results are obtained by conducting customer surveys, either in-person or through virtual means such as emails.
The resulting surveys based on the zero-to-ten scale compile the answers and then separate the scores into three distinct groups.
Clearly, companies would prefer more passives and promoters than detractors. In particular, promoters are essentially free marketers for their brand, i.e. customers that help with “word-of-mouth” marketing.
The detractors are the most likely to churn (i.e. discontinue being a customer), as well as even share their negative experiences with their network or via online reviews.
While focusing on the passives and promoters can provide insights into which customer profile to target going forward, it is still equally important to figure out why certain customers are not pleased with the product/service.
The issue can be as simple as a timing mismatch or a problem that can be easily resolved – but in some cases, the criticism could be instrumental in shaping the future direction of a company and its products/services.
Calculating the net promoter score is a three-step process:
The net promoter score formula subtracts the number of detractors from the number of promoters, which is then divided by the total number of responses.
Both of the inputs are equal to the number attributable to the group divided by the total responses.
In order to express the metric in percentage form, the figure must then be multiplied by 100.
Intentionally, the numerator of the NPS formula excludes the group in the middle – i.e. the passives that picked either 7 or 8 – because these customers are considered “neutral”.
However, passives are included in the total number of responses, which reduces the NPS since the total denominator increases, which causes the NPS to decline.
An alternative approach to calculating the NPS is subtracting the number of detractors from the number of promoters and dividing the resulting figure by the total number of responses.
So, what is the difference between detractors vs. passives vs. promoters?
The following NPS scoring system chart describes each different customer categorization per score range:
| Score | Traits |
|---|---|
|
Detractors (0 to 6) |
|
|
Passives (7 to 8) |
|
|
Promoters (9 to 10) |
|
The score that constitutes a “good” NPS depends on the industry, but around 30% is usually the mid-point that many companies target.
Furthermore, any company with an NPS consistently higher than 30% is most likely an established market leader with low customer churn, often due to making the proper adjustments to their product and service offerings over time.
More specifically, top companies such as Apple, Amazon, and Netflix tend to possess an NPS between 50% to 65%. It is critical for companies to seek feedback continuously – both positive and negative – from their customer base.
In practice, tracking the NPS is useful as an internal tool for measuring progress over time, but it can also be used for comparisons to industry peers.
However, it is important to ensure that the NPS is compared to truly similar companies (i.e. those that are as close to “apples-to-apples” as possible) and confirm that the peer group comprises companies at a similar point of maturity.
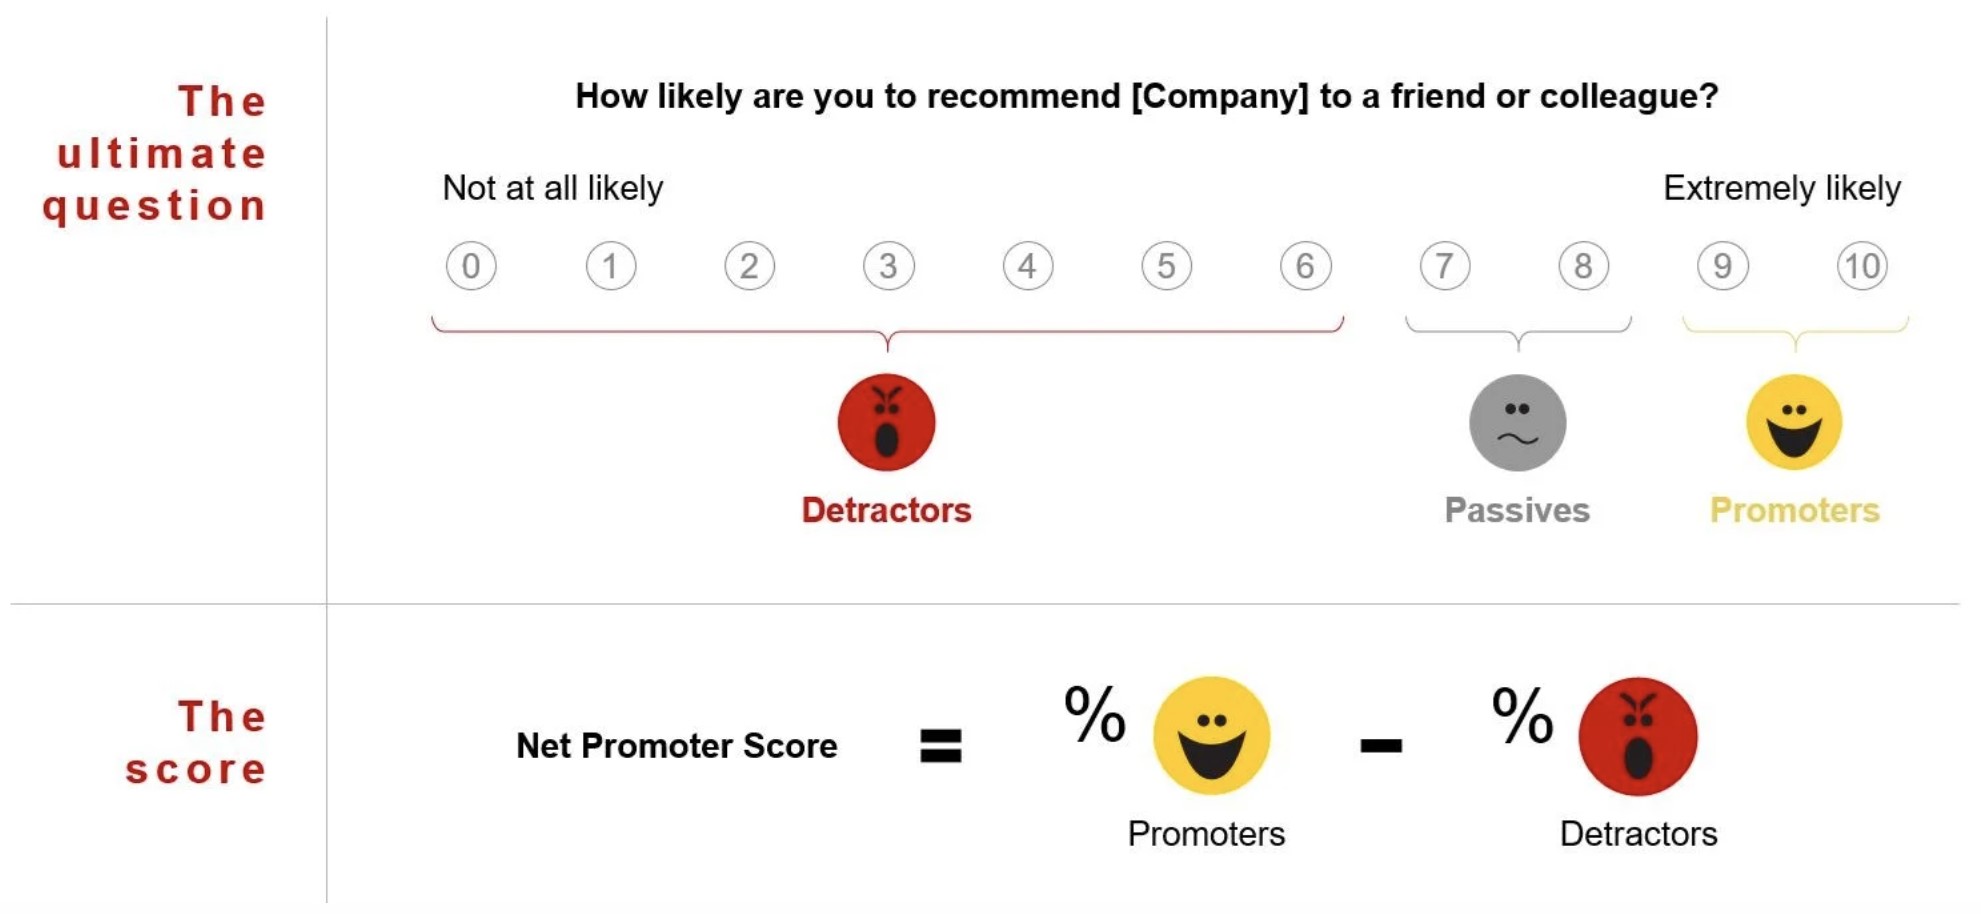
NPS Measurement Scale (Source: Bain)
We’ll now move to a modeling exercise, which you can access by filling out the form below.


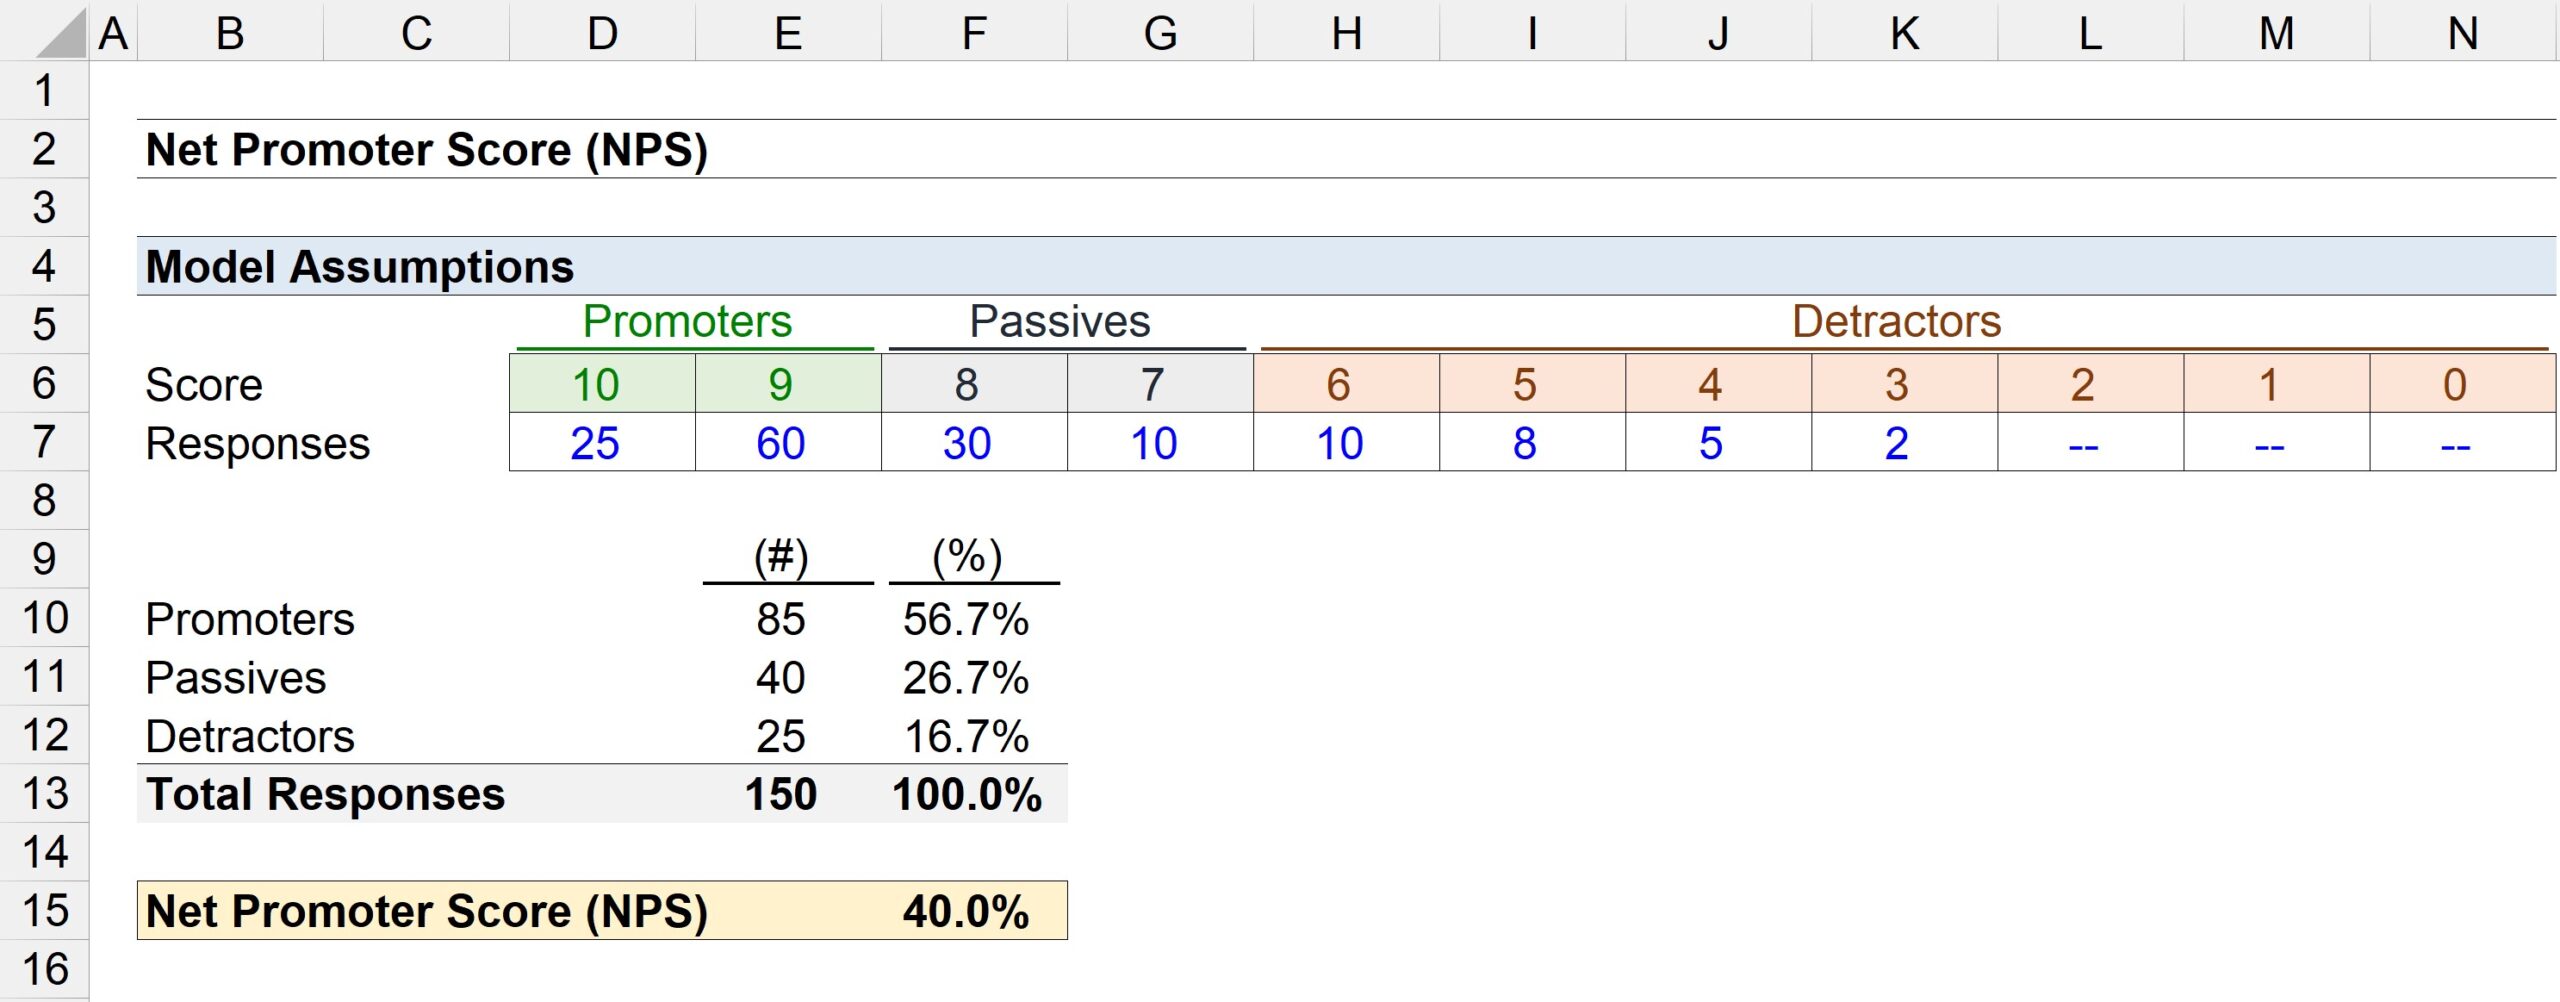
Suppose we are calculating the net promoter score (NPS) of a company using the following scores collected from customer surveys.
The next step is to separate them into three distinct groups, and we count the appropriate responses for each:
150 customer responses in total were obtained throughout the survey process, and we must divide each group’s responses by the total to get the necessary inputs to calculate the NPS.
In the final step, we can subtract the percentage of detractors from the percentage of promoters to arrive at a net promoter score of 40%, or 40.

Enroll in The Premium Package: Learn Financial Statement Modeling, DCF, M&A, LBO and Comps. The same training program used at top investment banks.


No comments yet.