GMV, or “Gross Merchandise Value”, refers to the total order value of all merchandise sold across a given time period. In particular, GMV is a critical KPI most often tracked in the eCommerce industry and customer-to-customer (C2C) marketplaces.
Generate Key Takeaways
How to Calculate Gross Merchandise Value (GMV)
The GMV, an abbreviation for "Gross Merchandise Value", is defined as the total volume of revenue generated across a given period of time.
In particular, the gross merchandise value (GMV) – often used interchangeably with the term "Gross Merchandise Volume" – is an important key performance indicator (KPI) to track for eCommerce platforms such as:
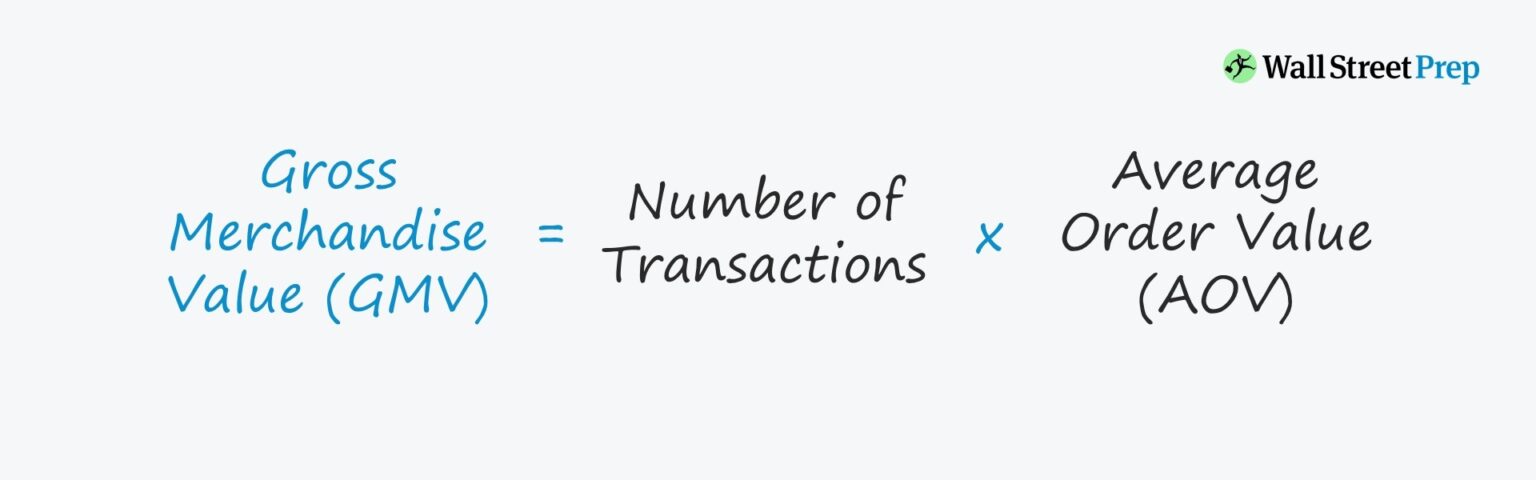
Calculating the gross merchandise value (GMV) metric consists of multiplying the number of total transactions by the average order value (AOV).
Total Number of Transactions → The total number of customer orders received and processed by a company over a given period.
Average Order Value (AOV) → The average order value (AOV) estimates the average monetary value per transaction. The AOV metric can be determined by dividing the total revenue from all orders divided by the total number of transactions.
GMV Formula
The formula to calculate the gross merchandise value (GMV) is the product of the number of transactions and the average order value (AOV).
Gross Merchandise Value (GMV) = Number of Transactions × Average Order Value (AOV)
The total number of transactions is self-explanatory, while the average order value (AOV) is the amount spent on average per customer order.
Average Order Value (AOV) = Total Order Value ÷ Total Number of Orders
For a more granular calculation of GMV, the sale price of goods – separated by each product segment – can be used instead of the average order value (AOV).
Continue Reading Below
The Wharton Online & Wall Street Prep Applied Value Investing Certificate Program
Learn how institutional investors identify high-potential undervalued stocks. Enrollment is open for the upcoming cohort.
The gross merchandise value (GMV) metric can help measure the growth of a company and gauge the prevailing market demand for a specific product.
By monitoring the changes in GMV on a month-over-month (M/M) or year-over-year (YoY) basis, the current financial state of a company can be analyzed.
In addition, the insights derived can be utilized to create more accurate pro forma projection models based on the implied growth trajectory, i.e. estimate the market traction using historical transaction data.
The shortcomings of the gross merchandise value (GMV) are similar to gross revenue, as opposed to net revenue, because the amount is prior to any deductions related to fees and other expenses, such as the following:
Discounts
Taxes
Delivery Fees
Product Returns
Additional Side Costs (e.g. Maintenance Per Warranty)
Therefore, since the gross merchandise value does NOT factor in any returns and discounts, the metric requires more in-depth diligence as GMV is a “raw” metric.
While GMV can provide insights regarding the revenue potential of the company, it fails to depict the profitability of the company.
In other words, the amount of revenue generated that flows down and reaches net income (i.e. “bottom line”) is left unknown.
Furthermore, gross merchandise value as a standalone metric is not too practical as the value fails to give information about:
Repeat Customers → Recurring Purchases vs. One-Time Purchases
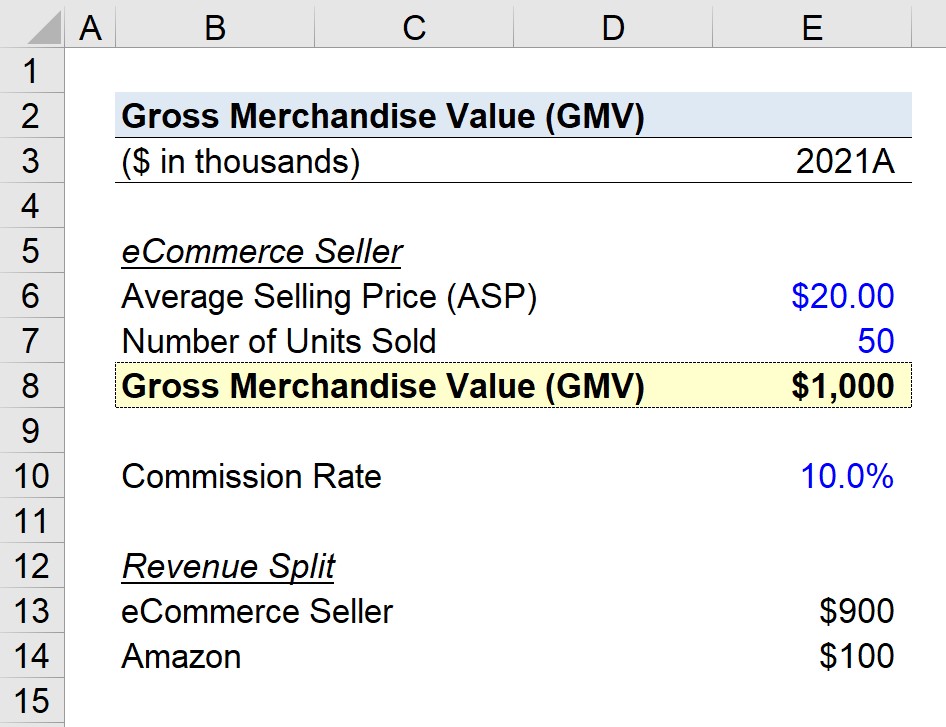
If the company sells 50k shirts in 2021, the GMV is the product of the average selling price (ASP) and the number of units sold, which comes out to $1 million.
Number of Units Sold = 50,000
Gross Merchandise Value (GMV) = $20 × 50,000 = $1 million
In conclusion, the point mentioned earlier regarding the fact that the gross merchandise value (GMV) is part of gross revenue, rather than net revenue. The revenue split is as follows:





No comments yet.