What is Levered IRR?
Levered IRR analyzes the expected rate of return on an annualized basis for investments where leverage is part of the transaction structure.

Levered IRR analyzes the expected rate of return on an annualized basis for investments where leverage is part of the transaction structure.
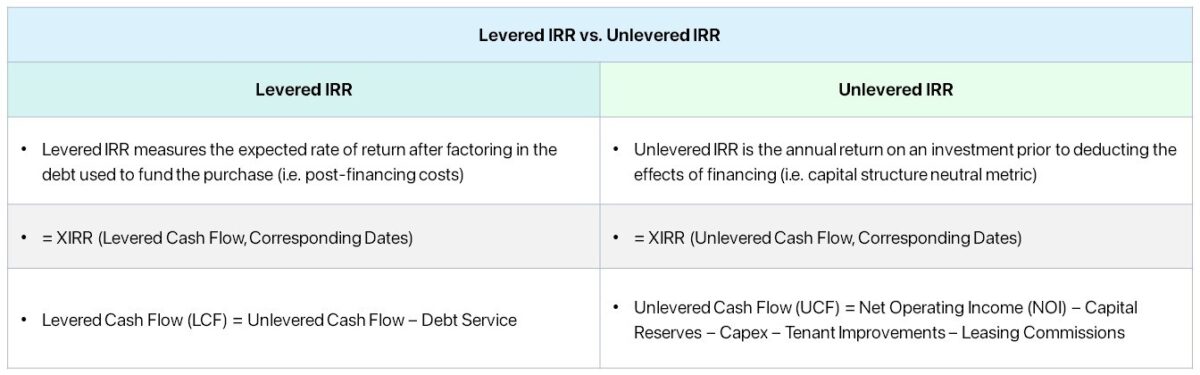
The levered IRR, or “equity IRR”, is a method to determine the potential yield earned on a real estate investment, whereby the return factors in the effects of leverage.
In financing, the term "leverage” refers to the reliance on debt to fund the purchase price of an investment – i.e. the act of borrowing funds from lenders such as banks or institutional investors – to reduce the required equity contribution.
The cash flow generated by the investment property remains relatively identical regardless of the financing structure, yet the equity contribution from the investor is lower if debt is used to finance the transaction.
Hence, the levered IRR of an investment property exceeds the unlevered IRR in practically all cases.
The greater the spread between the levered IRR and unlevered IRR, the more reliant the anticipated investment returns are on leverage.
The drawback to leverage is the potential downside risk created by placing a debt burden on the property.
In effect, the credit risk of the investment property rises – in particular, a greater proportion of debt coincides with a higher risk of default, such as missing a required mortgage payment or periodic interest obligation.


The real estate market, especially for commercial properties, is a highly levered asset class, where it is common for the funding structure of real estate projects to consist of debt financing.
Most investments in the commercial real estate (CRE) market are financed partially by debt capital because the purchase prices are set higher, and the potential to earn an outsized return is much greater if leverage is used.
The less equity required to be contributed by the real estate investor, the higher the internal rate of return (IRR) – all else being equal.
The investment returns in the commercial real estate (CRE) market stem primarily from two sources:
Level up your real estate investing career. Enrollment is open for the upcoming Wharton Certificate Program cohort.
The internal rate of return (IRR) measures the percent yield received on an investment on an annualized basis.
The formula to calculate the levered IRR in Excel is as follows.
The internal rate of return (IRR) is determined using the “XIRR” function in Excel, which comprises two arrays:
While the mechanics of computing IRR in Excel are practically the same for the levered and unlevered IRR, understanding the distinction between unlevered cash flow and levered cash flow is critical.
The unlevered cash flow of a real estate property uses the remaining cash before deducting debt payments, such as interest or mortgage payments.
The unlevered cash flow is the net cash flow of a property before financing items (i.e. capital structure neutral).
Since the unlevered cash flow reflects only the operating activities of the property, the metric facilitates comparisons between the operating performance of comparable investment properties, in which only the core operating activities are considered.
Where:
Unlike unlevered cash flow, the levered cash flow metric reflects the net cash flow of a property post-financing.
To shift from the unlevered cash flow to the levered cash flow metric, the subsequent adjustment consists of deducting debt services, such as the annual mortgage payment and interest.
Where:
Once the debt service is subtracted from unlevered cash flow to arrive at the levered cash flow of a property, we are left with the post-financing, residual net cash flow attributable to only equity stakeholders.
Therefore, the levered IRR is the rate of return after considering the leverage used to finance the original purchase, whereas the unlevered IRR represents the return on an investment without debt financing (i.e. independent of the capitalization).
If sufficiently meeting the minimum target return is contingent on the substantial use of leverage, the investment opportunity may be considered as riskier and might not be worth pursuing.
Simply put, using debt as a primary strategy to create value by itself is far riskier relative to plans to facilitate growth in net operating income (NOI) and capital appreciation from identifying favorable market trends or implementing improvements to properties.
We’ll now move to a modeling exercise, which you can access by filling out the form below.

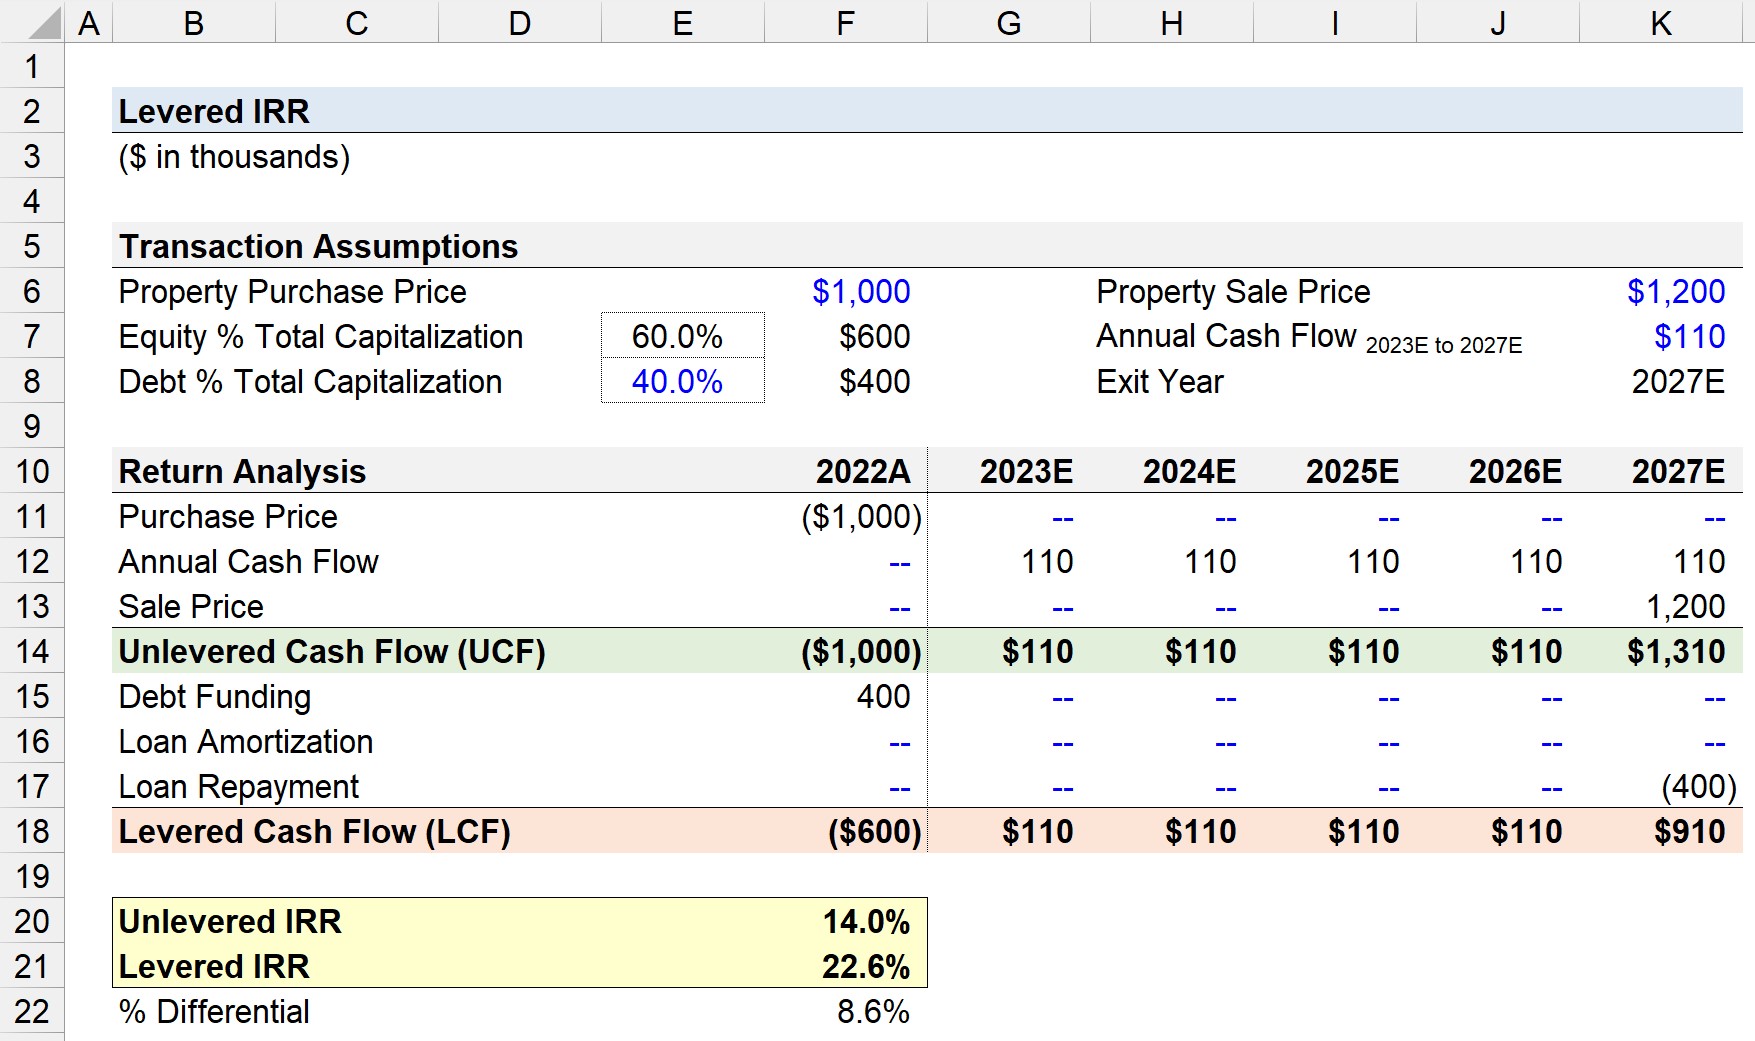
Suppose a real estate investor acquired a property at a purchase price of $1 million, where the transaction was financed using 60% equity and 40% debt.
The closing date of the acquisition was the end of 2022 (12/31/2022). Starting in 2023, the first year in the five-year hold period, the property is projected to generate $110k in annual cash flow from 2023 to 2027.
Further, we'll assume the investment will be sold at the end of 2027 at a sale price of $1.2 million.
In the first part of our return analysis schedule, we'll compute the unlevered cash flow (UCF) in each period.
The sum of the three items results in the unlevered cash flow (UCF) for each year, which comes out to the following:
From the unlevered cash flow (UCF) section, we'll then adjust for the three debt service items.
The sum of the unlevered cash flow (UCF) per period and the three items outlined above results in the levered cash flow for our forecast.
Using the XIRR function in Excel, we can determine the unlevered IRR and levered IRR.
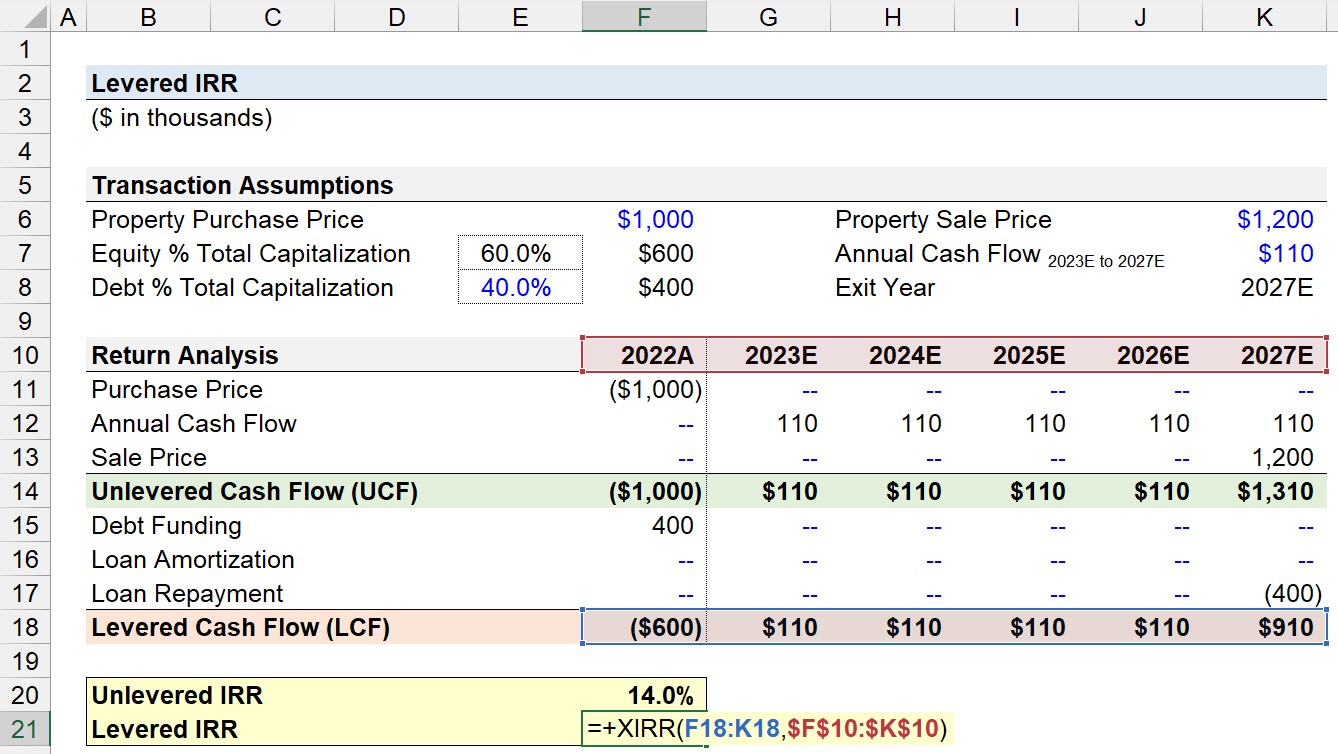
The unlevered IRR on the property investment comes out to 14.0%, while the levered IRR is 22.6%, reflecting the positive impact that leverage can have on the returns earned on an investment.


No comments yet.