What is SG&A Margin?
The SG&A Margin is the ratio between a company’s selling, general and administrative costs and net revenue in a given period, expressed as a percentage.

The SG&A Margin is the ratio between a company’s selling, general and administrative costs and net revenue in a given period, expressed as a percentage.
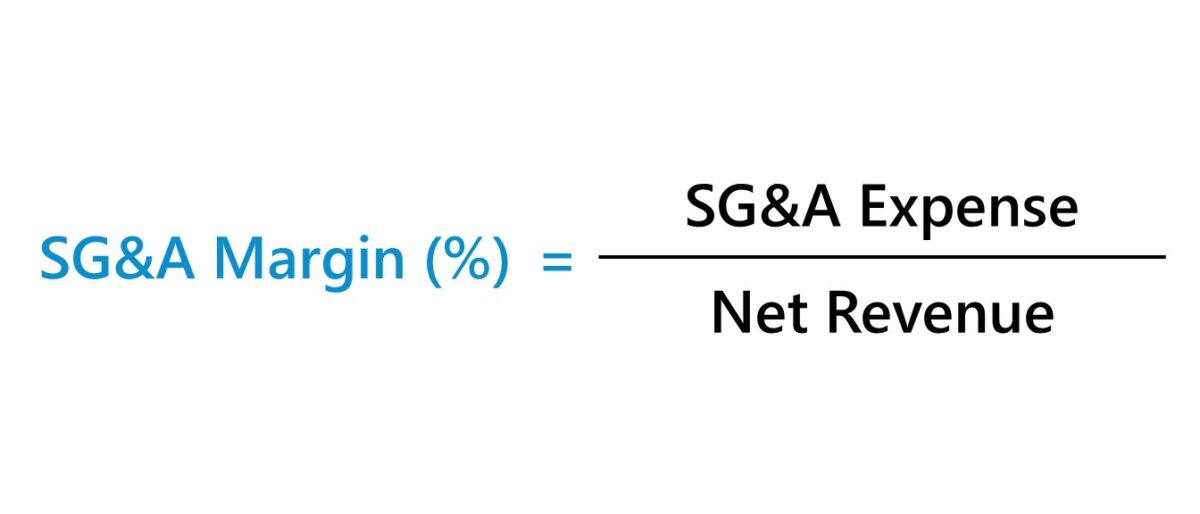
The SG&A margin describes the relationship between a company’s selling, general and administrative costs and the amount of revenue generated in the corresponding period.
On the income statement, the first adjustment to net revenue – i.e. the “top line” – is the cost of goods sold (COGS) line item, which captures the operating costs incurred that are directly related to a company’s efforts to generate revenue.
From the gross profit line item, which is equal to revenue minus COGS, the next adjustment is for indirect operating costs, or SG&A.
Upon deducting a company’s SG&A from gross profit – assuming there are no other operating expenses – the resulting profit metric is operating income (EBIT).
Unlike a company’s COGS, the incurred SG&A expense is not directly tied to its revenue generation. Instead, SG&A represents the indirect costs that stem from day-to-day operations, such as purchasing office supplies, overhead costs, and rent.
The process of calculating a company’s SG&A margin can be broken up into three steps:
The formula to calculate the SG&A margin is as follows.
In order for the SG&A margin to be meaningful, the company’s operating income (EBIT) must be positive, i.e. there are remaining profits after deducting COGS and SG&A from revenue.
In addition, a negative sign must be placed in front of the formula if SG&A was entered as a negative integer as part of the sign convention used in the financial model; otherwise, the returned margin will be a negative percentage.
Conceptually, the SG&A ratio measures the percentage of each dollar of revenue earned by a company allocated to SG&A.
For instance, a 25% SG&A ratio implies that for each dollar of revenue brought in, a quarter of it is spent on SG&A expenses.
As a general rule, the lower the SG&A margin, the better. However, comparisons must be made relative to the industry within which the company operates, as the average benchmark varies significantly by industry.
The SG&A margin ratio can be informative in terms of understanding a company's cost structure.
That said, the SG&A margin ratio can be a useful tool for understanding where a company’s revenue is spent, i.e. the concentration of costs in the overall business model, which ultimately determines a company's profitability.
The SG&A margin is calculated by dividing a company’s SG&A by its revenue. In contrast, the operating profit margin (or “EBIT margin”) is calculated by dividing a company’s operating income by revenue.
Where:
Therefore, the SG&A margin and operating profit margin are inversely related.
For forecasting, the most common method is to project SG&A expense as a percentage of revenue.
The historical SG&A margin is first calculated before assessing the trend of the ratio.
If SG&A is the only operating expense, the operating profit margin could technically be used as the driver of the projection. However, directly projecting EBIT is seldom done in practice and is generally not recommended, especially for more complex models.
We’ll now move on to a modeling exercise, which you can access by filling out the form below.


Suppose you’re tasked with building a five-year forecast of a company’s SG&A and operating profit (EBIT) using the following historical income statement data.
| Historical Data | 2021A | 2022A |
|---|---|---|
| Revenue | $200 million | $250 million |
| Less: COGS | (80 million) | (100 million) |
| Gross Profit | $120 million | $150 million |
| Less: SG&A | ($50 million) | ($60 million) |
| EBIT | $70 million | $90 million |
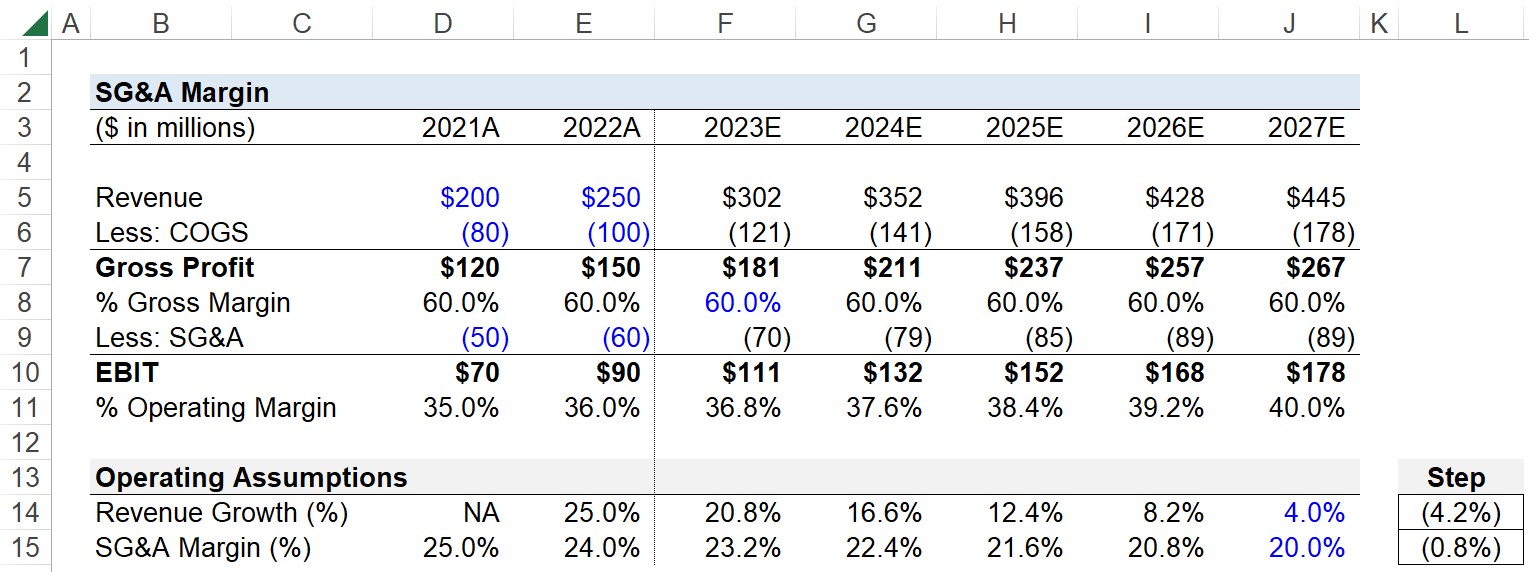
Historically, the company’s gross margin was 60% in both periods, while its SG&A margin was 25% and 24% in 2021 and 2022, respectively.
For our SG&A margin assumption, we’ll assume that given the recent decline in the ratio (and references to comparable mature companies), the SG&A margin in 2027 will be 20%.
In the next section, we’ll project our company’s SG&A expense (and operating margin) over the five-year forecast period.
For our revenue assumptions, we’ll assume the growth rate will decline to 4.0% by the end of 2027, while the gross margin remains fixed at 60% throughout the forecast.
Using a step function, we’ll enter our final year SG&A margin in our operating assumptions section, so that the percentage declines in equal increments starting from the end of 2022.
Since the SG&A margin is declining, the impact on EBIT (and thus the company’s operating profit margin) is positive.
For each forecast period, we’ll multiply our SG&A margin assumption by the projected revenue in the same period, which results in our projected SG&A expense amounts.
The EBIT line item is equal to the gross profit subtracted by SG&A, so we’ve indirectly forecasted our company’s EBIT, which can be divided by revenue, to arrive at the operating profit margin for each period.
In conclusion, we can see our company’s SG&A margin declined from 24% initially to 20% by the end of the forecast, whereas the operating profit margin increased from 36% to 40% across the same time horizon.

Enroll in The Premium Package: Learn Financial Statement Modeling, DCF, M&A, LBO and Comps. The same training program used at top investment banks.


No comments yet.