What is COGS Margin?
The COGS Margin is the ratio between a company’s cost of goods sold and revenue, expressed in the form of a percentage.

The COGS Margin is the ratio between a company’s cost of goods sold and revenue, expressed in the form of a percentage.
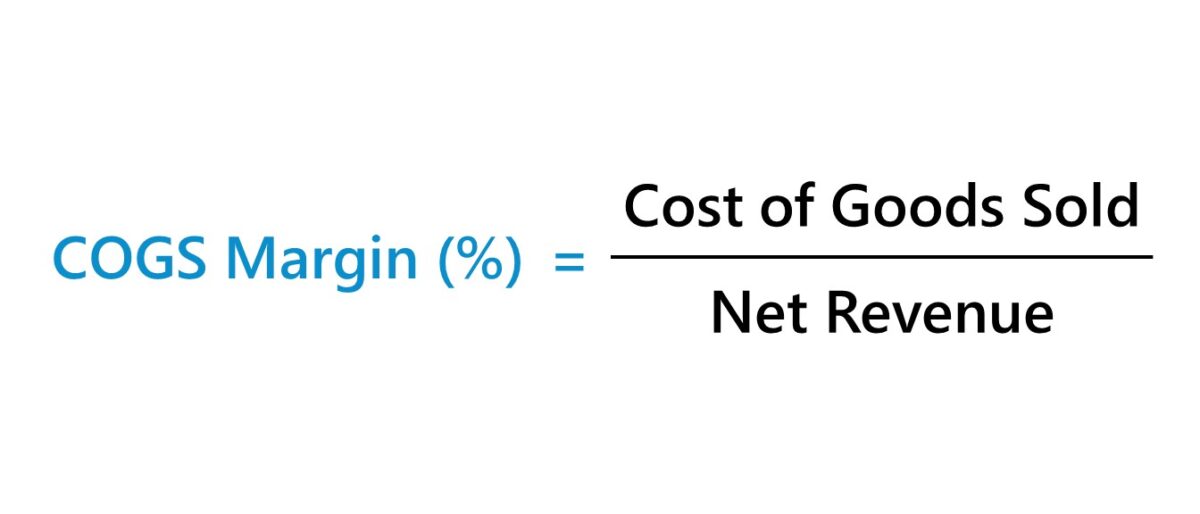
The COGS margin describes the relationship between a company’s cost of goods sold (COGS) and revenue.
On the income statement, the revenue (“top line”) and cost of goods sold (COGS) line item – or “cost of sales” – are each found at the very top. The COGS of a company represent the first deduction from revenue, which results in the gross profit metric.
The higher the COGS margin, the lower the gross margin (and vice versa).
Calculating a company’s COGS margin is a three-step process:
The company must be gross margin positive – i.e. the recorded COGS must not exceed revenue – in order for the COGS margin to be applicable; otherwise, the percentage margin is not meaningful ("NM").
The formula to calculate the COGS margin is as follows.
If the cost of goods sold (COGS) line item was entered as a negative integer – as part of the sign convention used in the model’s sign convention – a negative sign must be placed at the front of the equation, or else the resulting percentage will be negative.
The COGS margin is calculated by dividing a company’s cost of goods sold (COGS) by its revenue, while the gross margin is calculated by dividing a company’s gross profit by revenue.
Where:
Thus, there is an inverse relationship between the COGS margin and gross margin.
On a forward-looking basis, a company’s cost of goods sold (COGS) can be forecasted using two methods:
Conceptually, the COGS margin ratio represents the percentage of each dollar of revenue generated that is spent on cost of goods sold (COGS).
For example, a 50% ratio implies that for each dollar of revenue earned, half of that revenue is spent on COGS.
Since the COGS margin compares a company’s cost of goods sold (COGS) to its net revenue, the financial ratio provides insights into the cost structure of the company.
Therefore, the COGS margin is useful for understanding where a company’s costs are concentrated in its business model, which can consist of cost of goods (COGS), operating expenses (SG&A, R&D), and non-operating expenses (e.g. interest expense).
For example, a company operating in a service-oriented industry such as consulting should expect most of its costs to be concentrated in the cost of goods sold line item, as labor is the primary driver of revenue.
In contrast, a company in a capital-intensive industry like manufacturing would have more of its costs concentrated in its operating expenses line item, i.e. significant amount of indirect costs are incurred related to maintenance of the facility, safety measures, etc.
We’ll now move on to a modeling exercise, which you can access by filling out the form below.


Suppose you’re tasked with creating a five-year projection model of a company’s cost of goods sold (COGS) and gross profit given the following historical income statement data.
| Historical Data | 2021A | 2022A |
|---|---|---|
| Revenue | $100 million | $125 million |
| Less: COGS | (50 million) | (60 million) |
| Gross Profit | $50 million | $65 million |
Since we need a historical point of reference upon which to base our forward-looking COGS margin assumptions, the first step is to calculate the COGS margin in the trailing two years.
The historical COGS margin is 50% and 48% in 2021 and 2022, respectively.
Given the recent downward trend from 50% to 48%, the company seems to be becoming more profitable at the gross margin level.
With our calculation of the historical COGS margin complete, we’ll now forecast the company’s cost of goods sold across the five-year projection period.
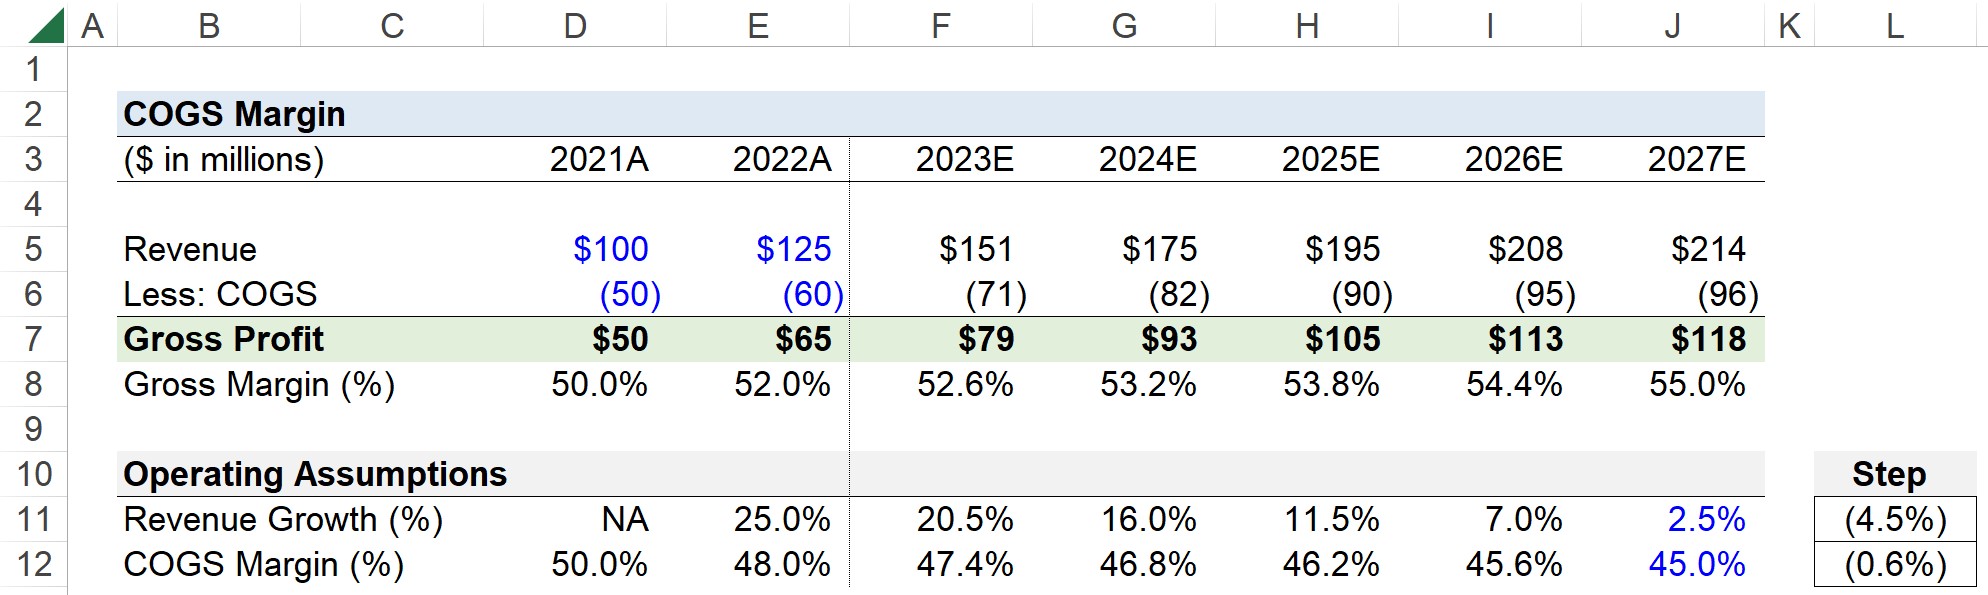
Using a step function, we’ll set the revenue growth rate in 2027 at 2.5%, whereas the COGS margin is assumed to reach 45% by the end of the forecast.
Because the COGS margin is declining, the implication is that the gross margin (%) increases.
For each period, we’ll multiply the COGS margin assumption by the projected revenue to determine the cost of goods sold as recognized in the period.
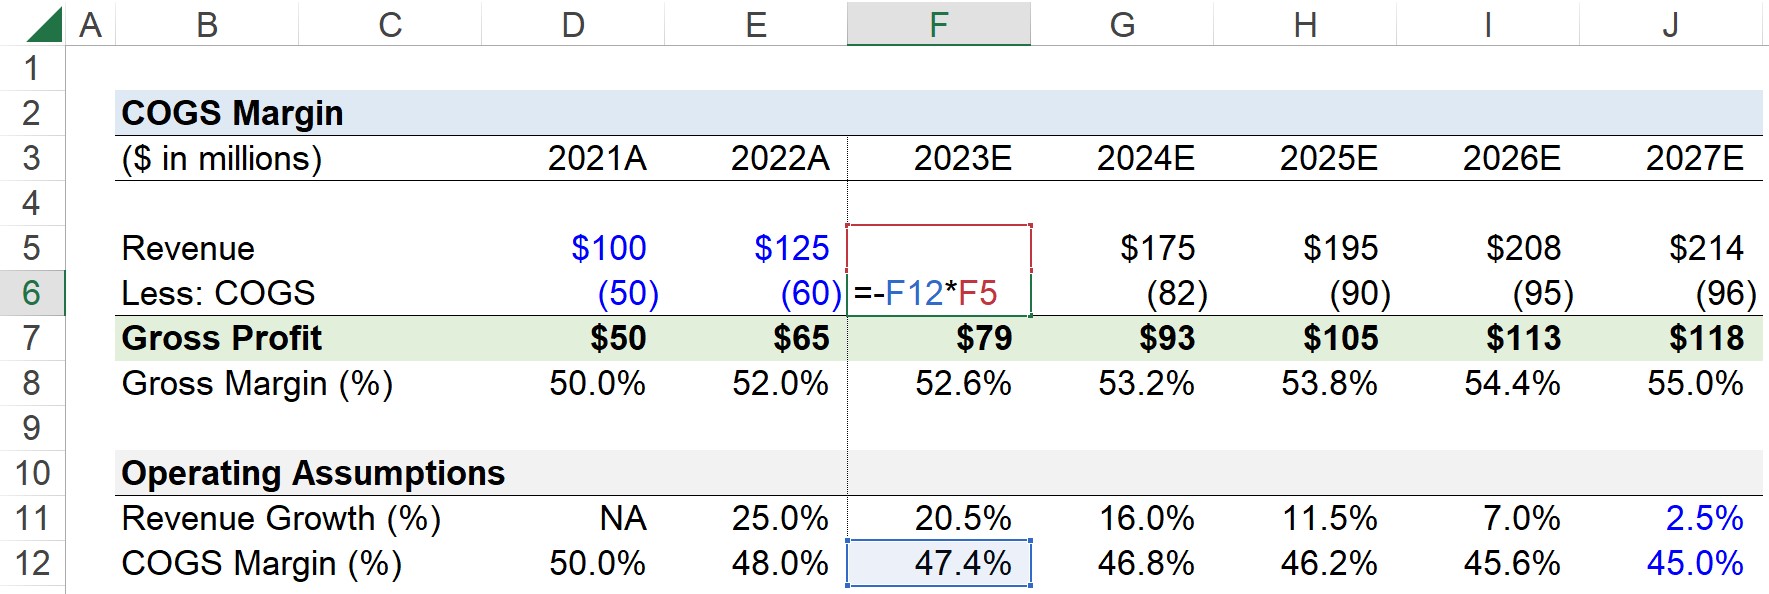
The gross profit line item can be calculated by subtracting COGS from revenue, while the gross margin can be calculated by dividing the gross profit by revenue.
Once repeated for the entire forecast, we can observe our COGS margin declines from 48% in 2022 to 45% by the end of 2027, whereas our gross margin expands from 52% to 55% across the same timeframe.

Enroll in The Premium Package: Learn Financial Statement Modeling, DCF, M&A, LBO and Comps. The same training program used at top investment banks.


No comments yet.