What is Break-Even Point?
The Break-Even Point (BEP) is the inflection point at which the revenue output of a company is equal to its total costs and starts to generate a profit.

The Break-Even Point (BEP) is the inflection point at which the revenue output of a company is equal to its total costs and starts to generate a profit.
There is no net loss or gain at the break-even point (BEP), but the company is now operating at a profit from that point onward.
For all business owners, particularly during the earlier stages of a business, one of the most crucial questions to answer is: “When will my business break even?”
Businesses share the similar core objective of eventually becoming profitable in order to continue operating. Otherwise, the business will need to wind-down since the current business model is not sustainable.
An unprofitable business eventually runs out of cash on hand, and its operations can no longer be sustained (e.g., compensating employees, purchasing inventory, paying office rent on time).
By understanding the required output to break even, a company can set revenue targets accordingly, as well as adjust its business strategy such as the pricing of its products/services and how it chooses to allocate its capital.
The steps to calculate the break-even point are as follows:
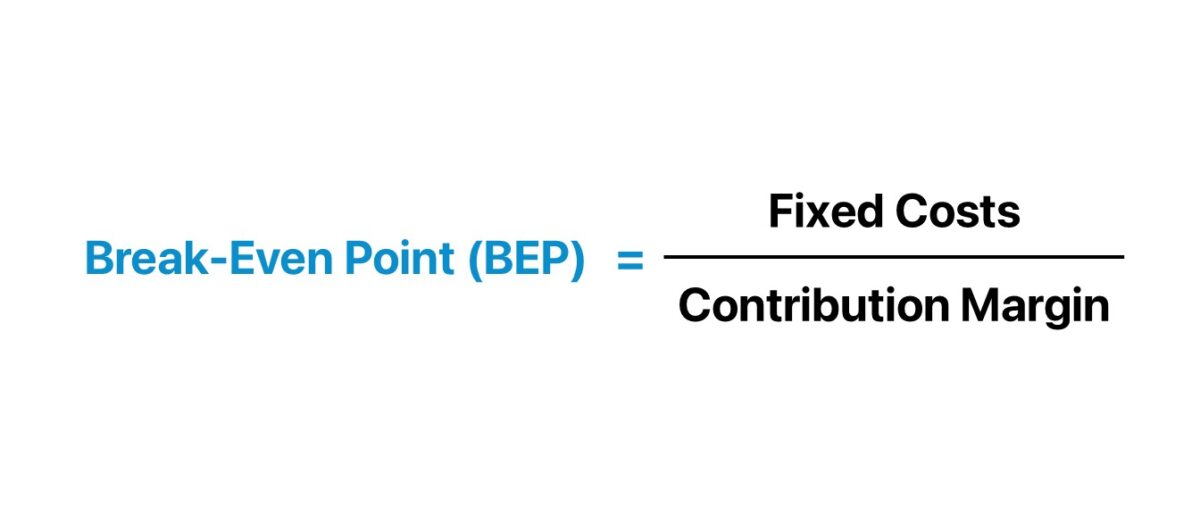
The formula for calculating the break-even point (BEP) involves taking the total fixed costs and dividing the amount by the contribution margin per unit.
The contribution margin is the selling price per unit minus the variable costs per unit, and represents the amount of revenue remaining after meeting all the associated variable costs accumulated to generate that revenue.
If a company has reached its break-even point, the company is operating at neither a net loss nor a net gain (i.e. “broken even”).
The incremental revenue beyond the break-even point (BEP) contributes toward the accumulation of more profits for the company.
Conducting a break-even analysis is a prerequisite to setting prices appropriately, establishing clear and logical sales target goals, and identifying weaknesses in the current state of the business model that could benefit from improvements (e.g., sales tactics and marketing strategies).
Furthermore, established companies with a diverse portfolio of product/service offerings can estimate the break-even point on an individualized product-level basis to assess whether adding a certain product would be economically viable.
In effect, the insights derived from performing break-even analysis enables a company's management team to set more concrete sales goals since a specific number to target was determined.
Learn how institutional investors identify high-potential undervalued stocks. Enrollment is open for the upcoming cohort.
For example, if a company has $10,000 in fixed costs per month, and their product has an average selling price (ASP) of $100, and the variable cost is $20 for each product, that comes out to a contribution margin per unit of $80.
Then, by dividing $10k in fixed costs by the $80 contribution margin, we arrive at approximately 125 units as the break-even point, meaning that if the company sells 125 units of its product, it'll have made $0 in net profit.
Or, if using Excel, the break-even point can be calculated using the “Goal Seek” function.
After entering the end result being solved for (i.e., the net profit of zero), the tool determines the value of the variable (i.e., the number of units that must be sold) that makes the equation true.
We’ll now move to a modeling exercise, which you can access by filling out the form below.


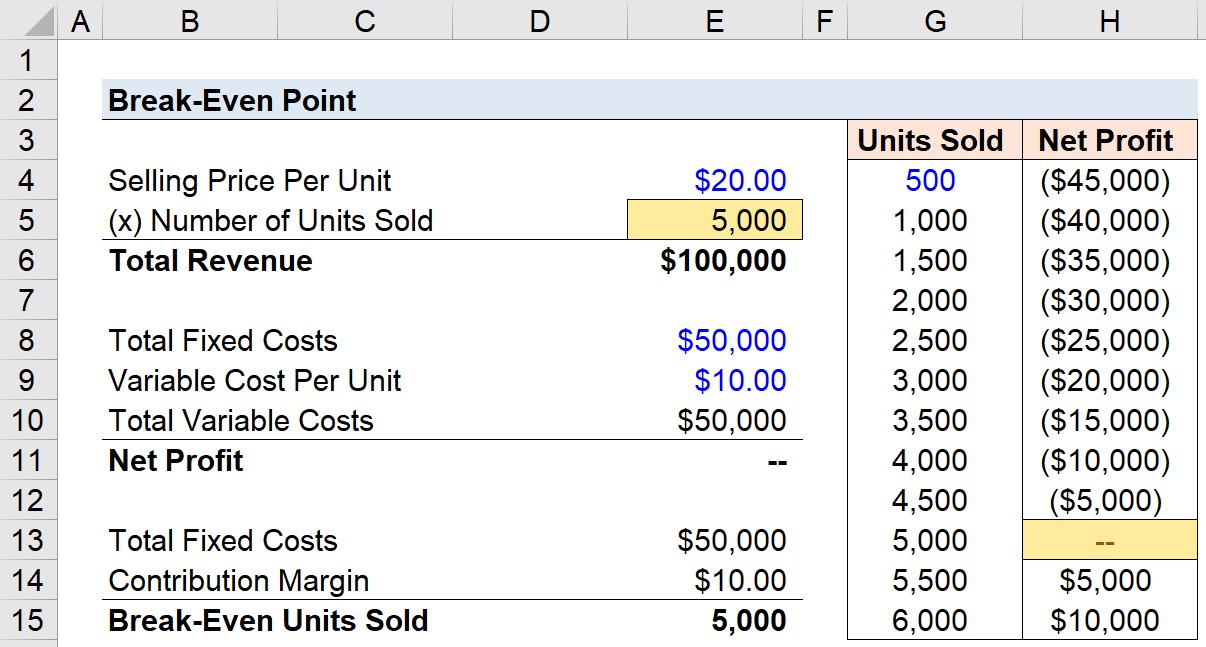
Let’s say that we have a company that sells products priced at $20.00 per unit, so revenue will be equal to the number of units sold multiplied by the $20.00 price tag.
In terms of its cost structure, the company has fixed costs (i.e., constant regardless of production volume) that amounts to $50k per year. Recall, fixed costs are independent of the sales volume for the given period, and include costs such as the monthly rent, the base employee salaries, and insurance.
Moving onto our final assumption, the variable costs directly associated with the production of the products being sold are $10.00.
In contrast to fixed costs, variable costs increase (or decrease) based on the number of units sold. If customer demand and sales are higher for the company in a certain period, its variable costs will also move in the same direction and increase (and vice versa).
The total variable costs will therefore be equal to the variable cost per unit of $10.00 multiplied by the number of units sold.
We now have the assumptions in place to use the “Goal Seek” function in Excel (Alt ➝ A ➝ W ➝ G).
Upon doing so, the number of units sold cell changes to 5,000, and our net profit is equal to zero.
Quantifying the required number of units to be sold to have a net profit of zero was our intended goal, which in this particular scenario, the company must sell 5k units of its products to break even and start to generate a profit from its operations.
As we can see from the sensitivity table, the company operates at a loss until it begins to sell products in quantities in excess of 5k. For instance, if the company sells 5.5k products, its net profit is $5k.
Alternatively, the break-even point can also be calculated by dividing the fixed costs by the contribution margin.
The total fixed costs are $50k, and the contribution margin ($) is the difference between the selling price per unit and the variable cost per unit. So, after deducting $10.00 from $20.00, the contribution margin comes out to $10.00.
In conclusion, just like the output for the goal seek approach in Excel, the implied units needed to be sold for the company to break even come out to 5k.

Well understand
kindly would like to know how to calculate the break even points given the variable cost,fixed cost and the net profit only
Hi, Nicholas,
You would not be able to calculate the break-even quantity of units unless you have revenue and variable cost per unit.
Brad
what are the formulas for break-even variable cost and break-even fixed cost?
Hi, Hamish,
Do you mean the $ value of breakeven, not the number of units? For breakeven variable costs, if fixed costs are truly fixed and the units are given, you would use: revenue per unit – fixed costs / units. Fixed cost breakeven if variable costs per unit and units are given would be: (revenue per unit – fixed cost per unit) * units.
BB
Realy appreciated
You’re welcome!
what are the formulas of BEP
Hi, Abraham,
Do you mean the $ value of breakeven? For breakeven variable costs, if fixed costs are truly fixed and the units are given, you would use: revenue per unit – fixed costs / units. Fixed cost breakeven if variable costs per unit and units are given would be: (revenue per unit – fixed cost per unit) * units.
BB
Profit when sale are 40000
Fixed exp 8000
BEP 20000
Hi, Shadab,
What we mean here by BEP is the number of units that must be sold to just cover fixed costs so you would need to specify the revenue and variable costs per unit in order to know the BEP for fixed costs of 8000.
BB
fixed costs are costs required to cover the regular monthly expense. this means it does not include costs of machinery,land building,licence
Hi, Gabeini,
What we mean here by fixed costs are costs that are constant regardless of production volume, so we cannot arbitrarily declare that they only mean ‘regular monthly expenses’ and do not include those other line items, in case those items are constant regardless of volume.
BB
How to find higher or lower bep
Hi, Lozita,
I am not sure what you mean asking how to find higher or lower BEP. The point of this is to find out how many units must be sold to breakeven, and that is based on the gross profit of each unit sold and the amount of fixed expense.
BB
is it possible to use the “average” cost per unit in the BEP formula?
Hi, Erwin,
Yes, you would want to use the average cost per unit along with the average selling price to get the contribution margin per unit in the formula.
BB
How can we quickly construct the sensitivity table in Column G and Column H?
Hi, Angel,
You could do a one-way data table, where you reference net income (E11) as the output variable in H3, and then you specify E5 as the column input (highlighting G3:H15 as your table).
BB
How to find the BREAK EVEN POINT IN UNIT
IF THE GIVEN IS HERE
SALE – $1,100,000
TOTAL FIXED COST – 280,000
TOTAL VARIABLE COST – 660,000
UNIT PRICE – 40
WHAT IS THE BREAK EVEN POINT IN UNIT
Hi, Conan,
You would need 17,500 units to break even (1,100,000 / $40 = 27,500; 660,000 / 27,500 = $24 cost per unit; $40 – 24 = $16 profit per unit; 280,000 / $16 = 17,500 units to break even).
BB
if i have
Total units to be produced = 4,500
Cost per unit = $12.40
Unit selling price = $21.98
Total Costs = $
BEP =
how do i solve this problem
Hi, Ivana,
To calculate BEP, you also need the amount of fixed costs that needs to be covered by the break-even units sold.
BB
No, need fixed cost
Hi, Alihamza,
Are you saying that Ivana does not need fixed costs, or that she does? The latter is true, she must have fixed costs to calculate break even.
BB
What is break even point sales determine algebrically and graphically
Hi, Sarwar,
I suppose if you wanted to graph it, you would put $ on the y axis and units sold on the x axis, and label the amount of fixed costs on the y axis, then the number of units sold * the income per unit would represent a diagonal line upwards until the break even point was reached.
But the formulas are all in the article, just spend some time trying to understand them.
BB
If i have
Total units to be produced = 12000
Cost per unit = $37.40
Unit selling price = $53.98
Total Fixed Cost $35038
BEP = ?
How do i solve this problem?
What is the contribution Margin
Hi, Hussein,
Take the fixed costs and divide by the difference between the selling price and cost per unit ($16.58), and that will tell you how many units have to be sold to break even.
BB
What about if you have a large sum of products.
Hi, Ashraf,
If you have different products, then different mixes of product volume will be possible to achieve break even. If you can allocate fixed costs to each product line, then you can calculate break even for each of them.
BB
Hi Hussein
Only 2,189.8 units are needed to break even
Hi, Chuol,
Thanks for offering an answer. But how do you arrive at 2189.8, when fixed costs are $35,038 and the difference between selling price and cost per unit is $16.58?
BB
Please help me calculate this
A car has the following costs
It makes 10 cars per week (figures in kshs)
Rent-150000 per week
Salaries -200000 per week
Interest-50000 per week
Materials -3000000 per car
Wages-50000 per car
Powers-25000 per car
Sales commission -250000 per car
If each car is sold for kshs.500000
-what is the break even point?
-how many cars will it take a profit of kshs.1 million?
Hi, Teresa,
If materials, wages, powers, and commission come to 625K total, and the cars are sold for 500K, then it seems like you are losing money on each car.
BB
May you please help me on this question.
A company manufactures and sells a product for $20. The summarised income statement for year end is as follows:
Sales $800 000
Direct Materials (120 000)
Direct wages (160 000)
Variable production O/H (80 000)
Fixed production O/H (100 000)
Fixed Administration O/H (75 000)
Fixed selling and Distribution O/H (60 000)
Net Profit before tax $205 000
Less: Provision for tax (40%) ($ 82 000)
Net profit after tax $123 000
How do I calculate the breakeven point in dollars and in units
Determine the number of units to sell in order to achieve after tax profit of $150 000
Calculate the sales value required to achieve a net profit before tax of 15% of total revenue
Hi, Greg,
You need to add up the fixed expenses, and then divide that by the gross profit per unit (800K/20 for units) to get breakeven # of units. Then figure out how many more units need to be sold to get after-tax profit of $150K (divide that by 1 – tax rate to get pretax profit amount).
BB
if Fixed cost , variable cost and sales amount available in profit and loss account , how to calculate bep amount with out units. with the help of profit and loss account
Hi, Sandes,
You have to have per unit data to calculate the breakeven point for fixed costs.
BB