What is the Net Interest Margin?
The Net Interest Margin (NIM) is a profitability ratio that compares the interest income earned by a bank or financial institution to the interest paid to customers, expressed as a percentage.

The Net Interest Margin (NIM) is a profitability ratio that compares the interest income earned by a bank or financial institution to the interest paid to customers, expressed as a percentage.
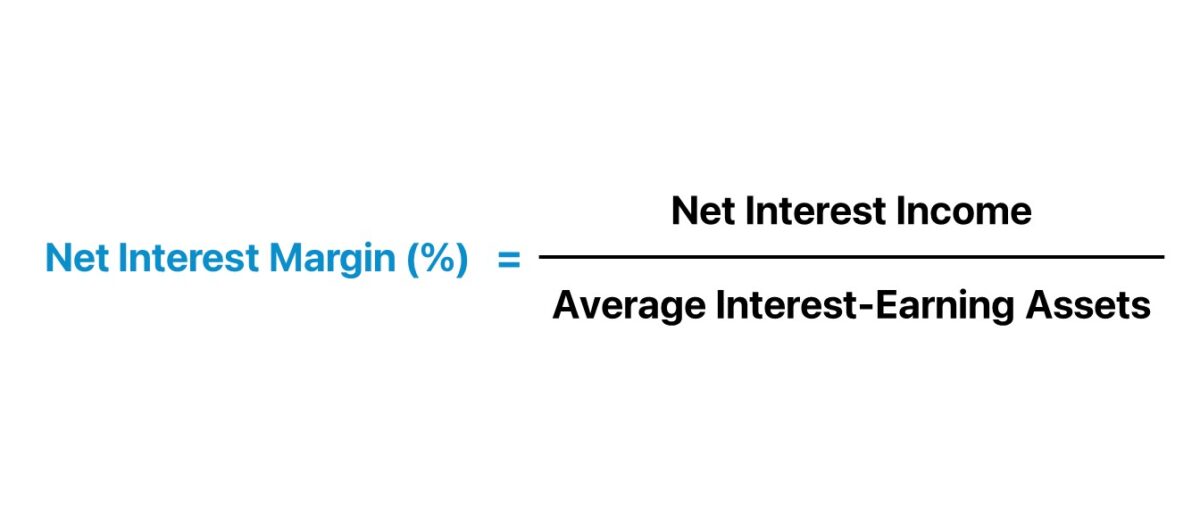
The net interest margin (NIM) is a measure of profitability in the financial sector, which comprises financial institutions such as commercial and corporate banks and other lenders.
The lending business model of a bank or financial institution is oriented around structuring debt products, such as loans and bonds, to consumer or corporate borrowers in exchange for periodic interest payments across the borrowing term and the repayment of the original debt principal at maturity.
There are two parts to the structure of the traditional lending business model:
In terms of the lending portfolio of a bank, interest-earning assets include primarily bank loans, mortgages, and other financing products.
In contrast, the interest-bearing liabilities within the portfolio consist of customer deposits and borrowings from other banks.
The difference between the interest income and interest expense of a bank or financial institution results in the net interest income (NII) metric.
The net interest income (NII) is a comparison between the income generated from interest-earning assets to the interest expense burden incurred from interest-bearing liabilities.
Conceptually, the net interest margin (NIM) reflects the percent net interest “spread” on the loan portfolio.
The net interest income (NII) must be a positive value – where interest income exceeds interest expense – for the lending model to be sustainable over the long term.
The step-by-step process to calculate the net interest margin (NIM) is as follows.
The formula to calculate the net interest margin (NIM) is as follows.
Where:
We’ll now move to a modeling exercise, which you can access by filling out the form below.


Suppose we're tasked with calculating the net interest margin (NIM) of Morgan Stanley (NYSE: MS) for fiscal years ending 2021 and 2022.
In 2022, the average
| Net Interest Margin (NIM) | ||
|---|---|---|
| ($ in millions) | 2021A | 2022A |
| Morgan Stanley (NYSE: MS) | ||
| Interest Income | $9,411 | $21,595 |
| (–) Interest Expense | (1,366) | (12,268) |
| Net Interest Income | $8,045 | $9,327 |
| % Growth | – | 15.9% |
The financial data was sourced from the following section of Morgan Stanley's 10-K.
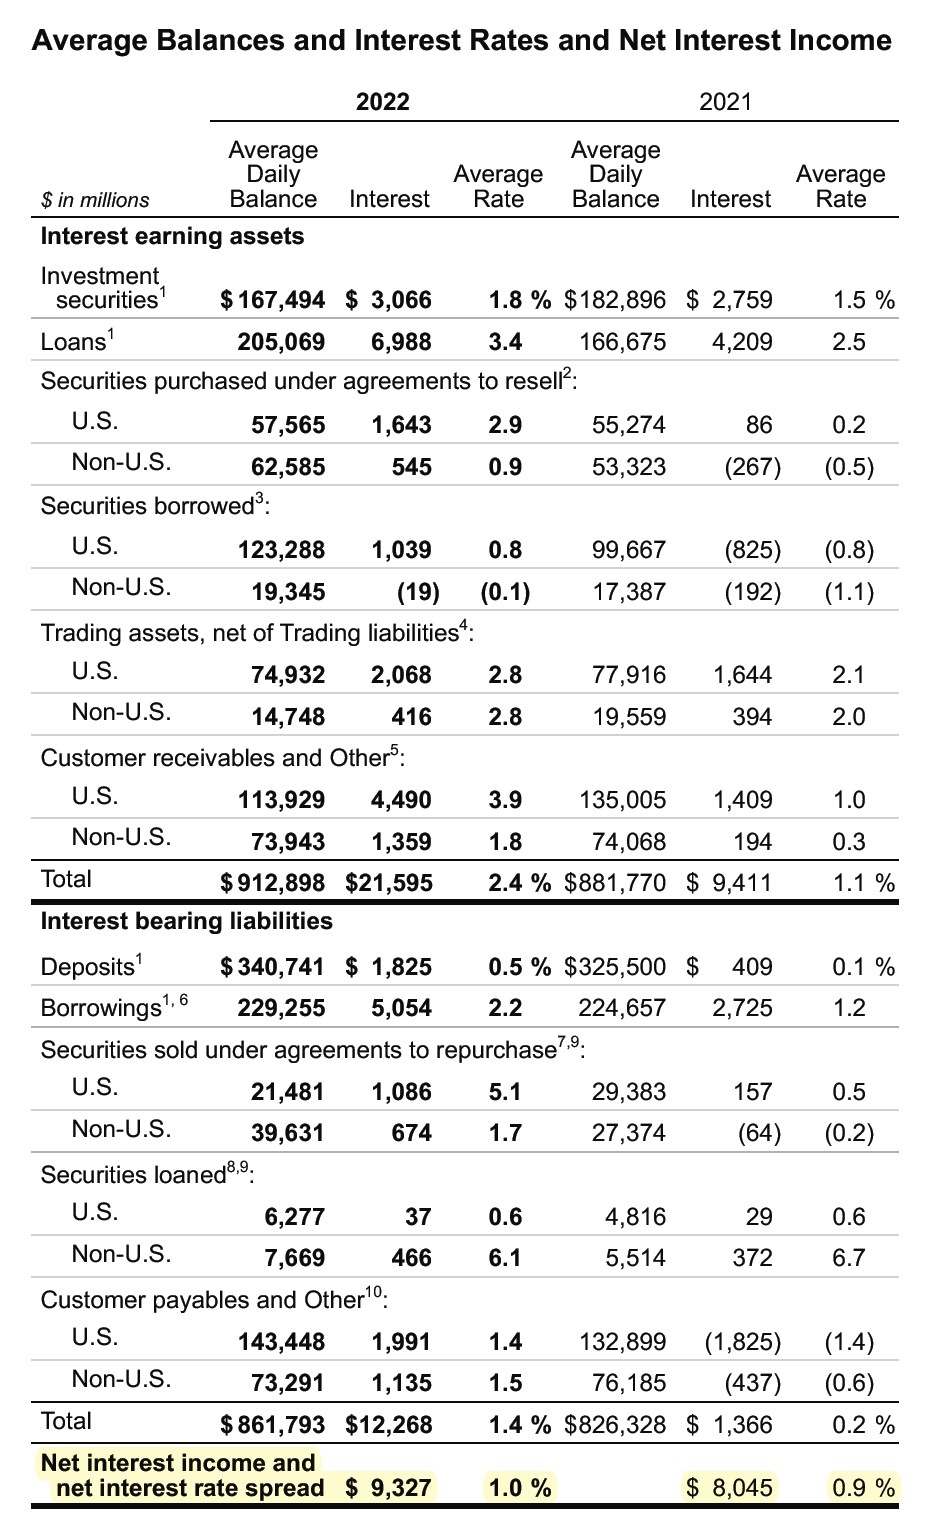
Morgan Stanley Financials (Source: MS FY-22 10-K)
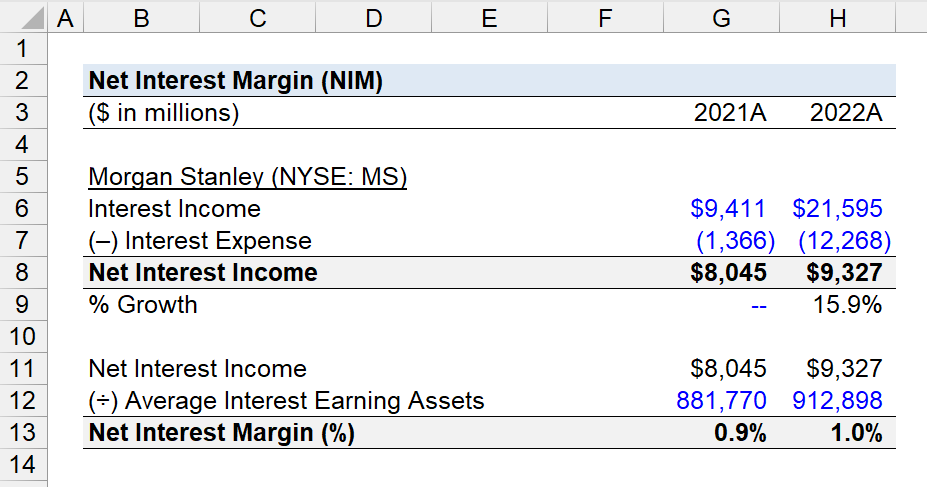
The net interest income (NII) of Morgan Stanley was $8,045 million and $9,327 million in 2021 and 2022, respectively.
The year-over-year (YoY) growth rate in the net interest income (NII) of Morgan Stanley was 15.9%, which was attributable to the rise in the market interest rate.
By dividing the net interest income (NII) by the average interest-bearing assets in the corresponding period, we can determine the net interest margin (NIM).

Enroll in The Premium Package: Learn Financial Statement Modeling, DCF, M&A, LBO and Comps. The same training program used at top investment banks.


No comments yet.