What is EBITA?
EBITA is a non-GAAP measure of a company’s operating profitability, where the effects of amortization are removed (i.e. a non-cash add back).

EBITA is a non-GAAP measure of a company’s operating profitability, where the effects of amortization are removed (i.e. a non-cash add back).
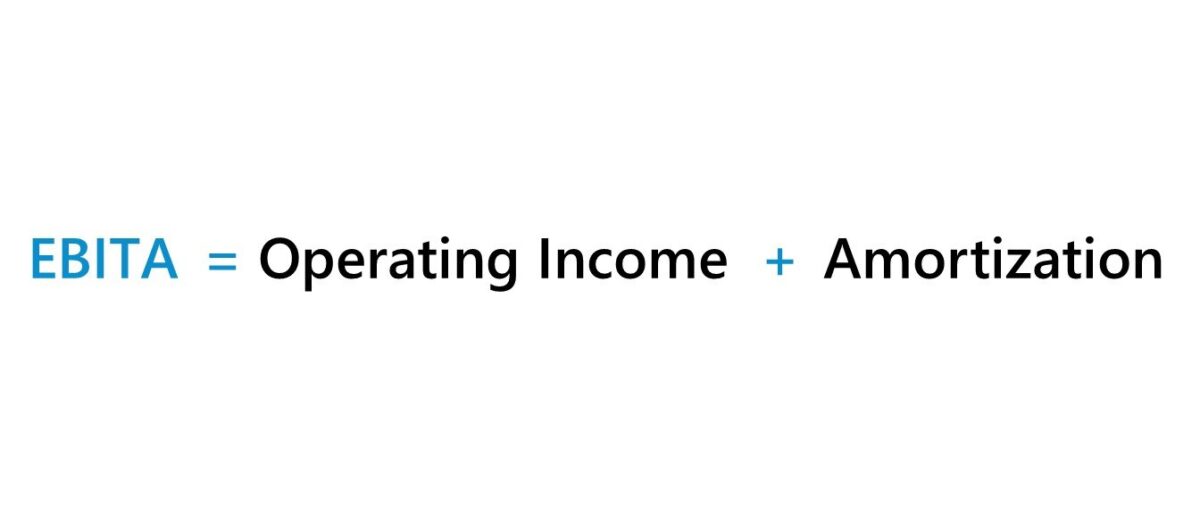
EBITA stands for “Earnings Before Interest and Amortization” and is a non-GAAP measure of operating profitability.
EBITA sits between two of the most common profit metrics used in finance, EBIT and EBITDA.
The item that sets EBITA apart from EBIT and EBITDA is that EBITA merely adds back amortization and not depreciation.
Under accrual accounting, amortization is the methodology through which the carrying value of intangible assets – i.e. non-physical assets – are incrementally reduced over their useful lives.
In practice, the usage of the EBITA profit metric, in comparison to EBIT and EBITDA, is far less common. However, there are certain instances wherein an equity analyst might want to quantify the contribution of the depreciation add-back to better understand the variance between EBITA and EBITDA.
The decision to treat depreciation as an add-back can significantly increase the EBITDA of companies – namely those operating in capital-intensive industries like manufacturing and industrials – which can artificially inflate the profitability of such companies and be misleading to investors.
For the EBITA metric, depreciation is treated as a real cost incurred by a business.
In contrast, EBITDA adds back depreciation because it is a non-cash item, which is one of the metric’s primary sources of criticism, i.e. it essentially neglects the full cash flow impact from capital expenditures (Capex).
For a mature company, depreciation expense as a percentage of capital expenditures (Capex) tends to converge towards 100%.
In a broad sense, EBITA can therefore be viewed as conceptually similar to the “EBITDA less Capex” metric, assuming the criteria mentioned above is met.
But while the two types of metrics are conservative in their treatment of Capex (and depreciation), the actual values are seldom equivalent.
The formula to calculate EBITA adds amortization to operating income (EBIT).
Where:
Starting from revenue, a company’s operating costs – cost of goods sold (COGS) and operating expenses (e.g. SG&A, R&D and D&A) – are subtracted.
The resulting figure is the company’s operating income (EBIT), but amortization is embedded in either COGS or operating expenses per GAAP accounting rules.
The amortization expense can be found on the statement of cash flows, where the item is treated as a non-cash add back because there was no real movement in cash.
If the amortization expense is consolidated with depreciation, it is important to comb through the section in the 10-K (or 10-Q), where the company’s intangible assets and amortization expense are specifically stated.
EBITA can also be calculated with net income (the “bottom line”) as the starting point.
From net income, we add back all non-operating costs such as interest expense, taxes paid to the government, and one-time items such as inventory write-downs.
The resulting figure is then operating income (EBIT), so the only remaining step is to add back amortization.
We’ll now move on to a modeling exercise, which you can access by filling out the form below.


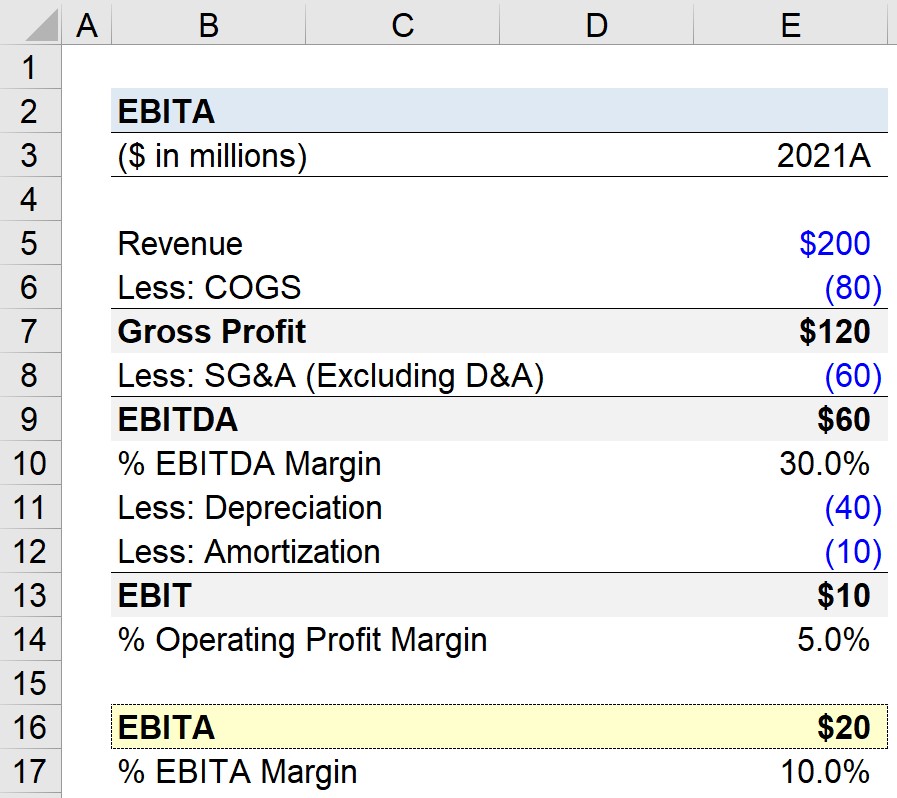
Suppose a manufacturing company generated $200 in revenue in fiscal year 2021.
The manufacturer’s COGS and operating expenses were $80 million and $110 million, respectively.
Of the $110 million in total operating expenses (SG&A), the deprecation expense embedded in the line item was $40 million, while the amortization expense was $10 million. Therefore, the SG&A expense minus the effects of D&A equals $60 million.
Operating Assumptions (2021A)
Our partial income statement, with the non-cash items separately broken out, is as follows.
| Income Statement (Non-GAAP) | |
|---|---|
| ($ in millions) | 2021A |
| Revenue | $200 million |
| Less: COGS | ($80 million) |
| Gross Profit | $120 million |
| SG&A (Excluding D&A) | (60 million) |
| EBITDA | $60 million |
| Less: Depreciation | ($40 million) |
| Less: Amortization | ($10 million) |
| EBIT | $10 million |
With our income statement complete, we can calculate the EBITDA and operating profit margin by dividing the appropriate metric by revenue.
Our company’s EBITDA margin is 30%, however, its operating margin is only 5% in comparison.
In an effort to understand the discrepancy between the EBITDA margin and operating profit margin, we’ll calculate our company’s EBITA in the final part of our modeling exercise.
The calculation is relatively straightforward, as the only step is to add back the amortization expense to our company’s operating income (EBIT).
Note that given our sign convention – where expenses are entered as negatives – we must subtract the amortization expense for the intended effect.
Our company’s EBITA is $20 million, which we can standardize into percentage form by dividing by the $200 million in revenue.
In closing, we can now observe the impact that the depreciation add-back has on the implied profitability of our hypothetical manufacturing company.

Enroll in The Premium Package: Learn Financial Statement Modeling, DCF, M&A, LBO and Comps. The same training program used at top investment banks.


Is there a reason why European software companies seem to use EBITA as a guiding metric?
Hi, Cary,
It is probably for the reasons discussed in the comparison of EBITDA and EBITA for the article. Depreciation is considered a real, recurring expense, whereas much amortization is due to M&A activity or other activity that is non-recurring or at least unpredictable, and thus adding back amortization gives a better sense of ongoing, recurring profitability.
BB