EBIT vs. EBITDA: What is the Difference?
EBIT and EBITDA both measure the core operating profitability of companies, however, there are several notable distinctions.

EBIT and EBITDA both measure the core operating profitability of companies, however, there are several notable distinctions.
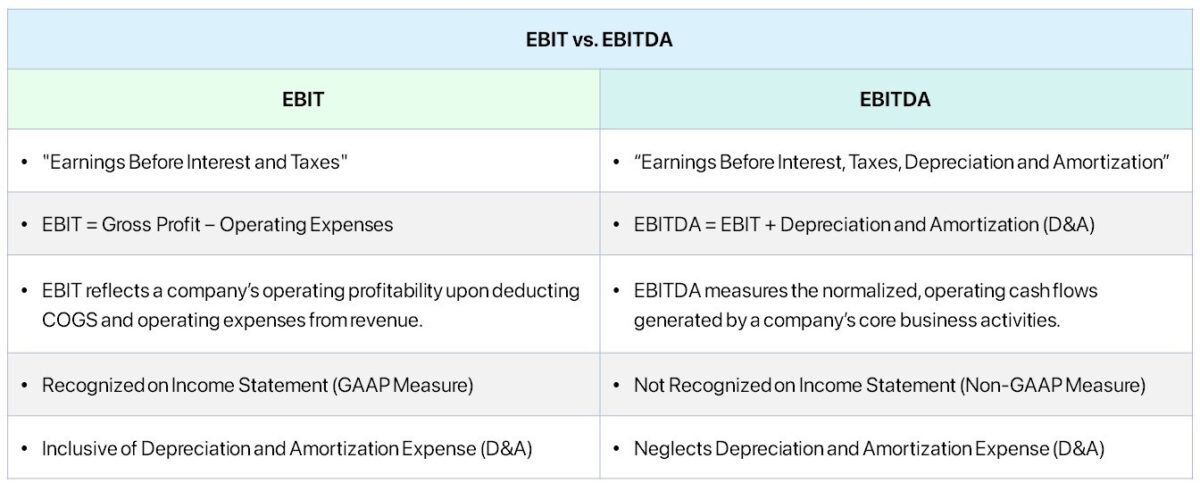
EBIT and EBITDA are acronyms for the following:
In practice, EBIT and EBITDA are two of the most prevalent metrics, particularly for performing valuation analyses, such as in the context of fundamental investing in the public markets and mergers and acquisitions (M&A) transactions.
The commonalities shared between EBIT and EBITDA are as follows.
Because EBIT and EBITDA are each independent of discretionary capital structure decisions (i.e. the financing mix) and pre-tax measures of profitability, they can be used for comparability purposes between different companies.
So, what are the key differences between EBIT and EBITDA, and which metric is better?
The most straightforward difference between EBIT and EBITDA is that the latter is adjusted to add back non-cash expenses like depreciation and amortization (D&A)
In the calculation of EBIT, revenue is adjusted by cost of goods sold (COGS) and operating expenses, which include the depreciation and amortization (D&A) expense embedded within COGS and Opex.
Where:
The EBIT formula deducts COGS and operating expenses, including the required accounting convention related to Capex (i.e. the depreciation expense), but does not directly deduct Capex.
In contrast, the calculation of EBITDA deducts from revenue the cost of goods sold (COGS) and operating expenses (SG&A) incurred by a company, but not non-cash items (D&A).
While EBITDA also deducts COGS and operating expenses, Capex is neglected in its entirety. Like EBIT, the initial outlay from the Capex is ignored, yet EBITDA also removes the effects of the depreciation expense.
The exclusion of the D&A expense in the case of EBITDA, contrary to EBIT, is thereby the primary distinction between these two profit metrics.
The depreciation and amortization (D&A) expense is recorded on the income statement per GAAP reporting guidelines to “match” the timing of the expense recognition with the monetary benefits retrieved from the fixed asset (PP&E) and intangible asset.
Yet, the actual cash outlay from the purchase of the long-term asset – i.e. the capital expenditures (Capex) – was incurred on the date of the original purchase.
The discretionary adjustment to compute EBITDA – where the depreciation expense is treated as a non-cash add-back – is the reason EBITDA is a non-GAAP measure.
EBIT is an accrual-accounting-based measure of profitability prepared under U.S. GAAP standards, whereas EBITDA is a non-GAAP, hybrid profit measure.
Unlike EBIT, which is recorded on the income statement most often as either “Operating Income” or “Operating Profit”, the reconciliation of EBITDA is reported separately in filings, earnings reports, and management presentations.
However, EBITDA is not a line item on the income statement prepared under U.S. GAAP reporting.
EBITDA must be calculated manually, starting with the add-back of depreciation and amortization (D&A).
The D&A expense is typically embedded in the COGS and operating expenses section of the income statement (and seldom broken out), so the full D&A value must usually be obtained from the cash from operations section of the cash flow statement (CFS).
The magnitude of the difference between EBIT vs. EBITDA is contingent on the industry in which the company in question operates, including other discretionary management decisions.
For example, the useful life assumption of fixed assets (PP&E) and management’s efficiency at capital spending (or lack thereof).
The variance between EBIT and EBITDA is further expanding as of late due to the rise in usage of the “Adjusted EBITDA” metric, which is the traditional EBITDA metric but with even more discretionary adjustments.
The rationale for applying the adjustments to EBITDA, at least in theory, is to portray a company’s operating performance more accurately to offer investors more transparency.
The risk here is that greater management discretion and less standardization create more “room” for questionable adjustments and the risk of earnings manipulation to paint a misleading picture of the current state of a company’s profitability.
EBITDA tends to be more useful for analyzing capital-intensive companies or those with substantial intangible assets (and amortization expenses).
If EBIT were to be used, there could be a misguided interpretation that the company was incurring steep losses when, in actuality, those are non-cash expenses.
On that note, the usage of EBITDA is more common in the context of M&A transactions because the cash flow profile of the target is what is being negotiated (and amicable adjustments can be determined).
EBIT and EBITDA metrics are frequently used to perform relative valuation, in which the two metrics coincide with the enterprise value (TEV) metric.
Why? For a valuation multiple to be practical, the numerator (i.e. the value measure) and denominator (i.e. the value driver) must match concerning the stakeholders represented.
Hence, EBIT and EBITDA both correspond to enterprise value, rather than equity value, since the profit metrics have not yet been adjusted for any payments to lenders, namely the periodic interest expense payment owed on outstanding debt.
Two of the most common valuation multiples used in relative valuation – such as comparable companies analysis (or “trading comps”) and precedent transactions analysis (or “transaction comps”) – are EV/EBITDA and EV/EBIT.
Generally, the insights derived from either multiple will be marginally different, albeit there are times in which a sizable depreciation and amortization expense can cause a discrepancy in the multiples.
But in such scenarios – most often with capital-intensive companies that operate in the manufacturing, transportation sector, or the airline industry – other industry-specific valuation multiples like EV/EBITDAR would be more appropriate.
The aforementioned instances are outliers, however, so EV/EBIT and EV/EBITDA are most often displayed side-by-side on a comps sheet.
EBITDA is greater than EBIT in practically all cases since non-cash charges like D&A are added back.
Thus, the EV/EBIT multiple will be higher than EV/EBITDA, considering the denominator is of lesser value.
EV/EBIT is thus perceived as the more conservative valuation multiple, especially to critics who view EBITDA as a flawed measure of profitability.
Likewise, the interest coverage ratio – especially when measured by risk-averse bank lenders that prioritize capital preservation and reducing the potential for capital losses – is far more likely to use EBIT instead of EBITDA for the same reason, i.e. EBIT is a more conservative measure of profitability.
We’ll now move to a modeling exercise, which you can access by filling out the form below.


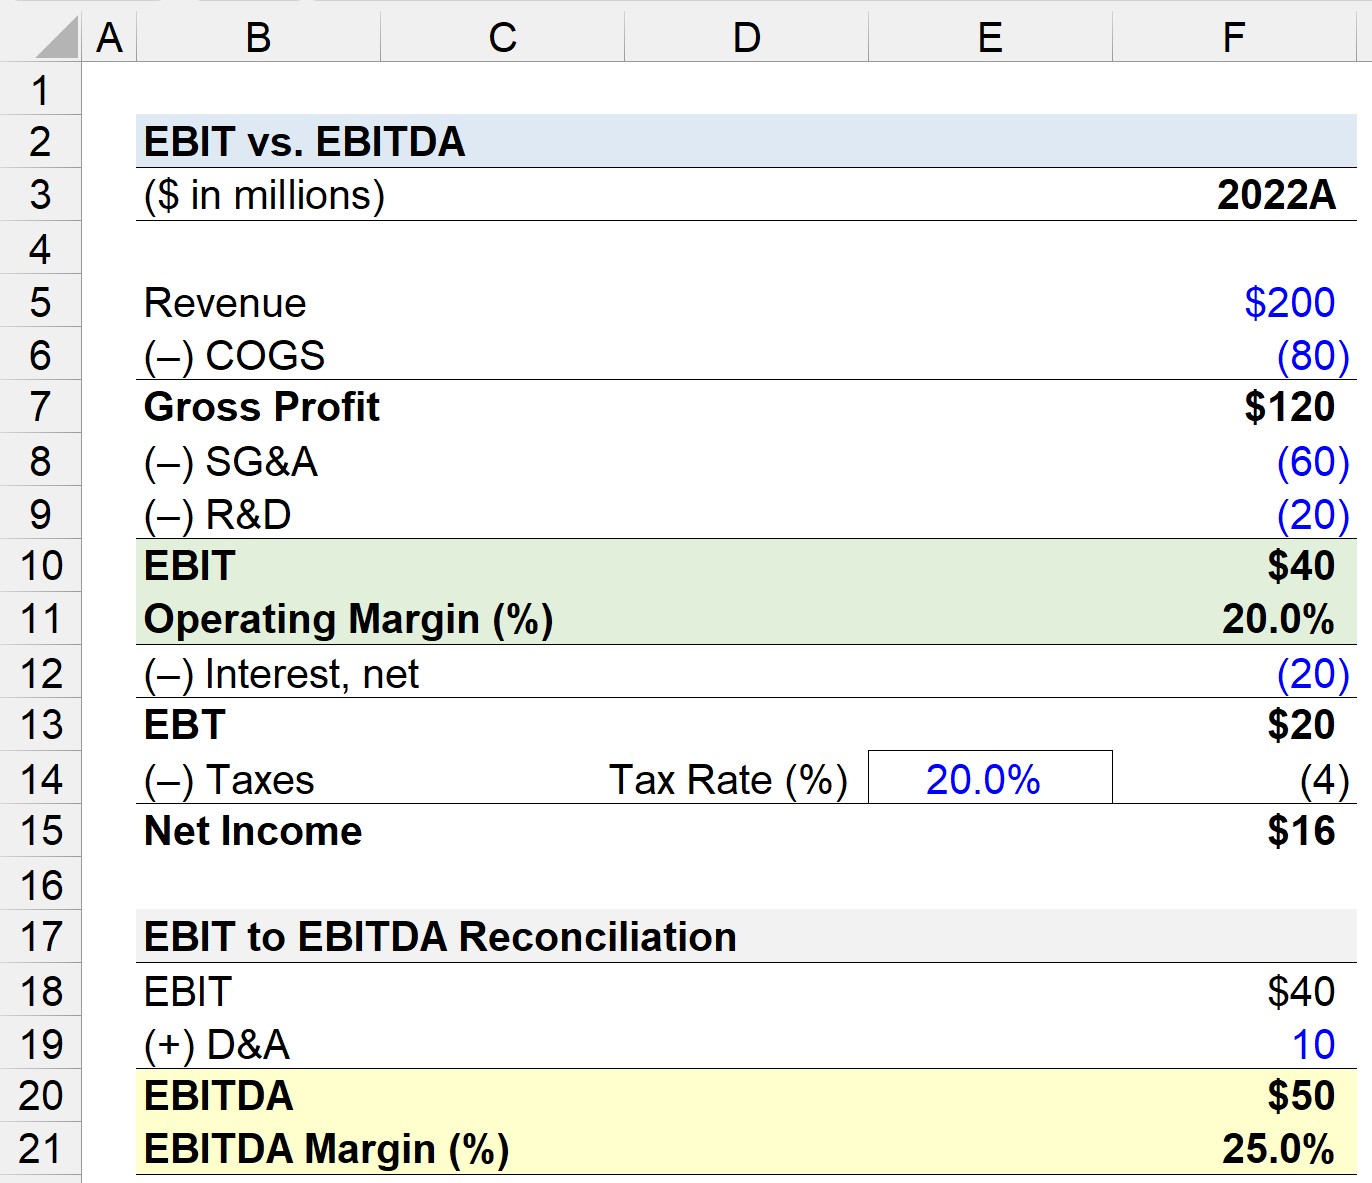
Suppose you’re tasked with calculating the EBIT and EBITDA of a company given the following income statement from fiscal year 2022.
| Income Statement | |
|---|---|
| ($ in millions) | 2022A |
| Revenue | $200 |
| (–) COGS | (80) |
| Gross Profit | $120 |
| (–) SG&A | (60) |
| (–) R&D | (20) |
| EBIT | $40 |
| Operating Margin (%) | 20.0% |
| (–) Interest, net | (20) |
| EBT | $20 |
| (–) Taxes (20.0%) | (4) |
| Net Income | $16 |
Upon subtracting the company’s operating expenses – the SG&A and R&D expenses – from gross profit, our company’s EBIT comes out to be $40 million.
From there, we’ll standardize the company’s EBIT into a percentage by dividing the GAAP profit metric by revenue, which yields an operating margin of 20.0%.
The 20.0% operating margin implies that the company generates $0.20 in operating income (or EBIT) per dollar of revenue earned.
The next part of our quick modeling exercise comprises the reconciliation of EBIT (GAAP) into EBITDA (Non-GAAP).
For our depreciation and amortization (D&A) assumption, we’ll assume the annual D&A expense recognized on the income statement in FY-2022 was $10 million.
The EBITDA of our company can be determined by adding the D&A expense – which we’ll assume to have pulled from the cash flow statement (CFS) – to EBIT from the income statement.
Since EBIT in FY-2022 is $40 million, whereas the incurred D&A expense is $10 million, we arrive at an EBITDA of $50 million.
Like earlier, we’ll divide the company’s EBITDA by revenue to calculate the EBITDA margin.
The EBITDA margin amounts to 25.0%, which reflects a 5.0% differential compared to the operating profit margin.
With that said, for each dollar of revenue generated, the company earns $0.25 in EBITDA.
The non-operating items recorded on the income statement, such as interest and taxes, are not part of the calculation for either EBIT or EBITDA, which reiterates how the two metrics are capital structure neutral and unaffected by taxes.
Like EBIT, EBITDA is capital structure independent and not affected by taxes. The treatment of D&A as a non-cash charge, however, is what causes the difference between our hypothetical company's EBIT and EBITDA ($40 million vs. $50 million).

Enroll in The Premium Package: Learn Financial Statement Modeling, DCF, M&A, LBO and Comps. The same training program used at top investment banks.


No comments yet.