FreeCash Flow Conversion is a liquidity ratio that measures a company’s ability to convert its operating profits into free cash flow (FCF) in a given period.
By comparing a company’s available free cash flow to an operating metric, the FCF conversion rate helps evaluate the quality of a company’s cash flow generation.
How to Calculate Free Cash Flow Conversion
The free cash flow conversion rate measures a company’s efficiency in turning its profits into free cash flow from its core operations.
The objective here is to compare a company’s free cash flow (FCF) in a given period to its EBITDA, in an effort to better understand how much FCF diverges from EBITDA.
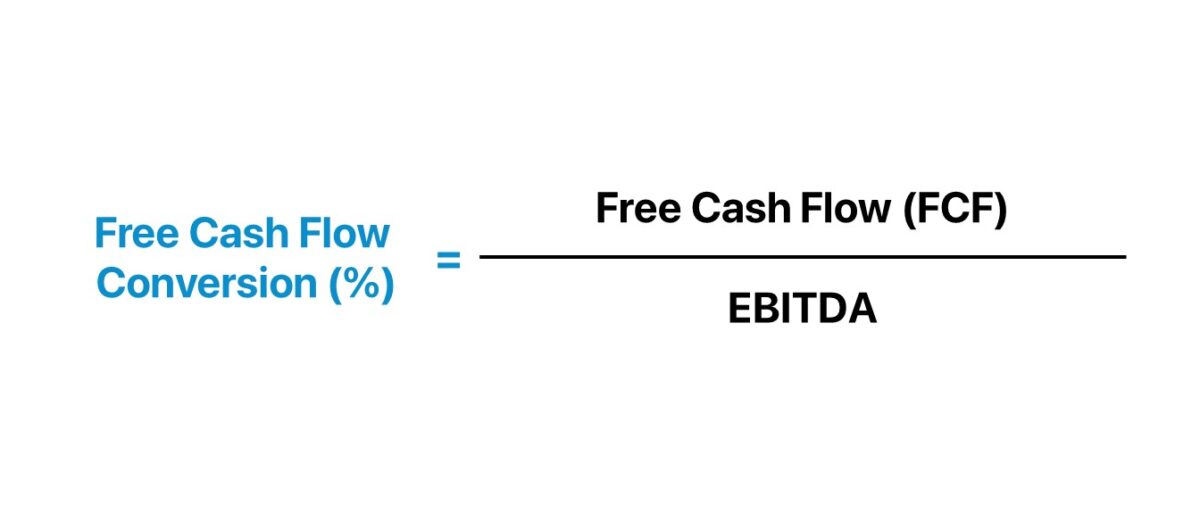
Calculating the FCF conversion ratio comprises dividing free cash flow (FCF) by a measure of operating profitability, most often EBITDA (or EBIT).
In theory, EBITDA functions as a rough proxy for a company's operating cash flow, albeit the metric receives much scrutiny among practitioners.
Why? The calculation of EBITDA adjusts operating income (EBIT) by adding back non-cash items, namely the depreciation and amortization (D&A) expense – which is usually the most significant non-cash expense for companies.
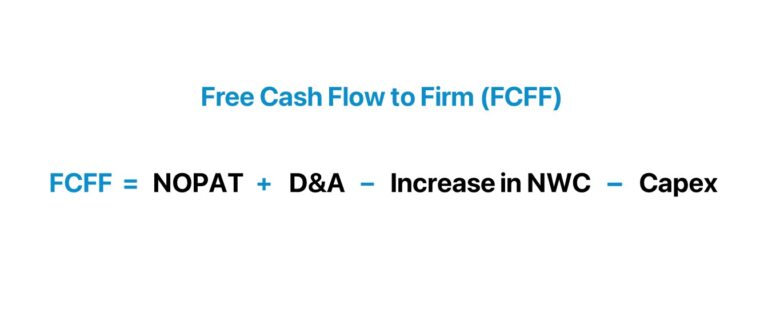
The issue at hand is that EBITDA neglects two major cash outflows:
Changes in Working Capital → The change in operating current assets and operating current liabilities.
To evaluate the true operating performance of a company and accurately forecast its future cash flows, these additional cash outflows and other non-cash (or non-recurring) adjustments are required to be accounted for.
Free Cash Flow Conversion Formula (FCF)
The formula for calculating the free cash flow conversion (FCF) rate is as follows.
The output for the FCF conversion rate is ordinarily expressed in percentage form, but can be denoted in the form of a multiple too.
What is a Good Free Cash Flow Conversion Rate?
To perform industry comparisons, each metric should be calculated under the same standards.
In addition, management’s own calculations should be referenced, but never taken at face value and used for comparisons without first understanding which items are included or excluded.
Note that the calculation of free cash flow can be company-specific, with significant discretionary adjustments made along the way.
Often, FCF conversion rates can be most useful for internal comparisons to historical performance and to assess a company’s improvements (or lack of progress) over several time periods.
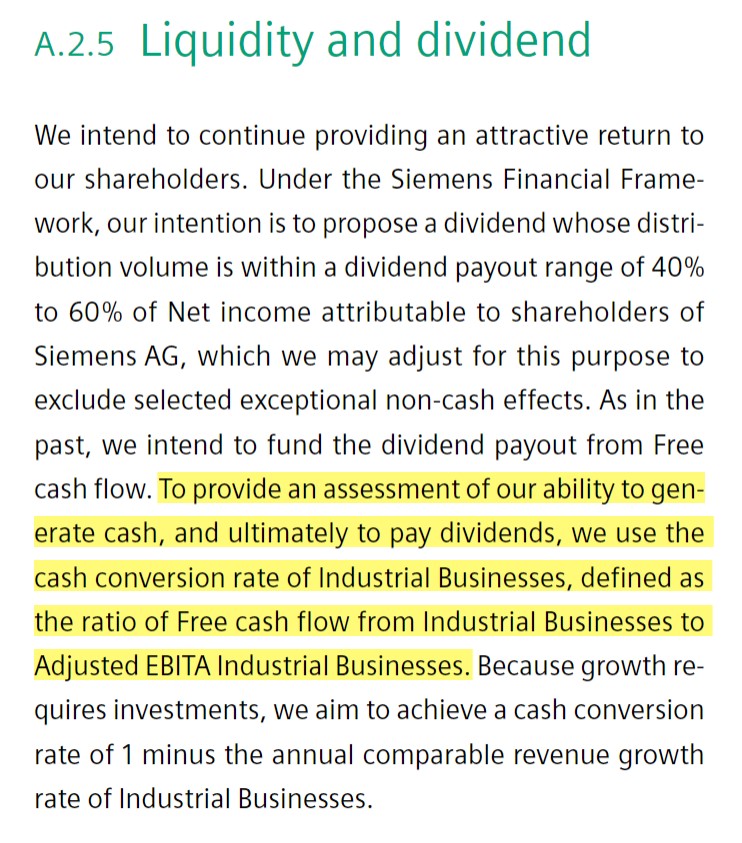
Siemens Industry-Specific Cash Conversion Example (Source: 2020 10-K)
How to Improve FCF Conversion Ratio?
A “good” free cash flow conversion rate would typically be consistently around or above 100%, as it indicates efficient working capital management.
If the FCF conversion rate of a company is in excess of 100%, that implies operational efficiency.
Quicker Inventory Turnover from Increased Market Demand
In contrast, “bad” FCF conversion would be well below 100% – and can be particularly concerning if there has been a distinct pattern showing deterioration in cash flow quality year-over-year.
A sub-par FCF conversion rate suggests inefficient working capital management and potentially underperforming underlying operations, which often consists of the following operating qualities:
Build-Up of Customer Payments made on Credit
Tightening of Credit Terms with Suppliers
Slowing Inventory Turnover from Lackluster Customer Demand
To reiterate from earlier, problems can easily arise because of definitions varying considerably across different companies, as most companies can adjust the formula to suit their company’s specific needs (and announced operating targets).
But as a generalization, most companies pursue a target FCF conversion rate close to or greater than 100%.
Free Cash Flow Conversion Calculator (FCF)
We’ll now move to a modeling exercise, which you can access by filling out the form below.
Get the Excel Template!
You’re logged in! Form submission not required. Access your file below.
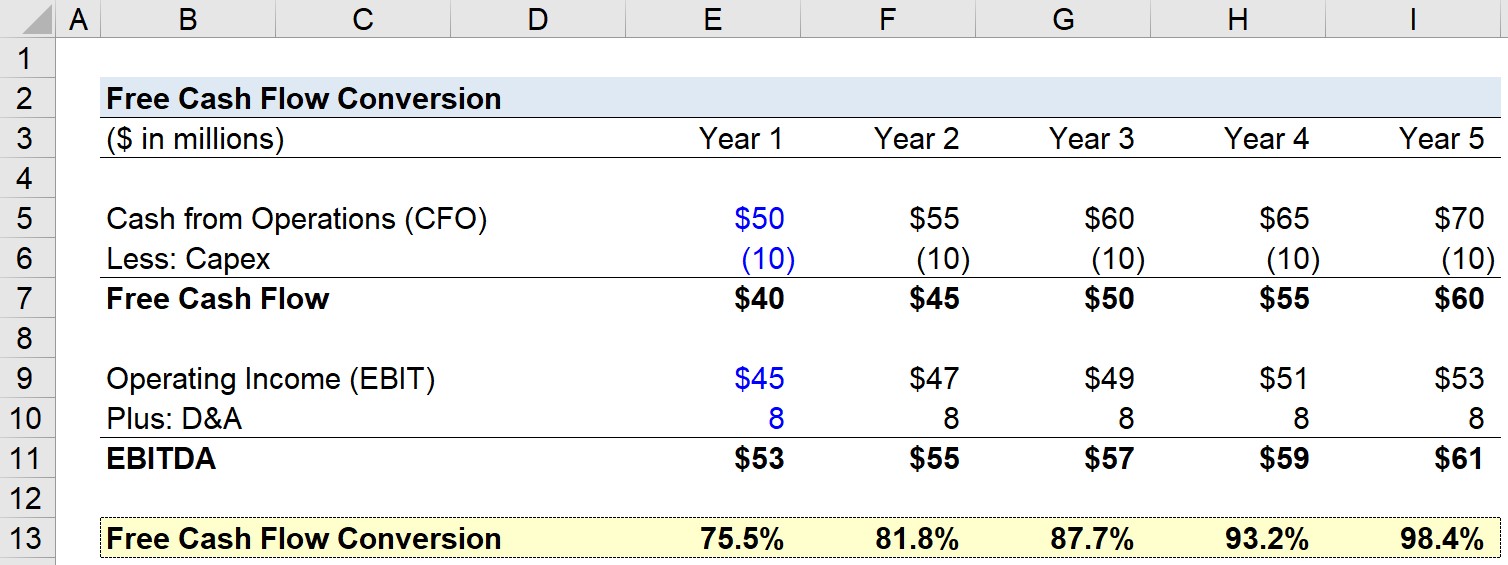
Suppose we're tasked with calculating the free cash flow conversion (FCF) of a company, given the following assumptions, in Year 1.
Cash from Operations (CFO) = $50m
Capital Expenditures (Capex) = $10m
Operating Income (EBIT) = $45m
Depreciation & Amortization (D&A) = $8m
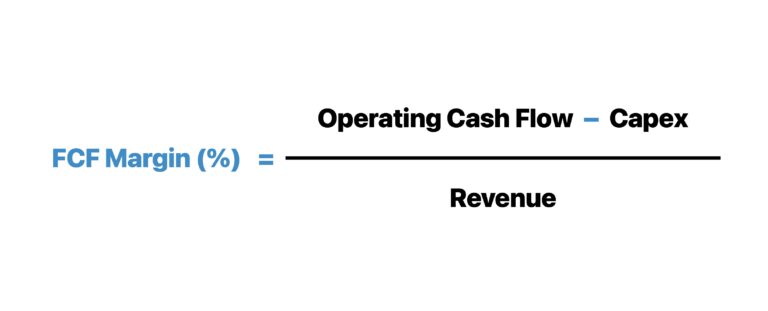
In the next step, we can calculate the free cash flow (CFO – Capex) and EBITDA:
Free Cash Flow = $50m CFO – $10m Capex = $40m
EBITDA = $45m EBIT + $8m D&A = $53m
For the rest of the forecast, we’ll be using a few more assumptions:
Cash from Operations (CFO) → Increasing by $5m per year
Operating Income (EBIT) → Increasing by $2m per year
Capex and D&A → Constant per year (i.e. "Straight-Lined")
With these inputs, we can calculate the free cash flow conversion rate for each year, starting with Year 1.
For instance, we’ll divide the $40m in FCF generated in Year 1 by the $53m in EBITDA to arrive at an FCF conversion rate of 75.5%.
Free Cash Flow Conversion (FCF) – Year 1 = $40 million ÷ $53 million = 75.5%
Here, we’re essentially figuring out how close a company’s discretionary free cash flow gets to its EBITDA.
In conclusion, we can see how the free cash flow conversion rate (FCF) has increased over time, from 75.5% in Year 1 to 98.4% in Year 5, which is driven by the FCF growth rate outpacing the EBITDA growth rate.
Continue Reading Below
Step-by-Step Online Course
Everything You Need To Master Financial Modeling
Enroll in The Premium Package: Learn Financial Statement Modeling, DCF, M&A, LBO and Comps. The same training program used at top investment banks.





No comments yet.