What is EBITDA Coverage Ratio?
The EBITDA Coverage Ratio measures a company’s capacity to meet its interest payments by comparing its EBITDA against its interest burden.

The EBITDA Coverage Ratio measures a company’s capacity to meet its interest payments by comparing its EBITDA against its interest burden.
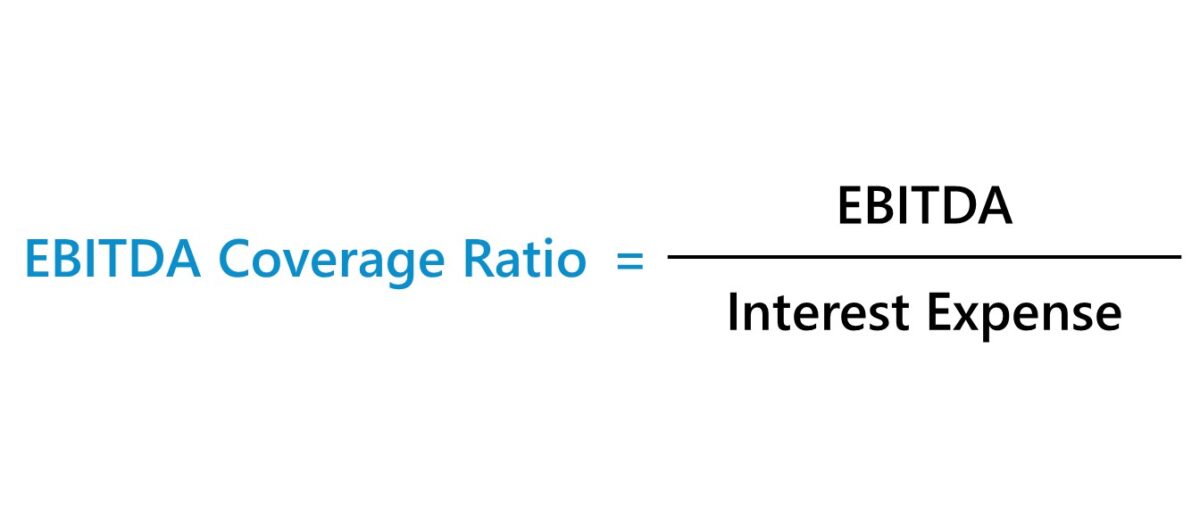
The EBITDA coverage ratio is used to determine the credit profile of a borrower, namely in terms of understanding liquidity risk.
The drawbacks to raising capital in the form of debt financing relate to the periodic interest payments and the return of the original principal amount by the date of maturity, which are contractually binding per the lending agreement.
Conceptually, the EBITDA coverage ratio measures the number of times (“turns”) that the company’s EBITDA can meet the interest expense payments coming due.
The higher the EBITDA coverage ratio, the more financially stability in the credit profile of the borrower, with minimal risk of defaulting on its debt obligations.
Since the borrower is afforded with more of a "cushion", the probability of withstanding periods of underperformance or poor economic conditions, such as a recession, is much greater.
Since debt securities such as bonds and loans represent contractual obligations—wherein capital is provided by a lender in exchange for the promise to meet the required payments on time—the borrower’s failure to abide by the payment schedule can lead to financial distress (and potential bankruptcy).
Formulaically, the EBITDA coverage ratio compares the EBITDA of a company relative to its interest expense.
Where:
There are numerous interest coverage ratios relied upon in practice as part of credit analysis, but the EBIT and EBITDA variations are the two most common, especially regarding their practicality across different industries and sectors.
The distinction between the EBITDA and EBIT coverage ratio is that the latter does not add back depreciation and amortization (D&A).
While the metric is an interest coverage ratio—i.e. a cash flow metric such as EBIT or EBITDA is compared to a company’s interest expense—the ratio is of high relevance to understanding a company’s long-term solvency, i.e. the company’s ability to continue operating as a “going concern."
The interest expense component of debt is a direct function of its outstanding debt principal on the company’s balance sheet, i.e. more reliance on debt financing coincides with a greater interest burden, all else being equal.
The risk of not meeting a near-term interest payment on time can often be the tip of the iceberg, rather than a temporary setback.
But of course, there are other variables that lenders pay close attention to while performing diligence on a potential borrower and setting the interest rate pricing and the terms attached to the debt instrument.
We’ll now move on to a modeling exercise, which you can access by filling out the form below.


Suppose you’re tasked with measuring the credit risk of a manufacturer using the EBITDA coverage ratio.
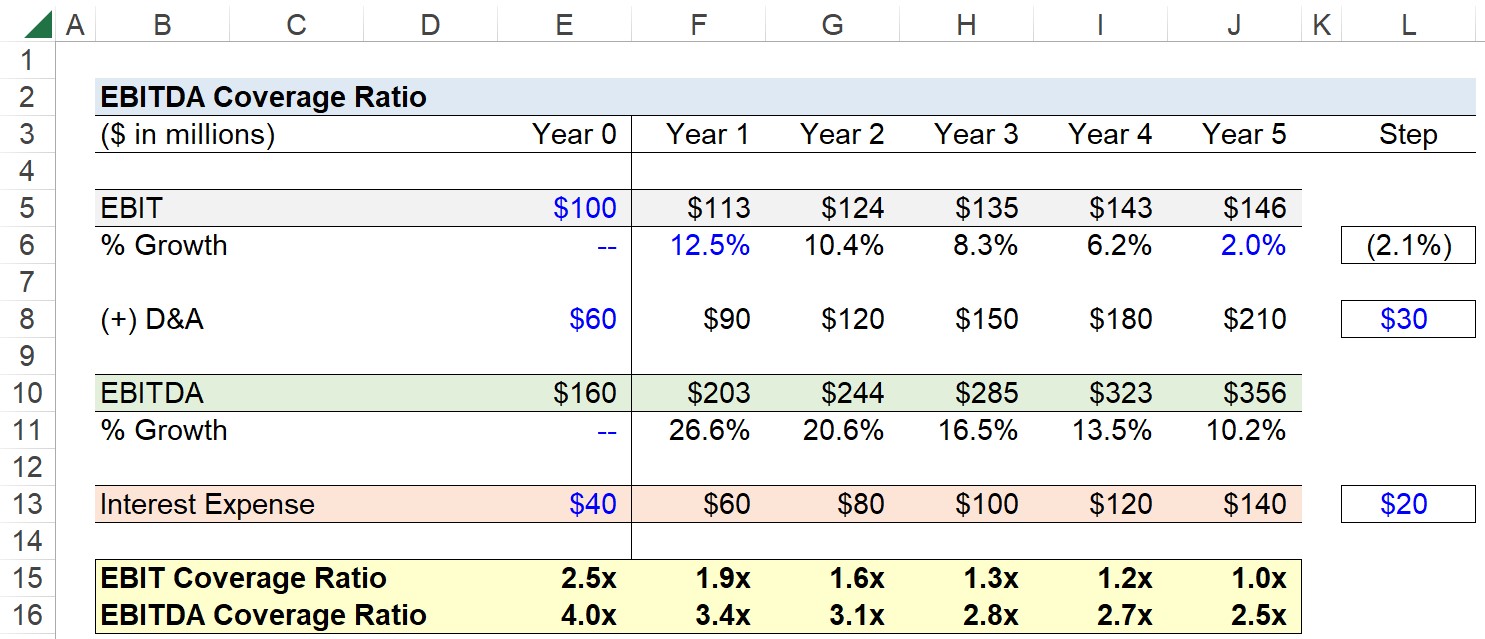
The selected financial data of the company in Year 0 is as follows.
Considering the manufacturer’s D&A as a percentage of its EBIT is 60% in Year 0, we can reasonably assume its business model requires significant capital expenditures (Capex) to generate revenue.
The manufacturer’s operating margin also seems to be on the lower end, as the growth in D&A outpaces its growth in EBIT.
Even if we were to assume the manufacturer’s revenue is exhibiting strong, stable growth, its reinvestment needs—and its allocation towards capital expenditures (Capex) in particular—might need to be reduced.
Note: For capital-intensive companies, (EBITDA – Capex) is often used for financial ratios and valuation multiples. However, for illustrative purposes (i.e. EBITDA vs. EBIT coverage), we chose otherwise in this example.
For the first year of our forecast period (Year 1), we’ll assume the following assumptions.
From that point onward, the manufacturer’s EBIT growth rate is expected to reach 2.0% by the end of Year 5 in equal increments, its D&A will increase by $30 million each year, and interest expense will increase by $20 million per year.
In the final step of our exercise, we’ll divide our cash flow metrics—either EBIT or EBITDA—by the interest expense in the corresponding period.
From the initial period (Year 0) to the end of the forecast (Year 5), the manufacturer’s EBIT coverage ratio declined from 2.5x to 1.0x, i.e. the company’s operating income is barely sufficient to service the corresponding interest payment, which should signal the need for urgent measures to be taken to avoid a potential future default.
Over the same time frame, the manufacturer’s EBITDA coverage ratio declined from 4.0x to 2.5x, which is also trending in an unfavorable direction, but the 2.5x ratio is substantially less of a concern than the 1.0x EBIT coverage ratio.
The discrepancy that formed between the EBIT and EBITDA coverage ratios is attributable to the capital-intensive nature of the manufacturer’s operations, where revenue stems from capital expenditures and the productivity of its fixed asset base.
In closing, the incurred D&A expense is treated as a non-cash add-back to calculate EBITDA starting from EBIT. However, the non-cash adjustment, coupled with the capital intensity of the manufacturer and likely poor profit margins, causes the EBITDA coverage ratio to be misleading.

Enroll in The Premium Package: Learn Financial Statement Modeling, DCF, M&A, LBO and Comps. The same training program used at top investment banks.


No comments yet.