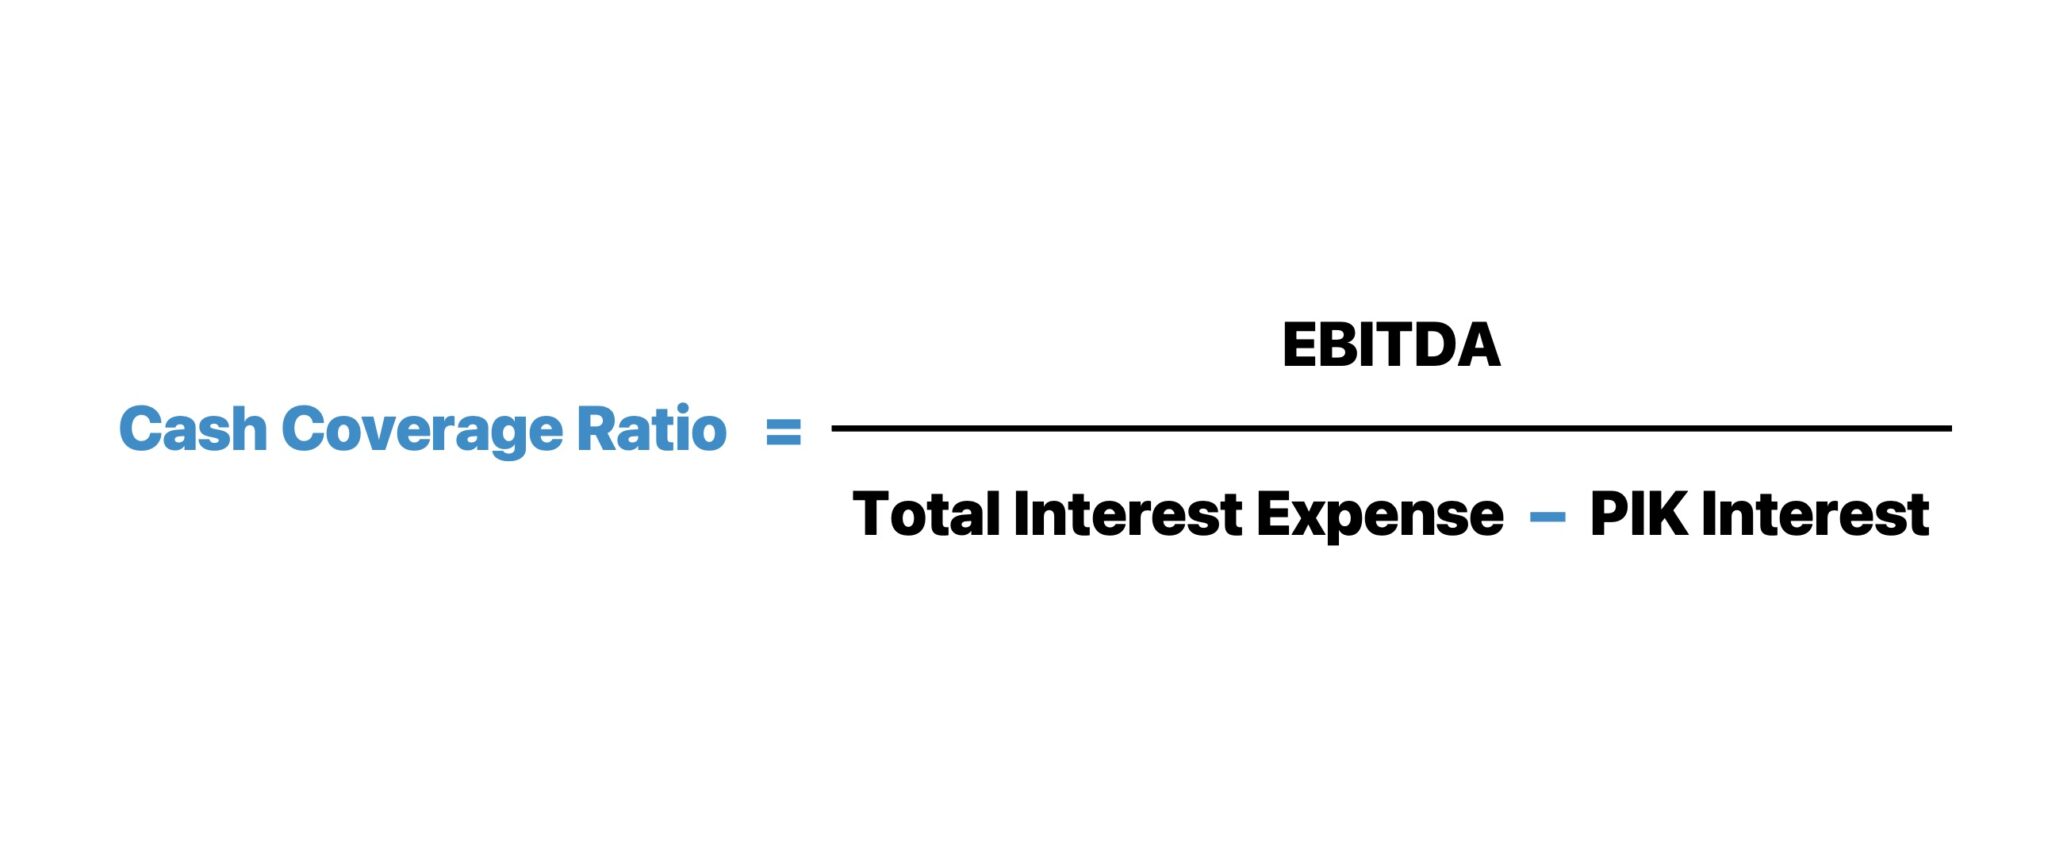
To clarify, interest expense—the cost of borrowing capital (i.e. cost of debt)—can be structured in the form of either cash, paid-in-kind (PIK) interest, or mixture of the two.
The borrower of debt capital, such as a corporation, must pay interest to the lender on a periodic basis, as part of the financing arrangement.
However, PIK interest is not paid by the borrower in the period of recognition on the income statement. Instead, PIK interest accrues to the principal balance.
Therefore, practionioners like equity analysts and lenders often recognize that the interest expense recorded on the income statement does not reflect the actual interest burden.
The adjustment applied is thereby to exclude the PIK component, so that the interest expense used to perform credit risk analysis reflects the credit risk of a particular borrower more accurately.
While PIK interest is seldom a significant portion of the interest burden, the slight alternation to the formula is not time-consuming and relatively easy to compute.
The step-by-step process to calculate the cash interest expense is as follows:
Step 1 ➝ Calculate Total Interest Expense
Step 2 ➝ Deduct Interest Income from Total Interest Expense
Step 3 ➝ Subtract PIK Interest from Total Interest Expense, net
The cash coverage ratio in which EBIT is used in lieu of EBITDA is perceived as more conversative, since non-cash charges (D&A) are removed.
However, the decision to utilize EBIT, rather than EBITDA, is a bit counterintuitive to the underlying rationale to even use the cash coverage ratio in the first place.
Why? Non-cash charges, like depreciation and amortization(D&A), reduce operating income (EBIT), despite the fact that those expenses are non-cash items.
EBITDA adds back non-cash expense to remove the effects of non-cash expense, like D&A, which aligns with the purpose of the cash coverage ratio.
Unlike the EBITDA variation, the free cash flow (FCF) is much more time-consuming to calculate, and requires collecting more financial data.
While more complicated, the output (and insights derived) are normally not too different; hence, the EBITDA variation is used more frequently.
Furthermore, the prior two variations that utilize operating metrics—EBITDA and EBIT—focus on operating performance, while disregarding the cash balance.
In contrast, the cash coverage ratio that uses free cash flow (FCF) includes the cash and cash equivalents of a company, which can be misleading because cash can be raised via equity and debt issuances (i.e. artificially inflated).
Cash Coverage Ratio Calculation Example
Suppose we’re tasked with calculating the cash coverage ratio of a company given the following historical income statement data.
In actuality, the income statement prepared under U.S. GAAP does not recognize the cash and PIK interest components separately.
However, for illustrative purposes, we’ve broken out interest expense, as well as depreciation and amortization (D&A).
The D&A expense is embeded within the cost of goods sold (COGS) and operating expenses (Opex) section of the income statement, and must thereby be obtained from the cash flow statement (CFS), where D&A is treated as a non-cash add-back.
EBITDA is equal to operating income (EBIT) plus depreciation and amortization (D&A), which comes out to $1.5 billion.
EBITDA = $1 billion + $500 million = $1.5 billion
The cash interest expense—the difference betweeen total interest expense and PIK interest—is $400 million.
Cash Interest Expense = $600 million — $100 million = $500 million



No comments yet.