What are Diseconomies of Scale?
Diseconomies of Scale occur if the incremental per unit cost of production rises from an increase in production volume (or output).

Diseconomies of Scale occur if the incremental per unit cost of production rises from an increase in production volume (or output).
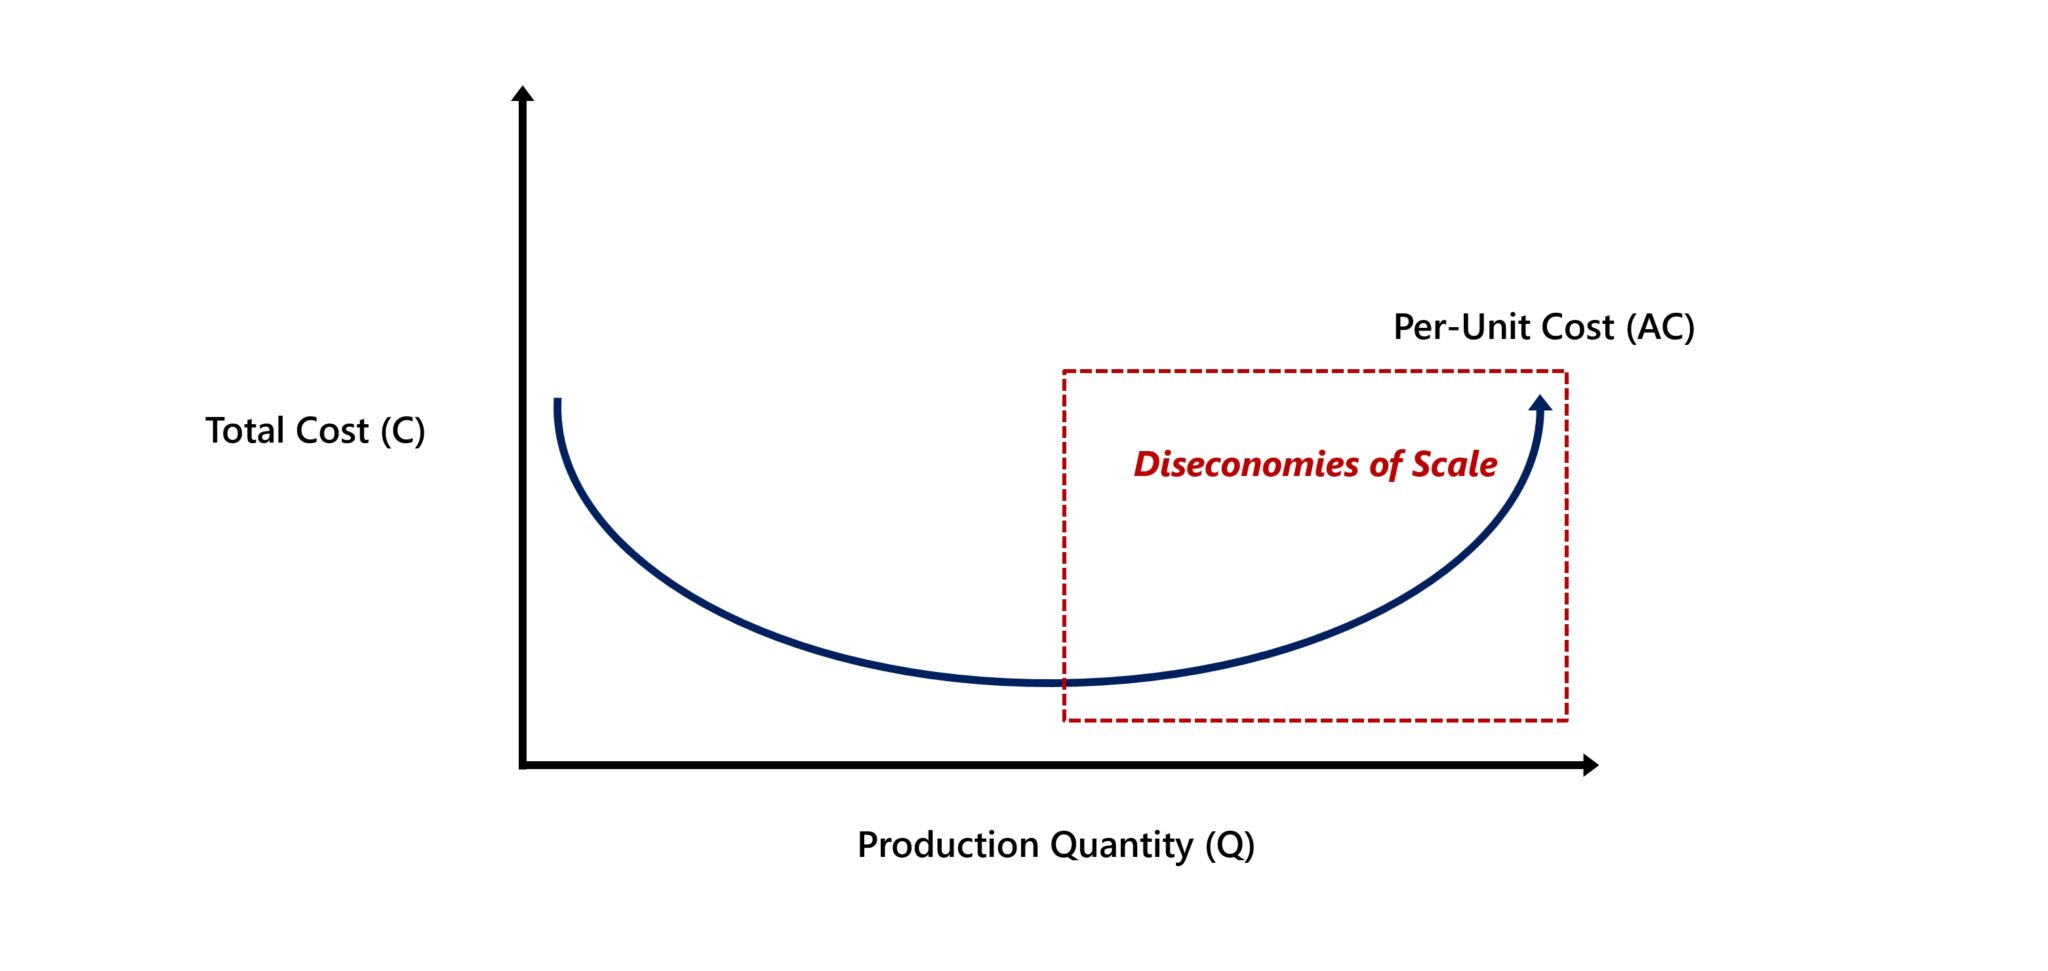
The term “diseconomies of scale” refers to a situation wherein the cost per unit of production incurred by a firm increases with a greater quantity of production output.
Generally, increased scalability and production capacity are perceived as positive factors that will contribute towards more revenue growth and profitability.
However, the marginal benefit reaped from the incremental increase in production volume eventually reaches an inflection point, wherein the trajectory reverses course soon after.
Beyond the point of inflection, the profit margins of a company face downward pressure and decline, instead of incurring fewer costs and retaining more profits like earlier.
Since the unit cost per unit rises while the production volume expands, the company's competitive positioning (and long-term profitability) is then at risk from external threats in the market, namely from the threat of new entrants.
The cause of diseconomies of scale can rarely be attributed to one specific factor, but the following list outlines the most common catalysts that often initiate a “domino effect” that negatively affects the financial state of a company.
While external factors, such as the prevailing economic conditions, can contribute to the occurrence of diseconomies of scale, internal factors are more frequently the source of the problem.
For example, suppose a company’s management team decides to prioritize growth and achieving scalability to reach new markets (and customers), without much consideration for the risks posed by such corporate actions.
Occasionally, adopting that sort of mindset can work, but only if the management team truly understands the risks beforehand and takes the precautionary measures to mitigate the risk.
Learn how institutional investors identify high-potential undervalued stocks. Enrollment is open for the upcoming cohort.
Conceptually, the difference between economies of scale and diseconomies of scale is tied to the relationship between the cost per unit and production volume, i.e. the quantity of output.
In short, economies of scale is a positive attribute that can help a company establish a sustainable moat that protects its profit margins over the long-term, whereas the reverse effect occurs from diseconomies of scale.
The law of diminishing returns is an economic principle stating that the marginal benefit earned from an increase in production volume (output) eventually declines over time.
In theory, the optimal point at which the profitability of a company is maximized is when its marginal revenue (MR) is equivalent to its marginal cost (MC), i.e. the net marginal profit is zero.
Beyond the optimal point (MR = MC), the per-unit cost that had been previously declining reverses direction and starts to increase from more production quantity. Hence, the curve on the graph starts to bend in an upward trajectory (and reflects the shape of a “U”).
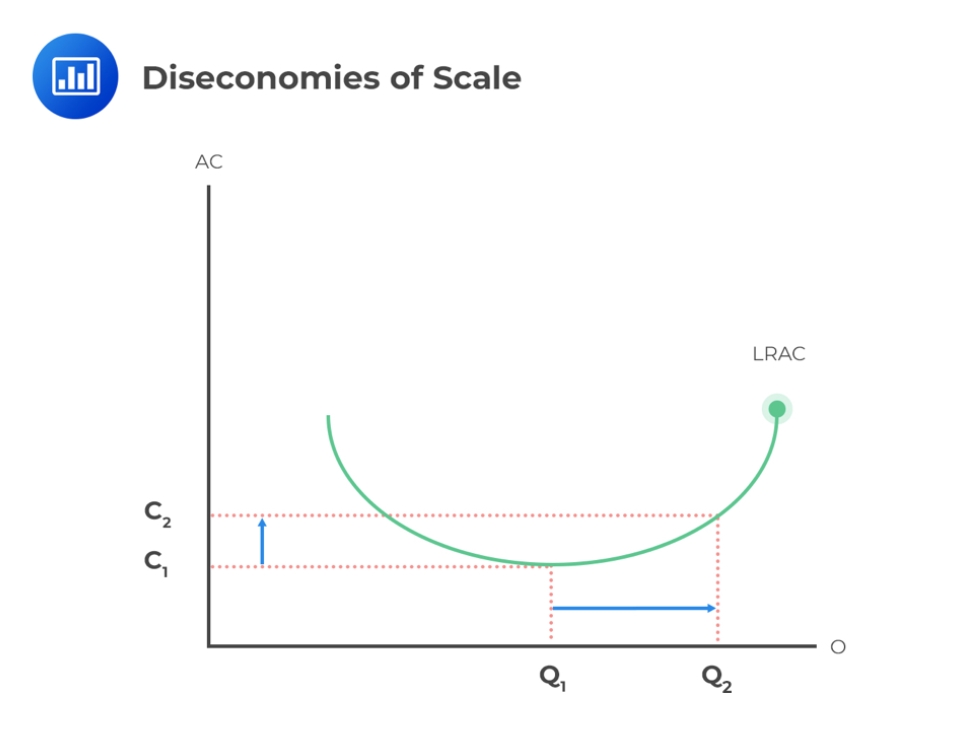
Graph of Diseconomies of Scale (Source: AnalystPrep)
Suppose a manufacturing company produced 1,000 widgets at a total cost of production of $10,000 in Q1-2022.
The per-unit cost, also known as the “average cost per unit”, can be determined by dividing the total cost incurred (TC) by the total production units (Q).
By inserting our assumptions into the formula, we arrive at a per-unit cost of $10.00 for the first quarter of 2022. Therefore, the manufacturer incurs $10.00 on average for each unit produced.
In comparison, the quarterly revenue generated by the manufacturer increased from the prior period because of the continued strength in demand from customers in the market.
In order to support the increase in market demand, the manufacturer needed to expand its production capacity, or else the demand from customers would exceed its production capacity. If that were to occur, the reputation of the manufacturer would suffer, i.e. they would be perceived by customers as being unreliable.
During the next quarter, the manufacturer produced a total of 1,200 widgets, while incurring a total cost of $15,000.
Like earlier, we’ll enter our assumptions into the average cost per unit formula, which comes out to $12.50 – reflecting a net increase of $2.50 from the preceding quarter.
On a quarterly basis, the average cost per unit rose from $10.00 to $12.50, implying that the manufacturer’s profit margin at the product level declined from the operating inefficiencies stemming from the operational adjustments recently implemented to support greater production volumes.


No comments yet.