What is BCG Growth Share Matrix?
The BCG Growth Share Matrix is a framework designed for companies to better understand a market’s current and future competitive landscape, which helps determine their long-term strategic plans.

The BCG Growth Share Matrix is a framework designed for companies to better understand a market’s current and future competitive landscape, which helps determine their long-term strategic plans.
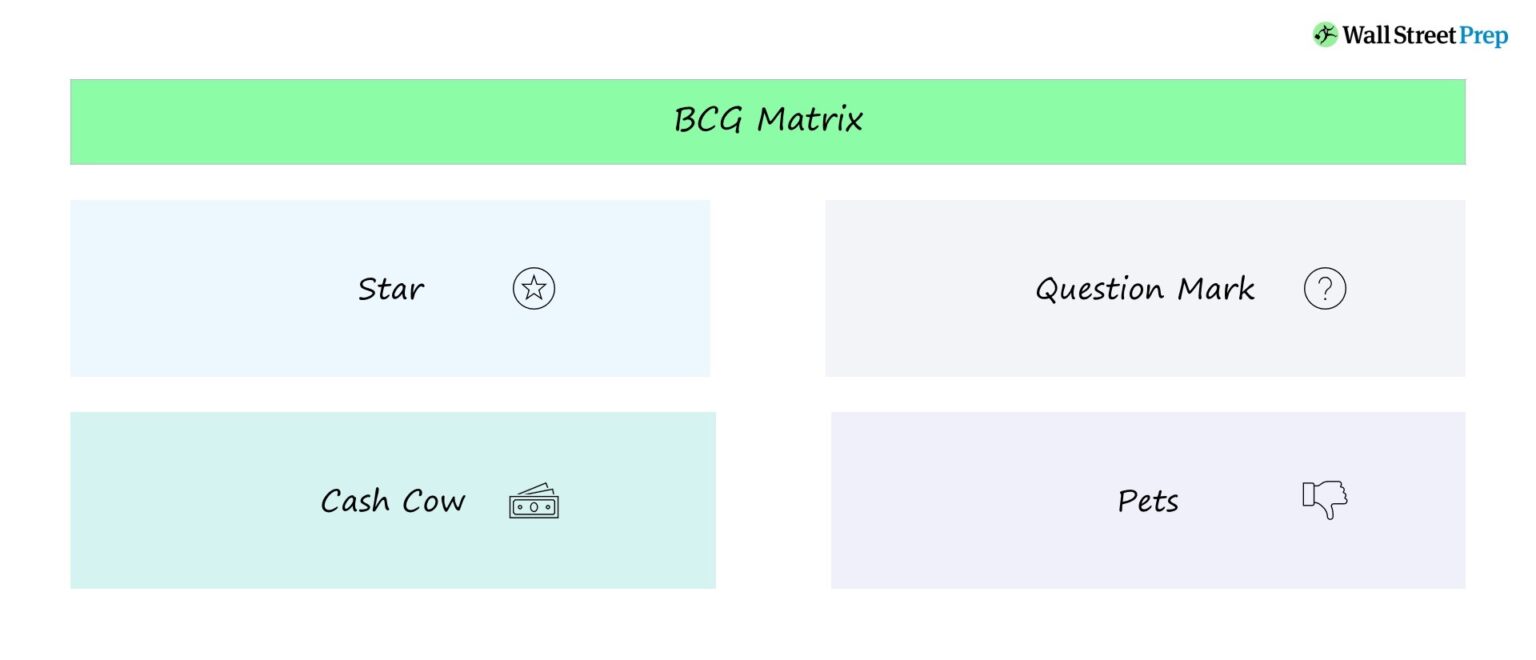
The growth share matrix created by the Boston Consulting Group (BCG) is a tool for identifying new growth opportunities and making informed capital allocation decisions to achieve long-term, sustainable growth.
The BCG growth-share matrix is a framework for companies to reference when refining and prioritizing their different businesses (and strategies).
The BCG matrix enables a company’s management team to derive insights and develop a plan to improve their current product offerings, focusing on new information about new opportunities to pursue in their current (or adjacent) markets.
The BCG matrix assesses the growth opportunities available for a specific product portfolio by conducting a two-dimensional analysis based on two parameters:
By examining a product’s potential and the prevailing (and predicted) market environment, companies can make an informed decision on where to invest more capital, develop new products/services, or divest certain assets.
The structure of the BCG matrix plots a company’s products or strategic business units (SBUs) on a four-square matrix.
The four quadrants of the BCG matrix are as follows.
The image below shows the common version of the BCG matrix.
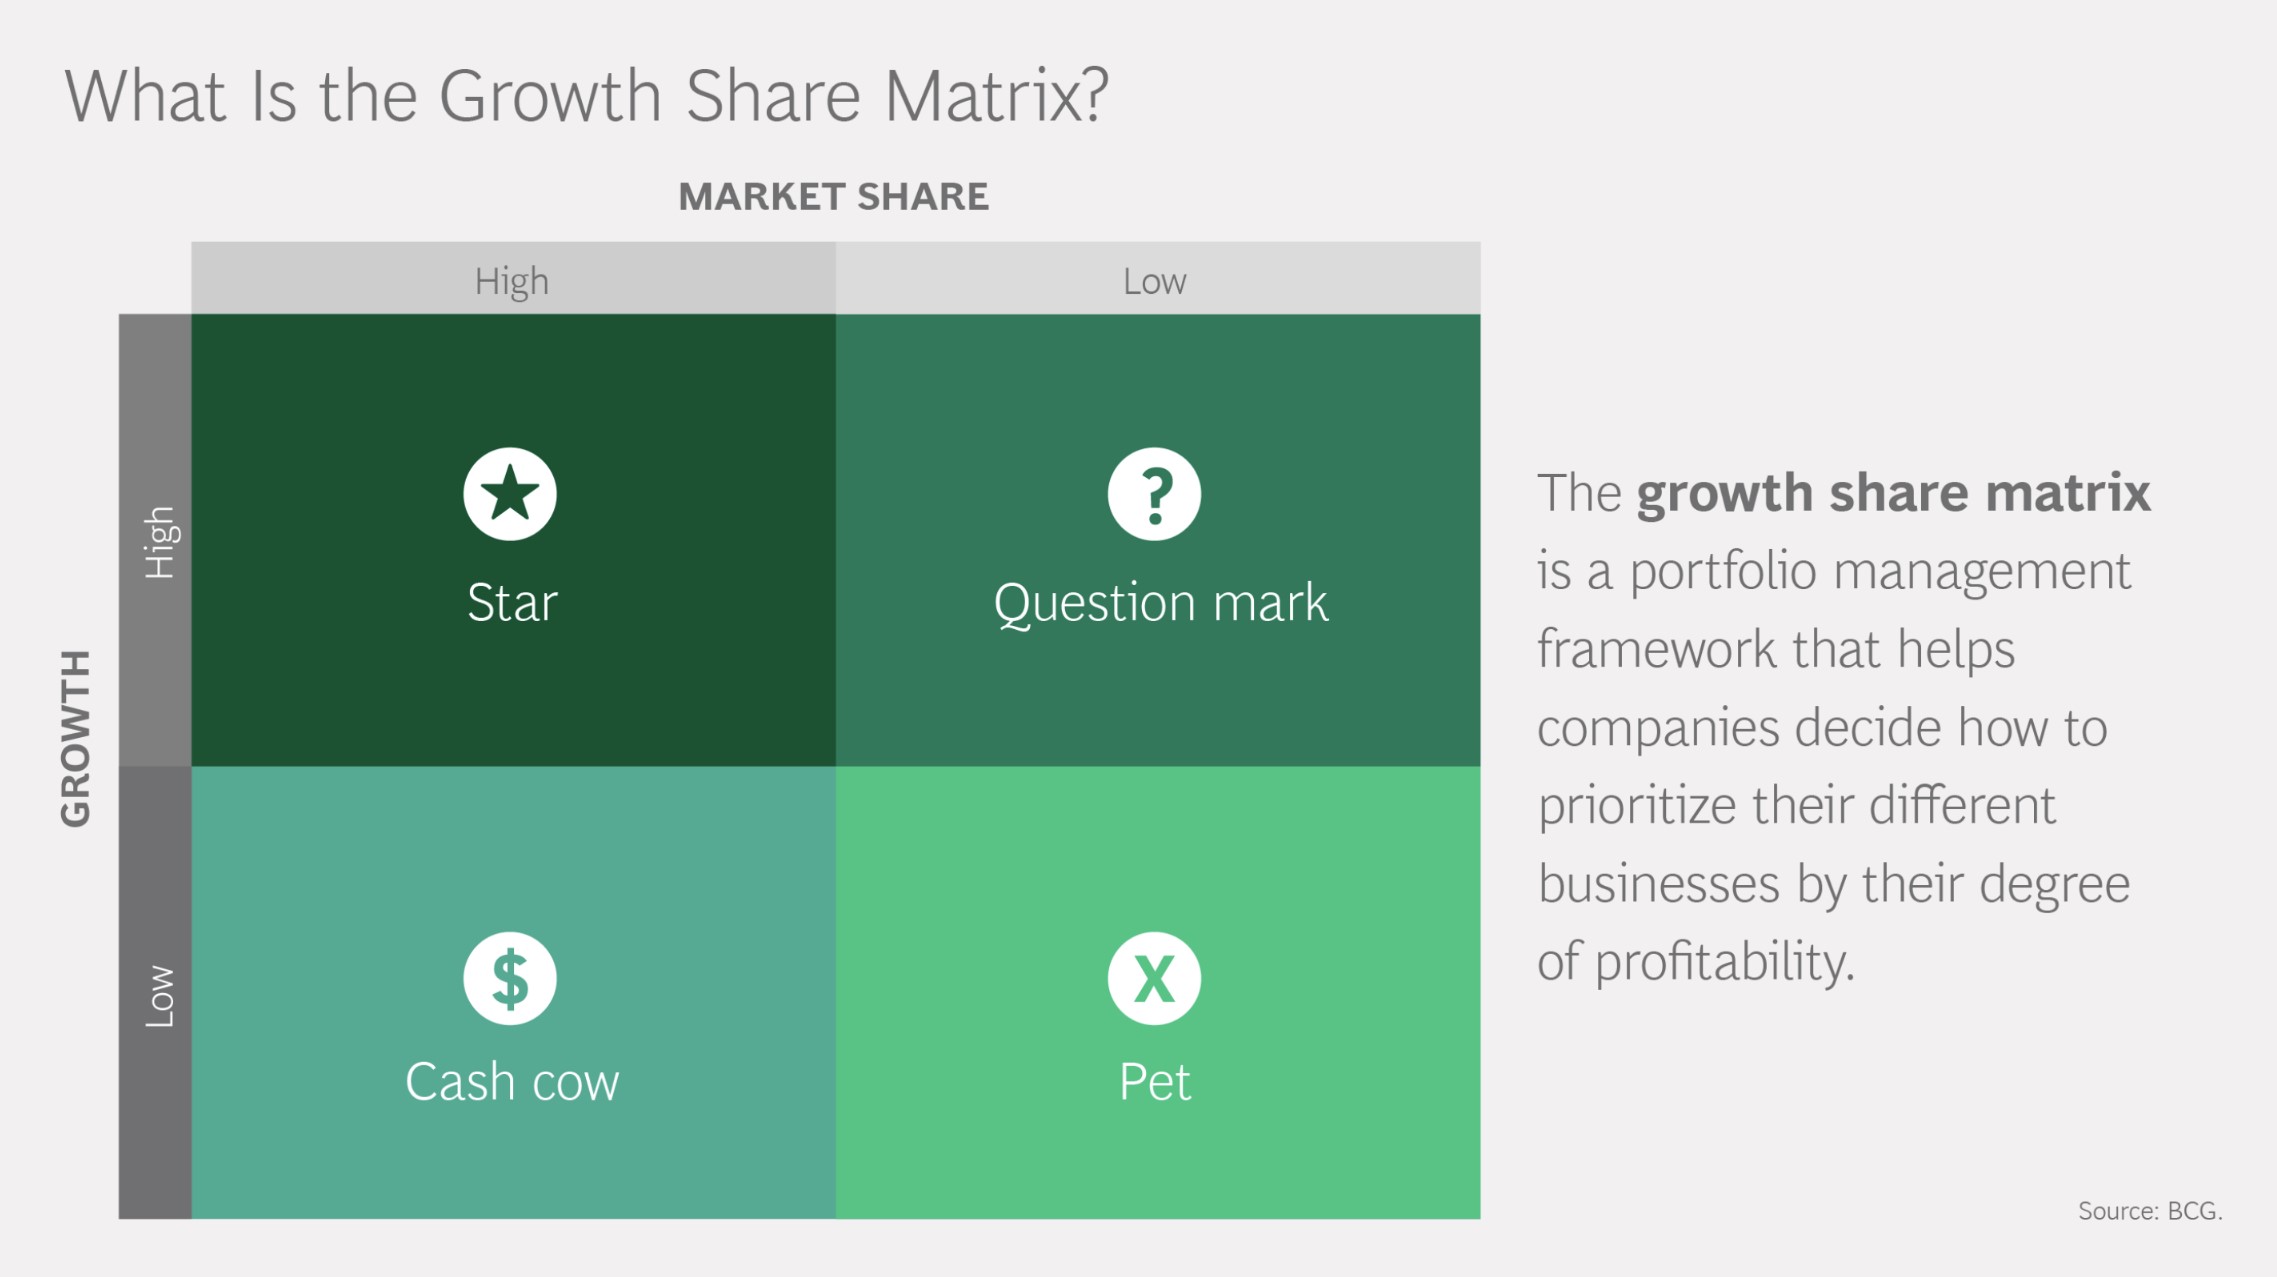
Growth-Share Matrix (Source: BCG)
Learn how institutional investors identify high-potential undervalued stocks. Enrollment is open for the upcoming cohort.
The term “Cash Cow” encompasses companies with a high market share in a slow-growing industry.
For such companies, neither profitability nor liquidity is an issue.
The one drawback is that because the markets are mature, the overall growth rate is low with limited opportunities to reinvest or expand into different markets, i.e. such companies are boring but profitable.
The required reinvestment activity and overall efforts are minimal to sustain the historical levels of cash generation for such companies.
The “Star” quadrant describes companies with high market share in a high-growth industry.
By exhibiting strong historical growth (and a pipeline of promising future opportunities) alongside high market share, stars are perceived as the most favorable products for those seeking the highest risk-adjusted returns.
Most often, these companies provide niche products or services, and tend to exhibit a clear competitive advantage, i.e. “moat”.
Of course, high growth requires spending, meaning that reinvestments are necessary to maintain strong growth.
Once the growth of the company declines and the market position stabilizes, the stars would ideally then become cash cows.
The “Question Mark” refers to companies with low market share operating in a high-growth market.
Since these sorts of companies are not market leaders, significant spending is necessary to grow and take market share away from incumbents.
The potential upside and downside are unknown, as the outcome of the company depends entirely on being able to obtain market traction and executing properly; hence, the uncertainty.
The final quadrant consists of “Pets” — the least favorable categorization in the matrix — which are companies with low market share in a mature industry with declining growth.
These companies are characterized by low margins with minimal (or potentially even negative) cash flow generation.
The most common treatment of such companies (or business units) is to discontinue operations, liquidate, or complete a divestiture, i.e. a sale to a third-party buyer.
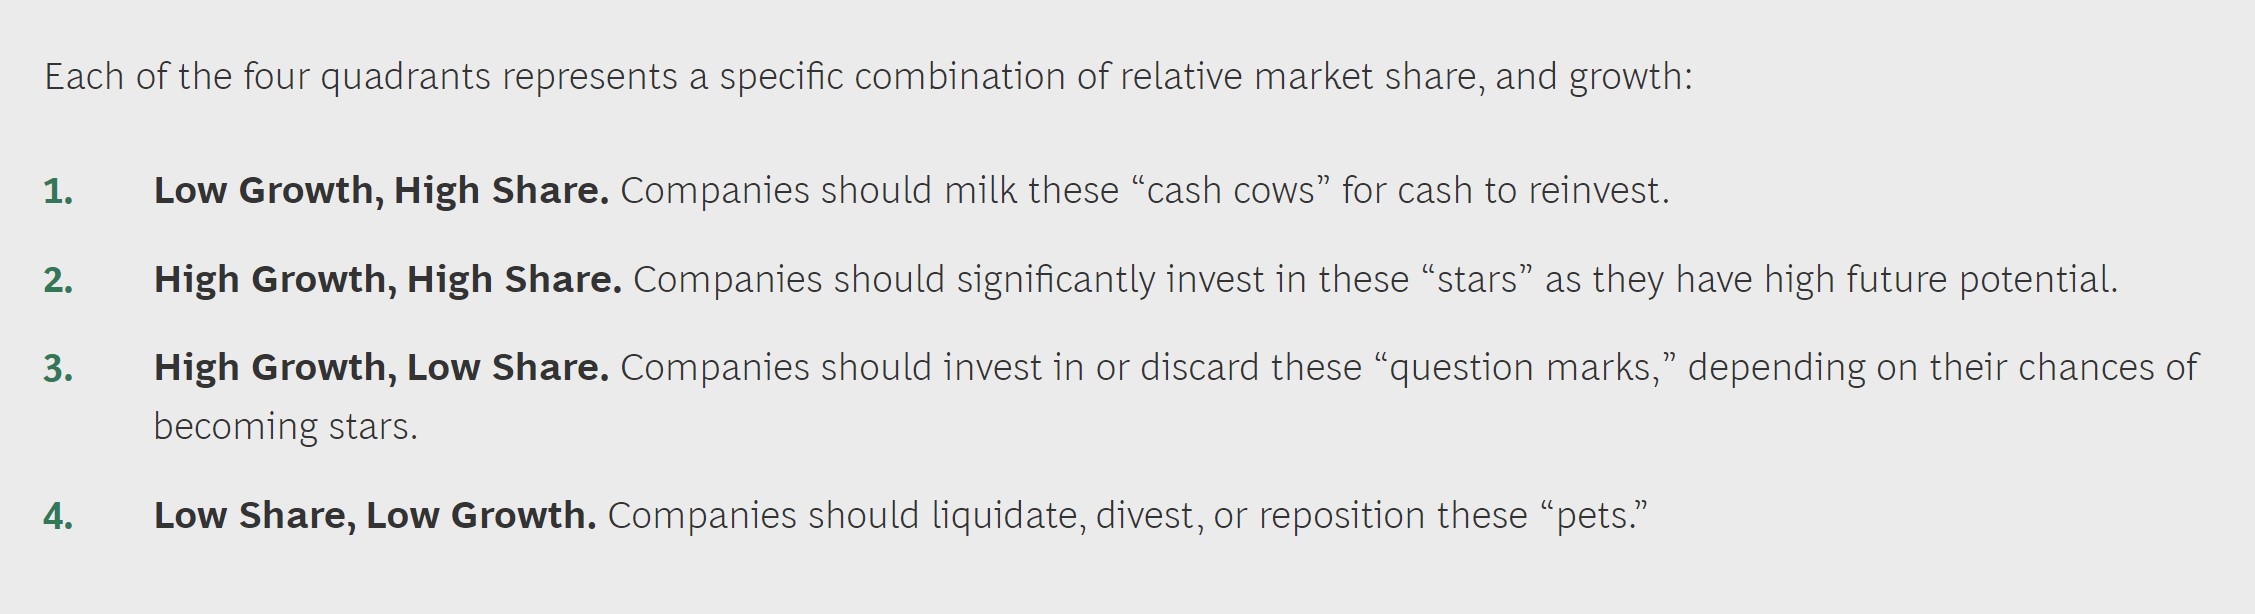
BCG Matrix Growth Quadrants (Source: BCG)
While the BCG matrix is a practical tool for allocating resources and is widely taught in academia, the model comes with its limitations:


No comments yet.