What is Profitability Index?
The Profitability Index (PI) is the ratio between the present value of cash inflows and the present value of cash outflows.

The Profitability Index (PI) is the ratio between the present value of cash inflows and the present value of cash outflows.

The profitability index (PI) is a tool to measure the monetary benefits (i.e. cash inflows) received for each dollar invested (i.e. cash outflow), with the cash flows discounted back to the present date.
In short, the profitability index (PI) measures the attractiveness of a potential project or investment to guide decision-making.
More specifically, the PI ratio compares the present value (PV) of future cash flows received from a project to the initial cash outflow (investment) to fund the project.
Therefore, the metric quantifies the economic feasibility of a project (or investment), which can then be ranked to comparable opportunities to allocate capital toward the most profitable option.
The formula for calculating the profitability index is as follows.
Another variation of the PI formula adds the initial investment to the net present value (NPV), which is then divided by the initial investment.
In corporate finance, the primary use case for the PI ratio is for ranking projects and capital investments.
The higher the profitability index (PI) ratio, the more attractive the proposed project is, and the more likely it will be pursued.
For some general guidelines on interpreting the PI ratio:
The profitability index (PI) and net present value (NPV) are two closely related metrics.
The major distinction between the two is that the profitability index depicts a “relative” measure of value, whereas the net present value (NPV) represents an “absolute” measure of value.
With that said, for purposes of presenting a project or capital investment’s benefits on a per-dollar basis of the initial investment, the profitability index is more practical since it is standardized.
The PI metric can be used to compare projects. By contrast, comparisons of NPV between projects are not always functional (i.e. non-standardized metric).
We’ll now move to a modeling exercise, which you can access by filling out the form below.


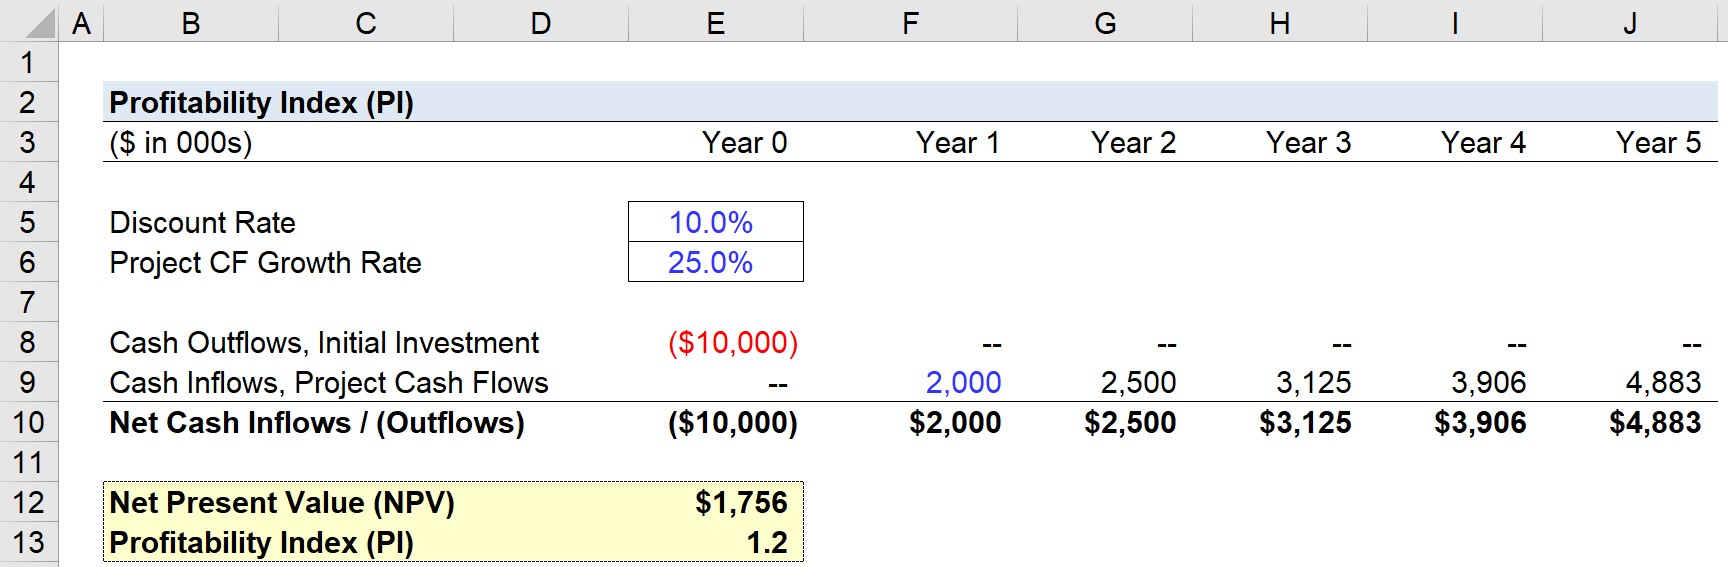
Suppose we're evaluating a proposed five-year project with the following assumptions.
The cost of funding the project is $10 million, and the amount of cash flows generated in Year 1 is $2 million, which will grow by a growth rate of 25% each year.
We can now calculate the net present value (NPV) of the project using the NPV function in Excel:
The net present value (NPV) is $1,756,382.
In the subsequent step, we can now calculate the project's PI given the NPV from the prior step.
The profitability index formula consists of two parts:
Therefore, the formula divides the present value (PV) of the project's future cash flows by the initial investment.
In conclusion, the profitability index of our five-year project is 1.2, so the project seems likely to be accepted unless there are other projects with higher NPVs and profitability indices that are also under consideration.

Enroll in The Premium Package: Learn Financial Statement Modeling, DCF, M&A, LBO and Comps. The same training program used at top investment banks.


No comments yet.