What is Degree of Total Leverage?
The Degree of Total Leverage (DTL) ratio estimates the sensitivity of a company’s net income to changes in the number of units sold.

The Degree of Total Leverage (DTL) ratio estimates the sensitivity of a company’s net income to changes in the number of units sold.
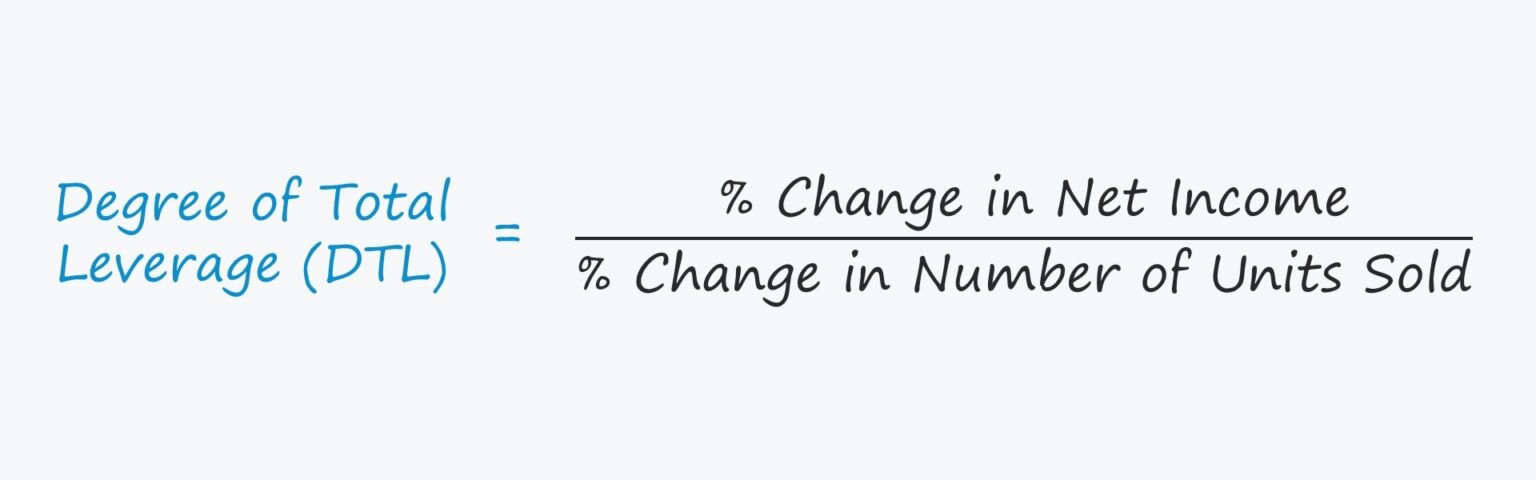
The degree of total leverage (DTL) refers to the sensitivity of a company’s net income, with respect to the number of units sold.
The DTL metric accounts for both the degree of operating leverage (DOL) and the degree of financial leverage (DFL).
The DTL can be interpreted as stating, “For each 1% change in number of units sold, the company's net income will increase (or decrease) by ___%”.
Thus, the degree of total leverage (DTL) quantifies a company’s total leverage, which is composed of operating and financial leverage.
The general guidelines for interpreting the two metrics are as follows:
The total leverage of a company — operating leverage and financial leverage — can contribute towards magnified earnings and profit margins, both positively and negatively.
One method to calculate the degree of total leverage (DTL) is to multiply the degree of operating leverage (DOL) by the degree of financial leverage (DFL).
Suppose a company has a degree of operating leverage (DOL) of 1.20x and a degree of financial leverage (DFL) of 1.25x.
The company's degree of total leverage is equal to the product of DOL and DFL, which comes out to 1.50x
A different method to calculate the DTL consists of dividing the % change in net income by the % change in number of units sold.
Suppose a company experienced an off-year, where sales declined by 4.0%.
If we assume the company's DTL is 1.5x, the percentage change in net income can be calculated by re-arranging the formula from above.
DTL is equal to the % change in net income divided by the % change in units sold, so the implied % change in net income comes out to the % change in sales multiplied by the DTL.
The final formula to calculate the degree of total leverage (DTL) that we’ll discuss is shown below.
The contribution margin equals "Quantity Sold × (Unit Price – Variable Cost Per Unit)," so the formula can be further expanded to:
Where:
For example, let’s assume that a company has sold 1,000 units at a unit price of $5.00.
If the variable cost per unit is $2.00, fixed costs are $400, and interest expense is $200, then the DTL is 1.25x.
Therefore, if the company were to sell 1% more units, its net income would be anticipated to rise by approximately 1.25%.

Enroll in The Premium Package: Learn Financial Statement Modeling, DCF, M&A, LBO and Comps. The same training program used at top investment banks.


No comments yet.