What is Equity Multiplier?
The Equity Multiplier ratio measures the proportion of a company’s assets funded by its equity shareholders as opposed to debt providers.

The Equity Multiplier ratio measures the proportion of a company’s assets funded by its equity shareholders as opposed to debt providers.

The formula for calculating the equity multiplier consists of dividing a company’s total asset balance by its total shareholders' equity.
For instance, if a company has an equity multiplier of 2x, the takeaway is that financing is split equally between equity and debt.
The equity multiplier is one of the ratios that make up the DuPont analysis, which is a framework to calculate the return on equity (ROE) of companies.
In the three-step DuPont analysis variation, the equity multiplier is multiplied by the net profit margin and asset turnover.
Where:
Revenue and net income each represent income statement metrics, meaning that they measure across a period of time – whereas assets and equity are balance sheet metrics, which are the carrying values at a specific point in time.
To match the timing between the denominator and numerator among all three ratios, the average balance is used (i.e. between the beginning and end of period value for balance sheet metrics).
Higher equity multipliers typically signify that the company is utilizing a high percentage of debt in its capital structure to finance working capital needs and asset purchases.
More reliance on debt financing results in higher credit risk – all else being equal.
By contrast, a lower multiplier means that the company has less reliance on debt (and reduced default risk).
Therefore, a lower multiplier is usually perceived as better, since the company is relying more on equity contributed by the owners (e.g. founders, institutional investors), as well as its retained earnings.
But as is the case for practically all financial metrics, the determination of whether a company’s equity multiplier is high (or low) is dependent on the industry average and that of comparable peers.
Another exception is for mature, established companies with high debt capacities, as one “economic moat” of the company is its access to financing with favorable lending terms (and ability to purchase inventory from suppliers at lower prices due to buying power).
We’ll now move to a modeling exercise, which you can access by filling out the form below.


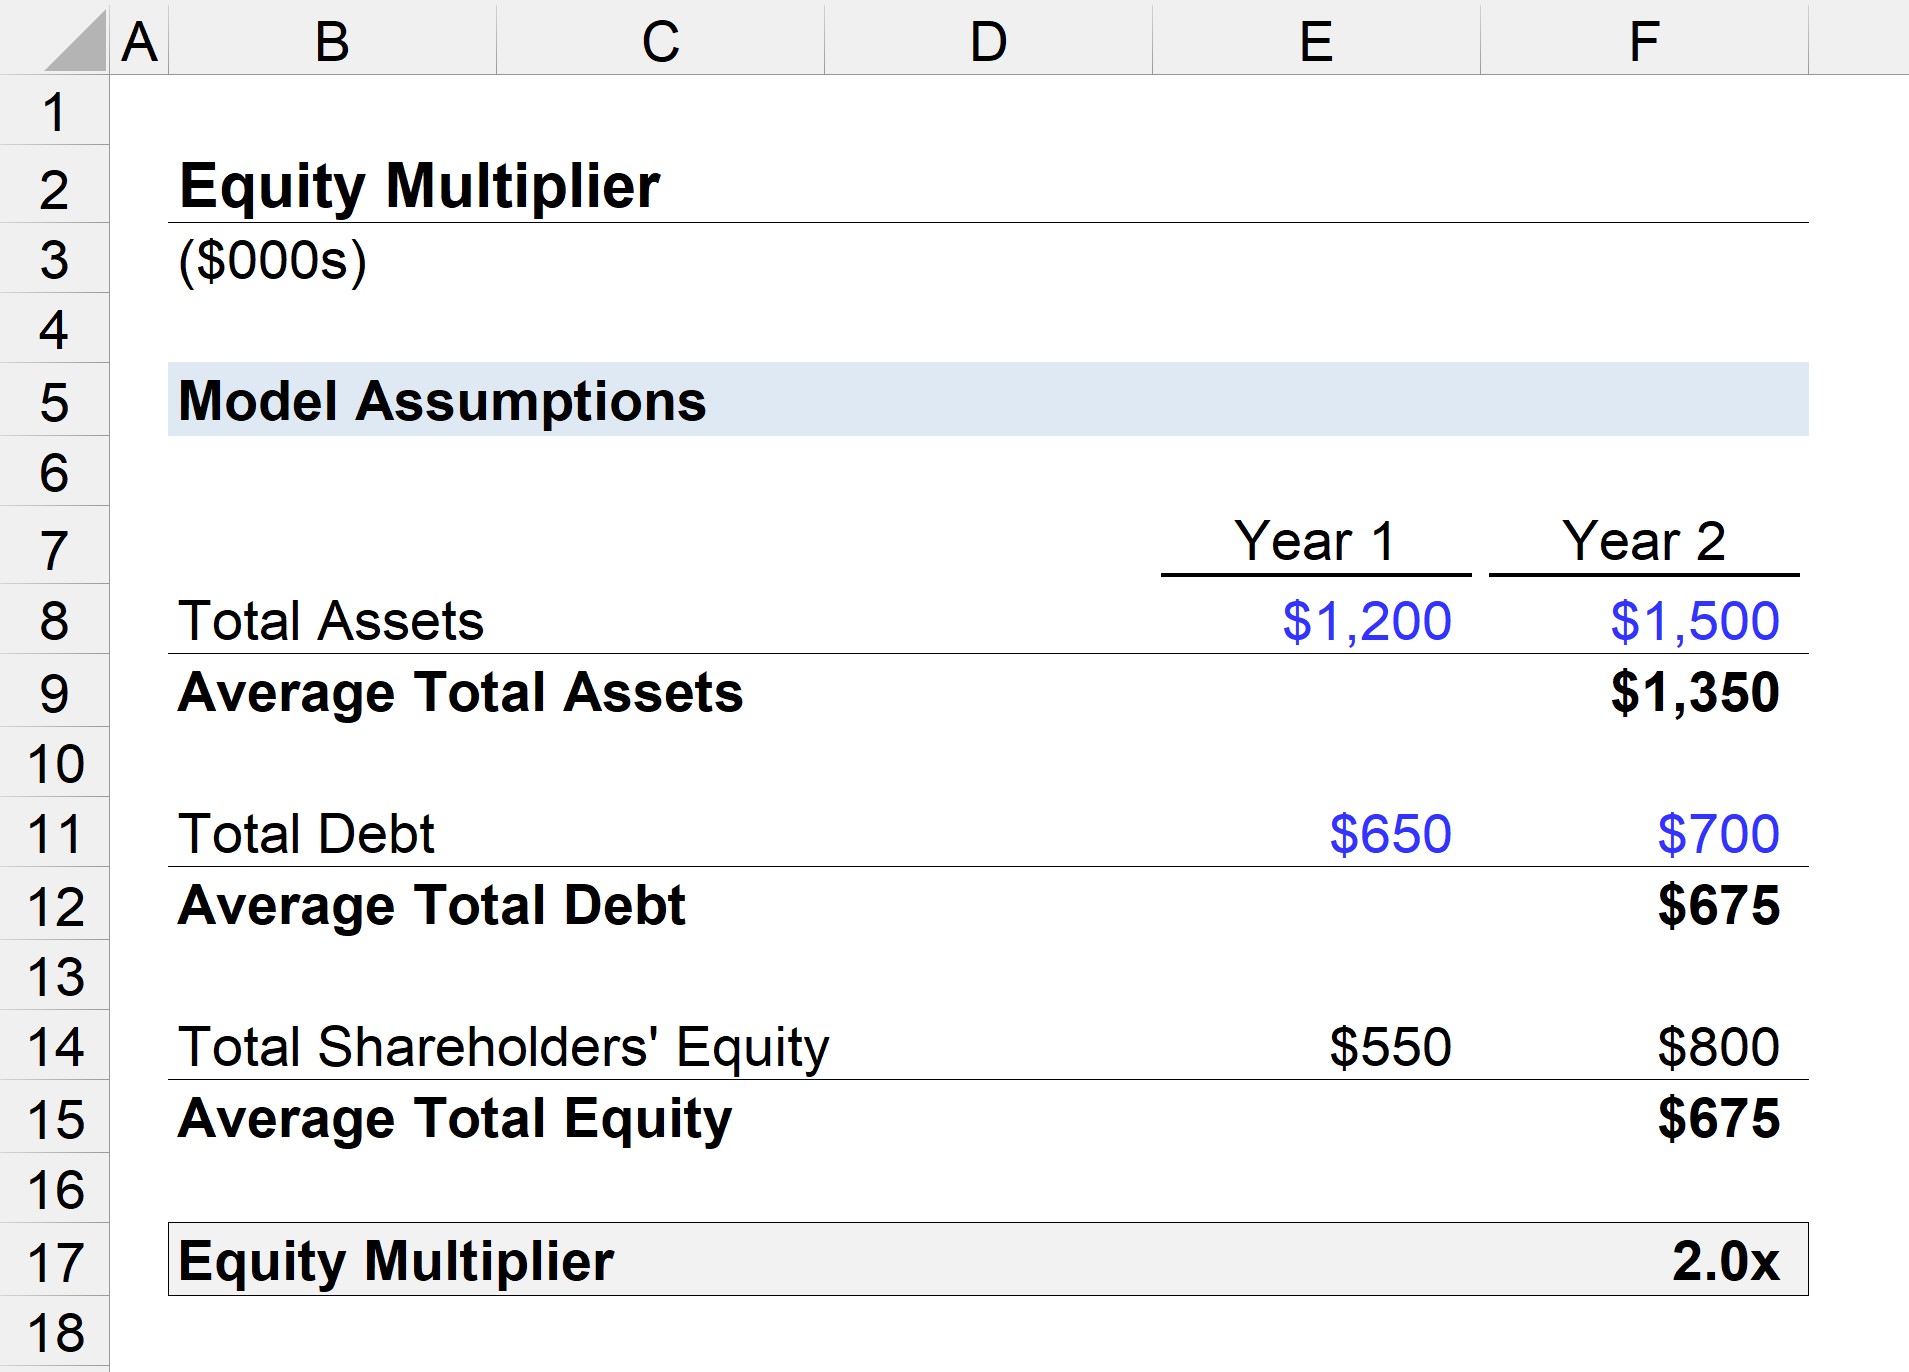
For our illustrative scenario, we will calculate the equity multiplier of a company with the following balance sheet data.
Year 1 Financials:
Year 2 Financials:
To calculate the shareholders' equity account, our model assumes that the only liabilities are the total debt, so the equity is equal to total assets subtracted by total debt.
Given these assumptions, we can calculate the average balance for each:
In the final step, we will input these figures into our formula from earlier, which divides the average total assets by the total shareholder's equity.
The company in our illustrative example has an equity multiplier of 2.0x, so the $1.35m assets on its balance sheet were funded equally between debt and equity, with each contributing $675k.

Enroll in The Premium Package: Learn Financial Statement Modeling, DCF, M&A, LBO and Comps. The same training program used at top investment banks.


No comments yet.